Dr. Raymond W. Schmitt
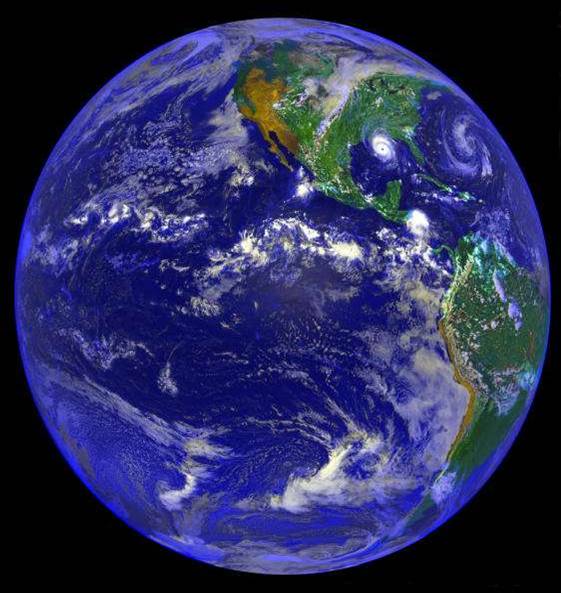
A look at the Earth from space reveals a mostly blue planet. The domination of earth’s surface by the oceans is quite clear. As Arthur C. Clark once said, "How inappropriate to call this planet Earth when clearly it is Ocean”.This deep blue mass of water has major implications for the climate of the Earth. It means that most of the Sun’s energy is absorbed into the ocean. It also means that this fluid body, with its huge heat capacity (1100 times that of the atmosphere) is the main reservoir for heat on the planet. And of course the ocean is the primary reservoir for water. Most of the water we experience as rain has come from the ocean, which is the principal source of water for the atmosphere.
A Traditional Depiction of the Global Water Cycle
Salinity and Evaporation - Precipitation
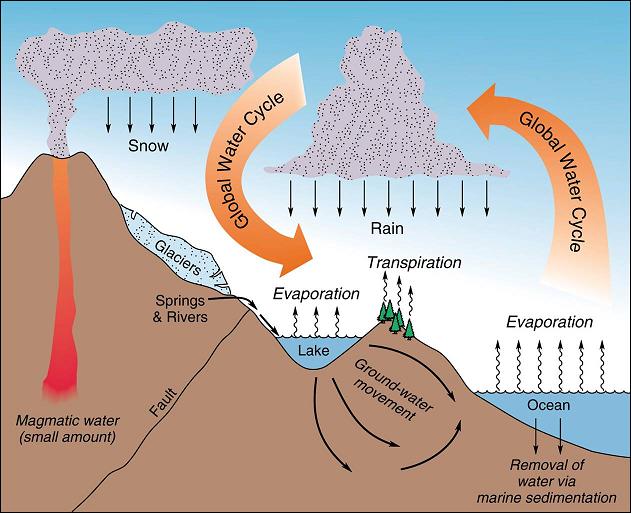
In contact with both the oceans and the continents, the thin, transparent atmosphere acts as a conduit connecting the terrestrial and oceanic components of the water cycle. Figure 2 is a traditional depiction of the global water cycle as viewed by hydrologists. It focuses on the processes of most interest to society, but gives a distorted picture of the role of the oceans. Relegating the oceans to a small corner of the diagram conveys a very inaccurate picture. In fact, the oceans cover the majority of the earth and hold 97% of the free (not chemically bound) water on the planet, comprising both the primary source of water evaporated into the atmosphere and the main site of precipitation. We estimate that 86% of global evaporation and 78% of global precipitation occurs over the oceans. Surely, the oceans deserve a more prominent place in any depiction of the water cycle!
A Better Perspective
Relative Roles
A look at the volumes associated with the components of the water cycle (Figure 3) leads to a better perspective on the relative roles of ocean atmosphere and land. To focus only upon terrestrial fluxes, ignoring the oceanic component, would overlook the ocean-atmosphere interface that plays a critical role in maintaining the terrestrial moisture balance (Figure 3). The oceans function as a reservoir and buffer in the planetary circulation of water. Storing 23 times the water on land and a million times the water in the atmosphere, the ocean’s air-sea fluxes are many times larger than the terrestrial equivalents.
Past Limitations
Until recently, the vastness of the world’s oceans and the absence of rainfall and evaporation sensors represented a barrier to the study of the oceanic hydrologic cycle. These limitations of the past left a void in observations of precipitation or evaporation over the ocean that made quantifying the water cycle over the ocean difficult. And mankind’s natural focus on its own water supply meant the large oceanic water cycle received little attention. However, new satellite observations of rainfall and improved data sets of meteorological conditions over the oceans have afforded us an improved understanding of the oceanic water cycle.
Evaporation and Precipitation
Modern Estimates
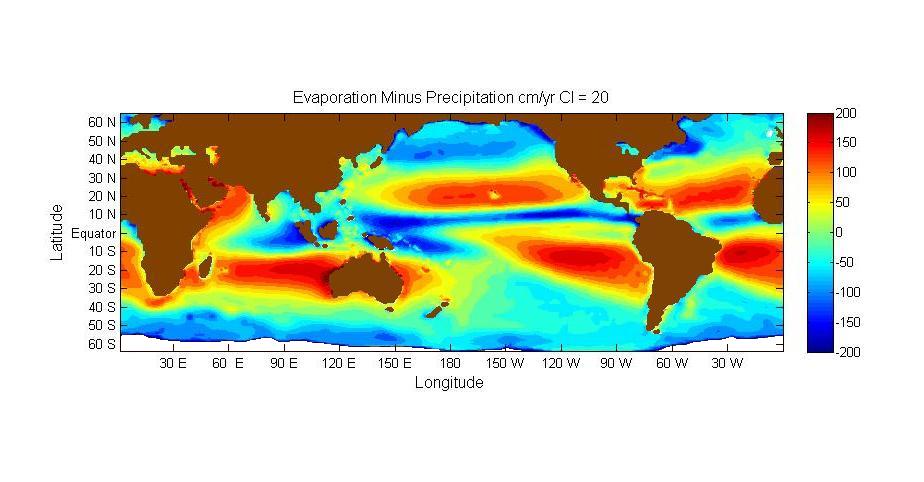
We have compiled modern estimates of evaporation and precipitation over the ocean to develop a more complete picture of water fluxes across the air-sea interface.Taking the difference between evaporation (E) and precipitation (P) tells us the net gain or loss of water by the ocean.A new map of E-P shows where water evaporates (red) and precipitates (blue) (Figure 4.) The mid-latitude regions of the oceans tend to be dominated by evaporation under the trade winds. These regions supply water to the atmosphere, which transports it to a low latitude rainfall region known as the “Inter-tropical Convergence Zone” (ITCZ). This is where rising warm, moist air drops its moisture burden back on the sea. The high latitude oceans also tend to gain more water from rain than is lost to evaporation.
An Alternative Schematic
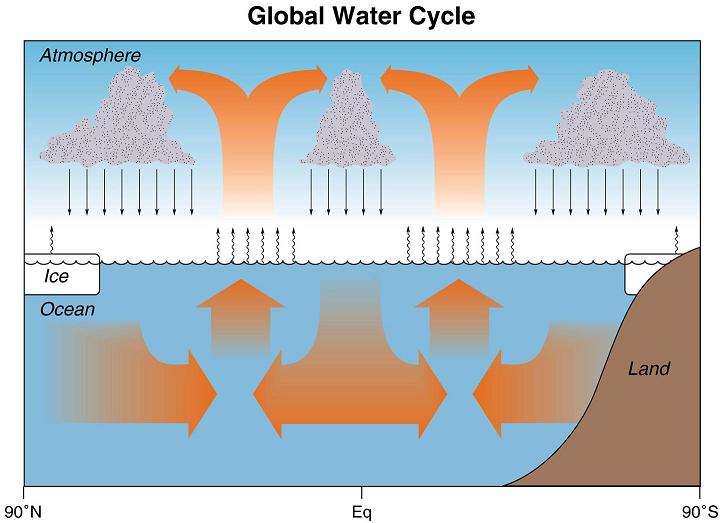
This pattern of mid-latitude evaporation and high and low-latitude precipitation leads us to propose an alternative schematic for the “Global Water Cycle” (Figure 5). It more accurately depicts the dominance of the ocean-atmosphere processes, and delegates land processes to a more suitable minor role. It is drawn as a north-south section and shows the atmosphere carrying water vapor from evaporation to precipitation regions. It also shows the complementary return flows induced in the ocean. Without those oceanic return flows, regional sea level trends of up to 10 meters per year would develop! This diagram is an oceanographer’s view of the global water cycle.
Oceanic Fluxes
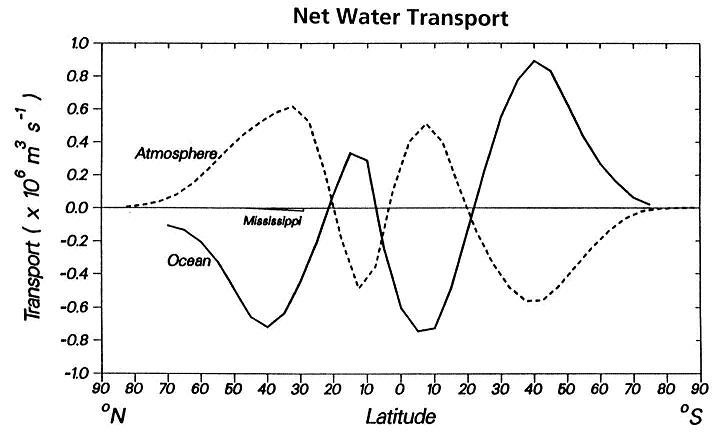
Our estimates of the flux of water into and out of the ocean can be integrated over its surface all around the globe. This provides a view of the strength of the oceanic return flows (Figure 6). Similarly, measurements of the strength of north-south winds and their moisture content allow estimates of the meridional transport of water by the atmosphere. The two curves are largely complementary, showing that it is primarily the oceans that maintain the water balance. One can also see from the curve labeled “Mississippi” that north-south transports of water by rivers are quite small by comparison. Thus, in discussing the “Global Water Cycle”, it is truly misleading to neglect the dominant oceanic component.
Salinity
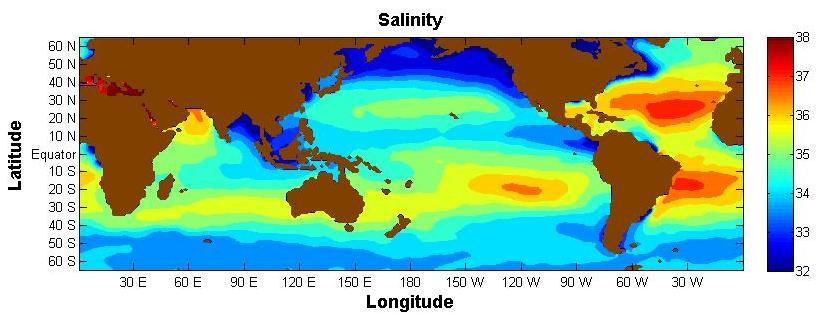
The oceanographer does have one tool to help understand the poorly sampled water cycle over the ocean: the oceanic salt content or salinity. Evaporation leaves salt behind, thereby increasing salinity; precipitation dilutes the salt content and freshens surface waters. Salinity can be thought of as analogous to humidity in the atmosphere. The general patterns of surface salinity reflect the workings of the global water cycle, the mid-latitude evaporation zones have high salinity, while precipitation zones at high and low latitudes have low salinity (Figure 7). Salinity is much harder to measure than temperature, so there is not nearly so much historical data to examine for climatological trends. However, we have reason to be optimistic about the future; the ARGO program of profiling floats is rapidly expanding the number of salinity profiles available around the globe ( http://www.argo.ucsd.edu/ ), a new salinity-sensing satellite (AQUARIUS https://www.nasa.gov/mission_pages/aquarius/overview/index.html ) is due to be launched in 2010, and here at WHOI we have been developing new foul-proof salinity sensors for deployment on surface drifters and moorings. One of the most striking features of the surface salinity pattern is the higher salinity of the Atlantic Ocean. This may be largely due to loss of water vapor to the Pacific across Central America, and the lack of water supply from the Sahara. These higher salinities mean higher seawater densities, so that the North Atlantic hosts a main sinking site of the meridional overturning circulation. There surface waters flow north to become cooled by the atmosphere to become dense water which sinks to depth and flows southward. A great deal of heat transport is associated with this overturning circulation, which is believed to have been disrupted by glacial meltwater in the past. Thus, salinity is intimately tied to the general circulation of the ocean and the climate of Earth.
We acknowledge the National Science Foundation for generous support of this research.
The Water Cycle and Global Warming
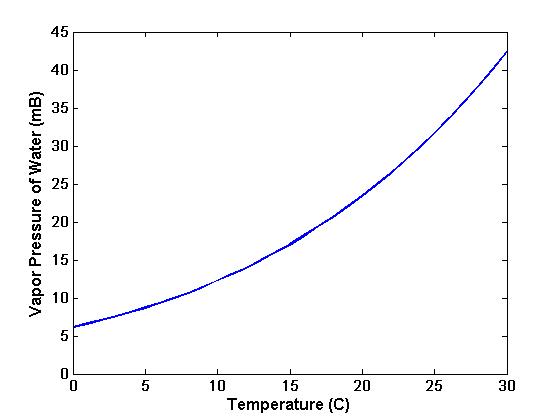
One aspect of concern for the future is how the water cycle will respond to global warming. This is dictated by the physics of water vapor in the air. A warm atmosphere can hold much more water vapor than a cold atmosphere (something we all experience with seasonal humidity changes). The water carrying capacity of the air is governed by the vapor pressure dependence on temperature, plotted here in Figure 8. We see a strong non-linear dependence of vapor pressure on temperature. At the present mean global surface air temperature of 14 degrees C, the vapor pressure increases about 7% for each one degree increase in temperature. Other things being equal (winds, cloudiness etc) we may expect an intensification of the water cycle of 7% per degree of global warming. This means more intense droughts in some regions, stronger rainfall in others. In many ways, society is more vulnerable to changes in the water cycle than to temperature changes alone. Since most of the water cycle is between atmosphere and ocean, we expect that the oceanic salinity field will be an excellent indicator of a changing water cycle. We thus view it as an especially important climate variable to monitor.
