Research
Research Overview
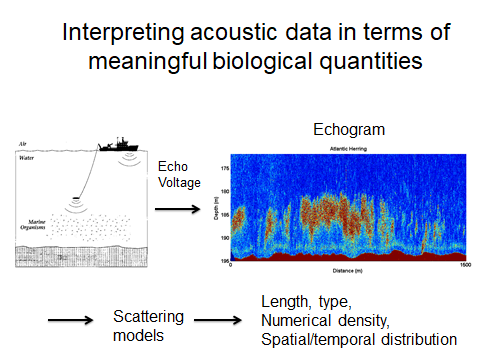
This illustration summarizes the essence of what I do. I develop advanced methods for the use of active acoustics to study marine life. While the focus has been on developing acoustic scattering models of fish and zooplankton, I have also developed experimental methods and instrumentation (laboratory and at-sea). All methods are grounded in knowledge of the physics of the scattering processes. Illustration from Stanton’s tutorial in 2014 on broadband acoustics, presented at MTS/IEEE Oceans14 conference in Taipei. See also my review paper: Stanton, T.K. (2012) “30 years of advances in active bioacoustics: A personal perspective,” Methods in Oceanography, doi:10.1016/j.mio.2012.07.002, 49-77.
The Research Challenge
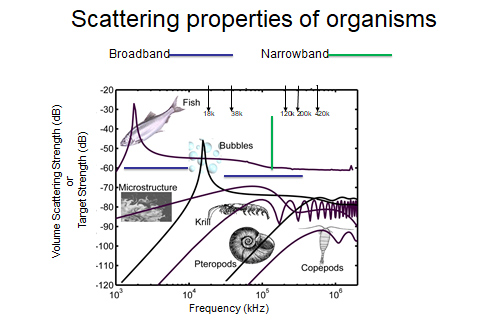
There is a wide a variety of sources of scattering in the aquatic environment—biological and physical--- all with different scattering properties. With this great diversity of scattering properties, there is a corresponding great challenge in interpreting acoustic scattering data, especially when there is more than one type of scatterer present. This figure was developed by Stanton, Lavery, and colleagues at WHOI and appears in various papers in different forms, including in Lavery et al. (2007). It also shows the broadband and narrowband frequencies used in some of our work.
Experimental Determination of Dominant Scattering Mechanisms
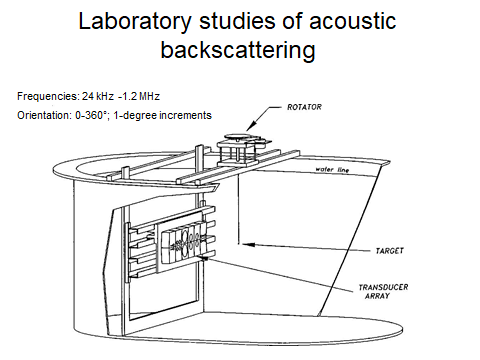
Our laboratory measurements have helped to identify dominant scattering mechanisms of a variety of marine organisms. The measurements spanned the frequencies 24 kHz – 1.2 MHz. The organisms were tethered by various means (including with human hair), and were rotated 0-360 degrees in 1-degree increments. We conducted most measurements on land, but took the tank to sea (on the deck of a ship) on two occasions so that we could study live freshly caught organisms. Illustration from Stanton et al. (2000).
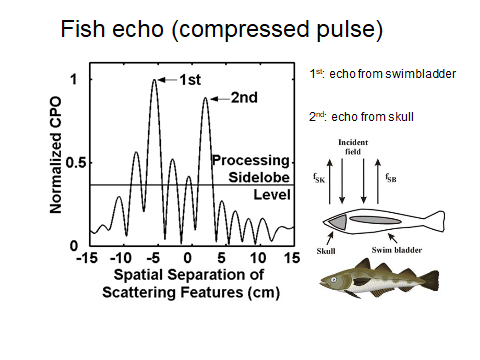
Using pulse-compression signal processing on our broadband signals, we have been able to resolve individual features of various organisms. In this illustration, we could resolve the echoes from the skull and swimbladder of a fish. In other studies (not shown), we could resolve the echo from the dorsal and ventral sides of a euphausiid (a shrimp-like organism). From Reeder et al. (2004).
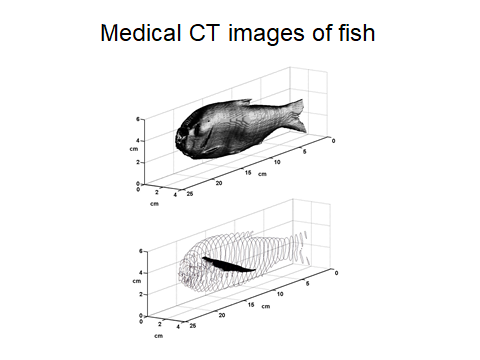
Development of the acoustic scattering models required high resolution 3D information on the morphology of the organism. This illustration shows the information derived from our medical CT scans of a fish (upper panel: outer boundary of fish body and lower panel: swimbladder). We have also done the same for a variety of zooplankton. From Reeder et al. (2004).
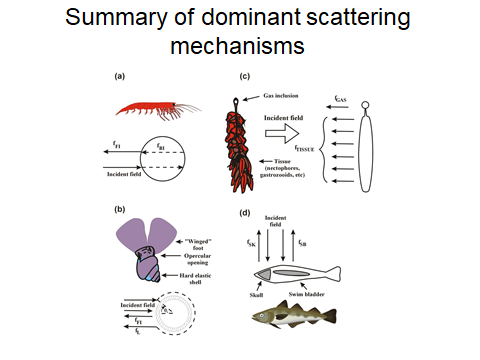
Through controlled acoustic scattering measurements of a variety of marine life, we have identified dominant scattering mechanisms specific to their shapes and material properties. This information was then used in our development of advanced acoustic scattering models. The acoustic models were generally categorized according to “gross anatomical groups” rather than particular species. For example, a decapod shrimp and euphausiid, although different species, are in the same anatomical group, acoustically, as they are both elongated, have weakly scattering tissue, and have no gas or hard elastic shell. Adapted from Stanton et al. (1996).
Modeling of Acoustic Scattering
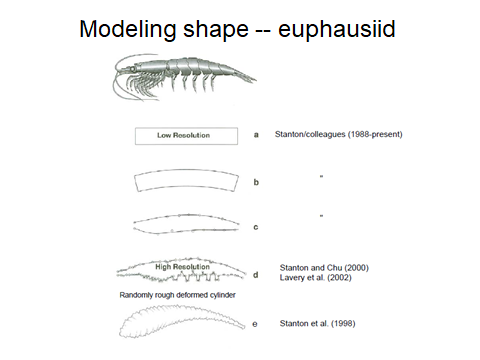
When I entered this field, all zooplankton were treated alike--- as spheres. We have developed advanced models that accurately model the shape of elongated organisms, ranging from the deformed bent cylinder through a full 3D model. Differences in material properties are also taken into account (fluid-like, gas-bearing, hard elastic shell) which had not been done to any significant extent before. From review paper: Stanton (2009).
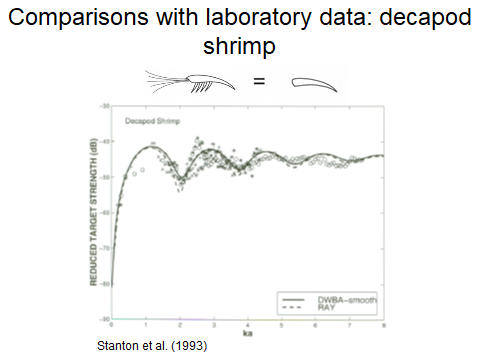
This is an example of how well the models fit laboratory data that we collected. The acoustic frequencies spanned 50 kHz – 1.2 MHz. Two models were used—a simple ray-based model and a more sophisticated DWBA model. Both gave surprisingly similar results, which demonstrates that under many important conditions, simpler models can suffice.
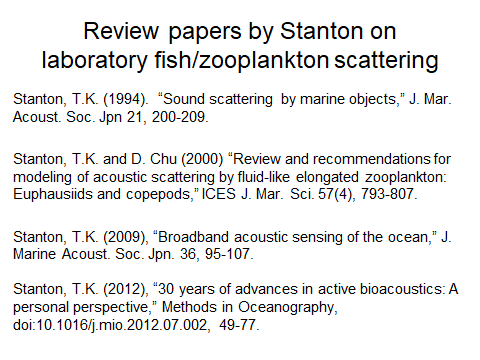
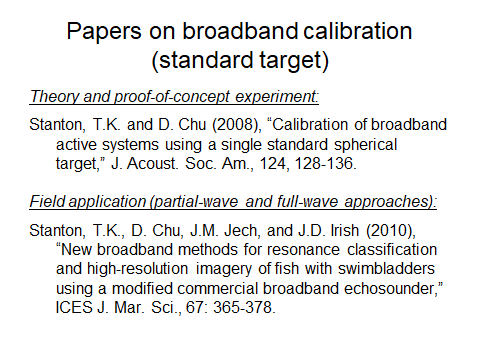
These papers review both laboratory methods and scattering models that we have developed for fish and various types of zooplankton.
Measurements at Sea - Fish
The below studies involved development of broadband ocean instrumentation and associated methods to study fish. The work was based, in part, on what we developed in the laboratory. The work was focused on swimbladder-bearing fish and associated resonance classification techniques, but the methods are broadly applicable to fish without swimbladders and zooplankton.
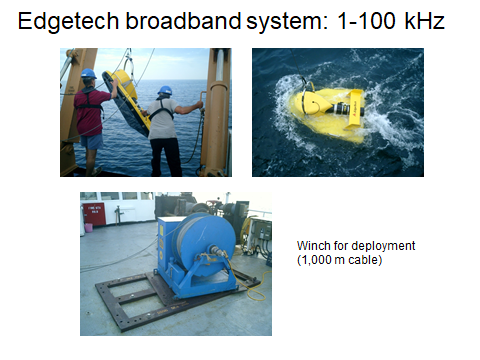
Deployment of our broadband acoustic system, built by Edgetech. This is a modified version of a commercially available system that was originally designed by Edgetech to be a sub-bottom profiler. One of the modifications was to include more receiver elements to greatly improve receiver sensitivity for detection of echoes from fish. Adapted from Stanton et al. (2010).
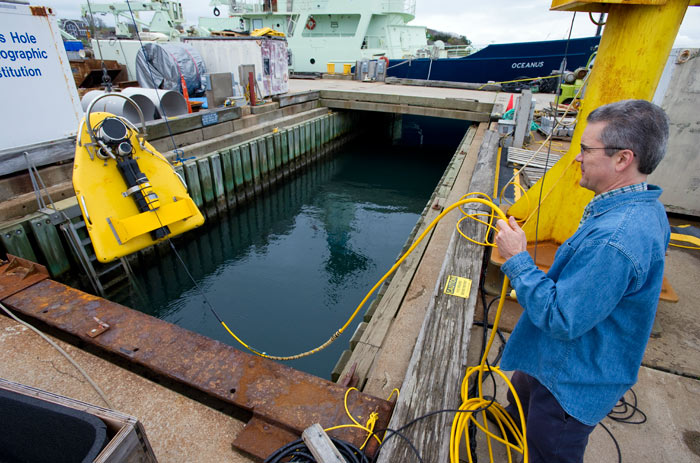 In preparation for our sea experiments, we spent many days at the test well in the WHOI pier testing the equipment. This well is about 60’ deep and has a crane and equipment van for our topside electronics. Tim Stanton is shown in this test (ca 2011).
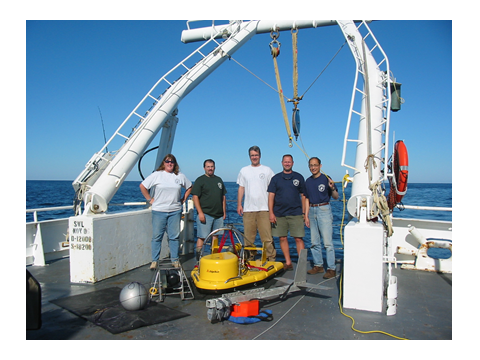
End of successful offshore experiment (2007). Left to right: Cindy Sellers, Josh Eaton, Tim Stanton, Mike Jech, and Dezhang Chu. The large sphere (30-cm-diameter solid aluminum) in the foreground was used to calibrate the acoustics channels.
Using Broadband Acoustics to Improve Resolution
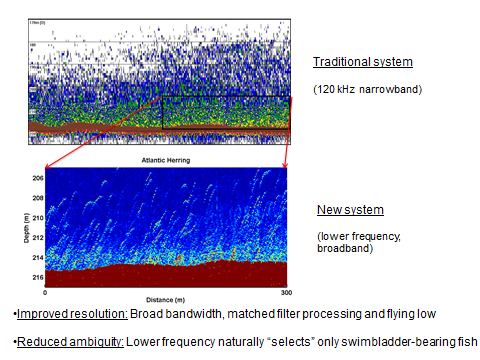
By towing the system deep and using pulse-compression processing on the broadband acoustic signal, individual fish could be resolved (lower panel), as opposed to the corresponding echogram (upper panel) from the ship-mounted narrowband echosounder that could not resolve the fish. Adapted from Stanton et al. (2010).
Using Broadband Acoustics to Determine Size of Fish
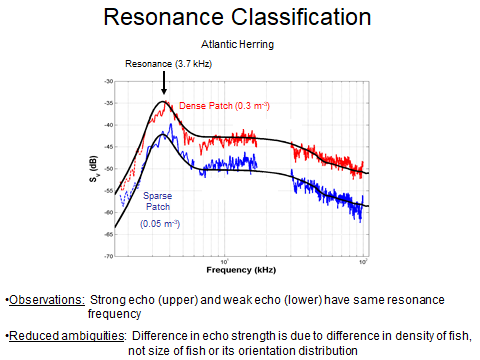
The swimbladder (a gas-filled organ) of these 25-cm-long herring resonated at 3.7 kHz at these deep depths. This resonance classification method reduces or eliminates ambiguities in interpretation of acoustic data. This resonance remained at the same frequency for two different patches of fish--- one with a strong echo (red curve) and one with a weak echo (blue curve). The fact that the resonance frequency remained the same across the two patches showed that it was a change in numerical density, not size or orientation of fish, that caused the change in echo level. From Stanton et al. (2010).
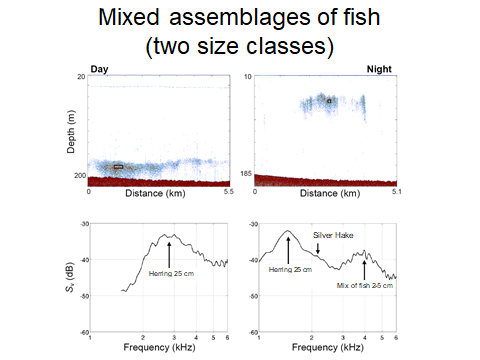
An assemblage of fish containing two distinct size classes--- 25 cm and 3-5 cm—results in resonances at correspondingly two distinct frequencies. Through spectral analysis of the broadband echoes, the different sized fish can be spectral resolved (and, hence, quantified), even though they are not spatially resolved. Note that the resonance frequency of the herring decreased as they migrated upwards in the water column (deep in left panel, shallow in right panel). Adapted from Stanton et al. (2012).
Calibration of Broadband System
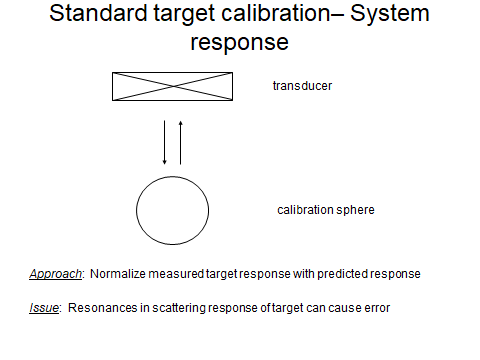
We use a standard target (metallic sphere in this case) with known properties. The challenge is the fact that, since the broadband acoustic signal spans such a large frequency range, it encounters strong resonances (in the form of deep nulls) in the signal that cannot easily be directly removed.
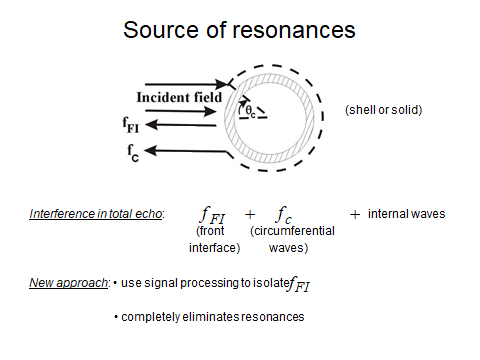
The resonances in echoes from a sphere are due to interferences from the various types of waves associated with the scattering process. In this example, two waves are shown, one is the “specular” echo from the front interface and the other is the circumferential wave that travels around the boundary. These two waves alone will combine in both constructive and destructive interference, depending upon the size and material properties of the sphere, as well as acoustic frequency. Since the specular echo arrives first, the interference between the specular echo and all other waves that come in later can be eliminated by selecting (via a sampling time window) the specular echo first and not sampling the waves arriving later. This is facilitated through use of pulse-compression processing that reduces the duration of the echo to the inverse bandwidth of the signal. Illustration from Stanton’s tutorial in 2014 on broadband acoustics, presented at MTS/IEEE Oceans2014 conference in Taipei.
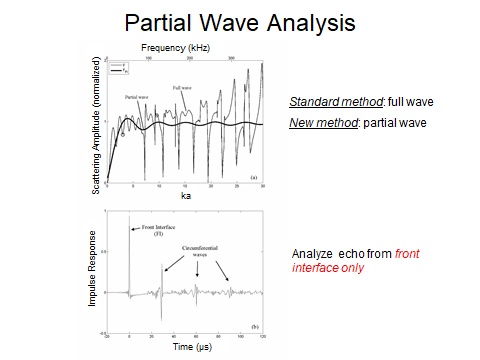
Analysis of the specular echo in isolation through the elimination of all subsequent interfering waves is referred to as a “partial wave analysis”. The frequency response of the specular echo is slowly varying with no resonance and straight forward to use for the calibration (thick curve, upper panel). This type of analysis is facilitated through use of pulse-compression processing and a sphere that is much larger than cm-sized ones previously used in calibration acoustic systems. From Stanton and Chu (2008).