Effect of Age on Seismic Properties and Velocity
Quaternary Paleoseismicity Research // Sediment Properties and Velocity Research // Lake Flooding Research
The Effects of 180 Years of Aging on the Physical and Seismic Properties of Sands
Constraining how both the physical properties and seismic responses of recently deposits sands change with time is important for understanding earthquake site response, subsurface fluid flow, and the early stages of sandstone lithification. Currently, however, there is no detailed (cm-scale) assessment of how sand physical properties and associated seismic velocities evolve over the first 1-2 centuries sand deposition. This study integrates sand-sedimentation rate estimates with seismic velocity and physical properties data to determine how the physical properties of vadose zone sands (upper 1.8-2.2 m) change within 180 years after deposition.
The analyses at four sites along Port Royal beach Jamaica (Fig.1) show that compressional and shear wave velocities increase with sediment age whereas porosity, grain size, sorting, mineralogy and cementation fraction remain relatively unchanged during the same period. Though rock physics models (constrained by measured physical properties) predict constant seismic velocities, we observe larger misfits between modeled and observed velocities with sediment age. To explain the difference between models and observations, this study proposes that shallow sands undergo microstructural matrix changes (e.g., grain rolling, rotation, and slippage) that lead to a more uniform distribution of grain contact forces and a resulting increase in seismic velocities with time. The results imply that natural siliciclastic beach sands undergo a previously undocumented lithification process (similar to aging via contact creep) that occurs before compaction.
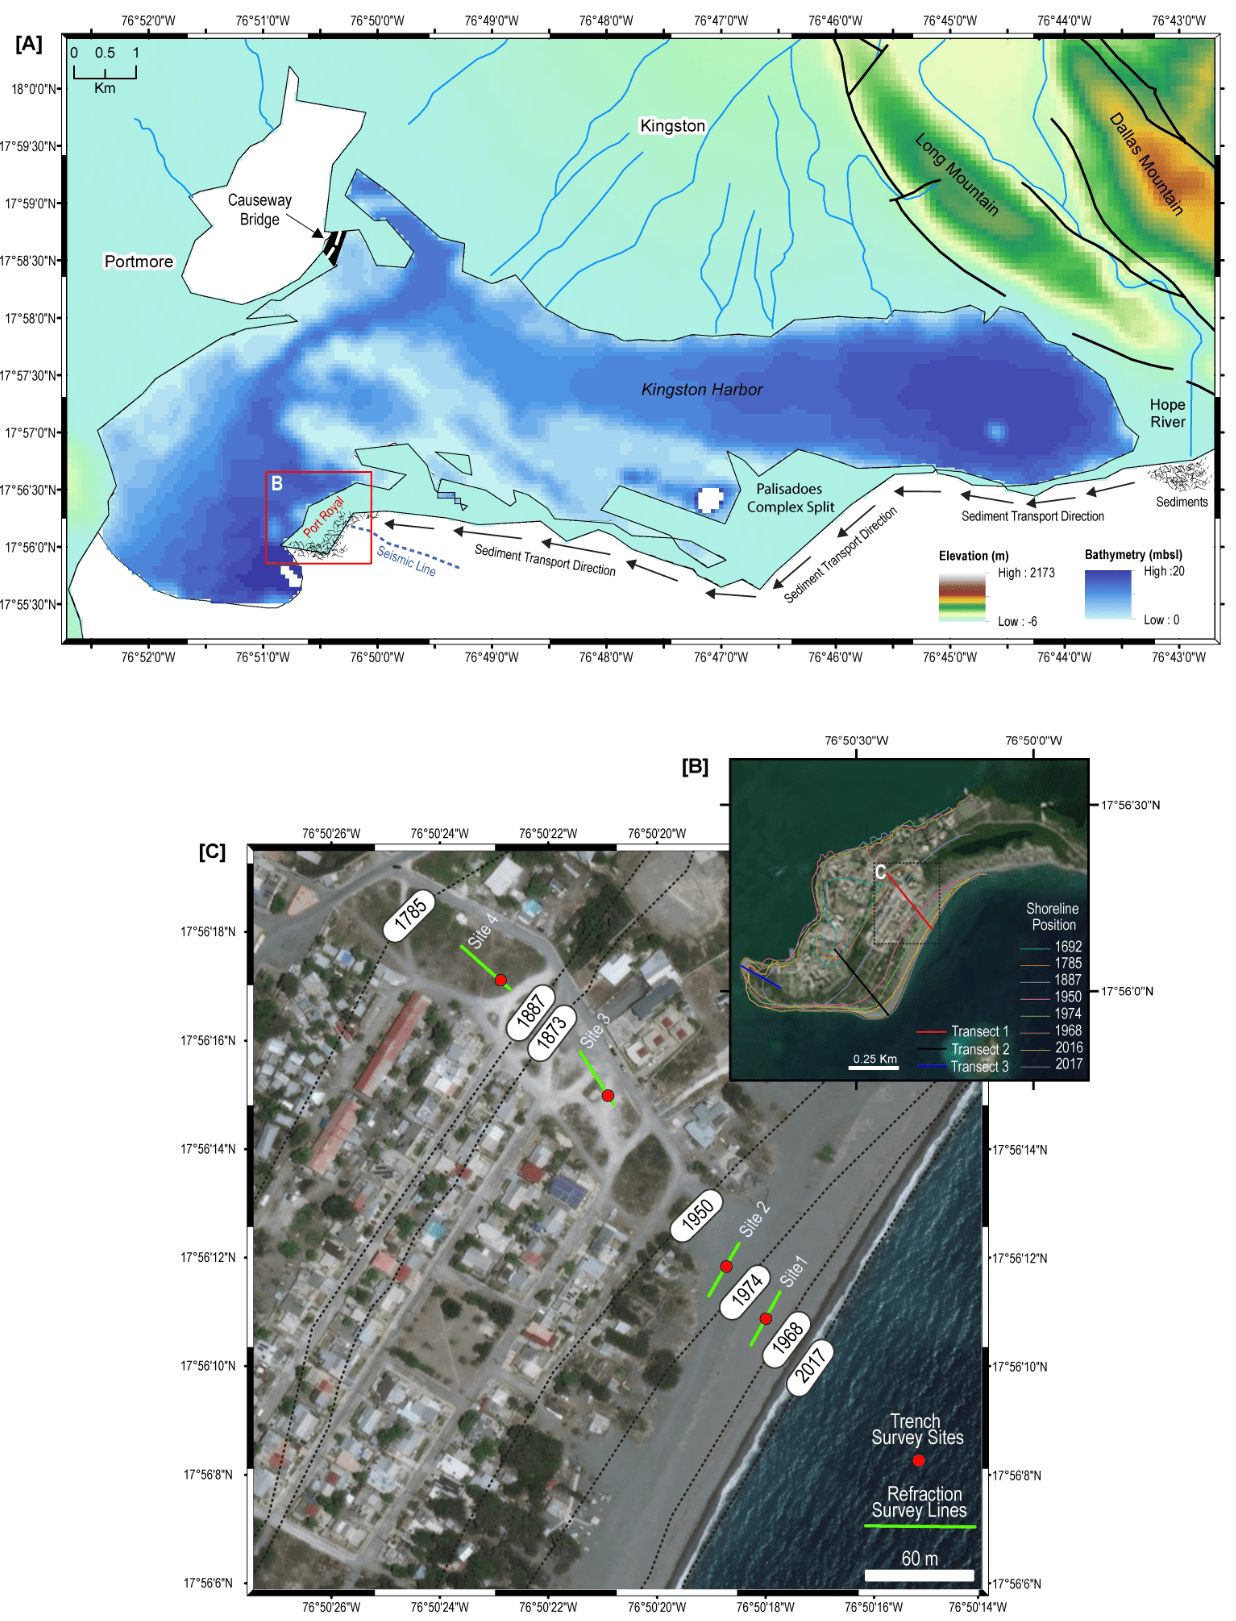
Figure 1. (A) Topographic map of Kingston Jamaica with locations for Port Royal and the Palisadoes Complex Spit identified. Blue dashed line is a seismic-reflection profile (Wright et al., 2019) used to determine slope. (B) Aerial Imagery map of Port Royal Jamaica showing shoreline positions and transects where we estimate sediment progradation rates, which were highest between sites 2-3 and lowest between sites 1 and 4. Site 1-4’s sediments were deposited between 1988-2016, 1956-1974, 1909-1923, and 1837-1862, respectively.