Data Analysis
Plotting Storm Events
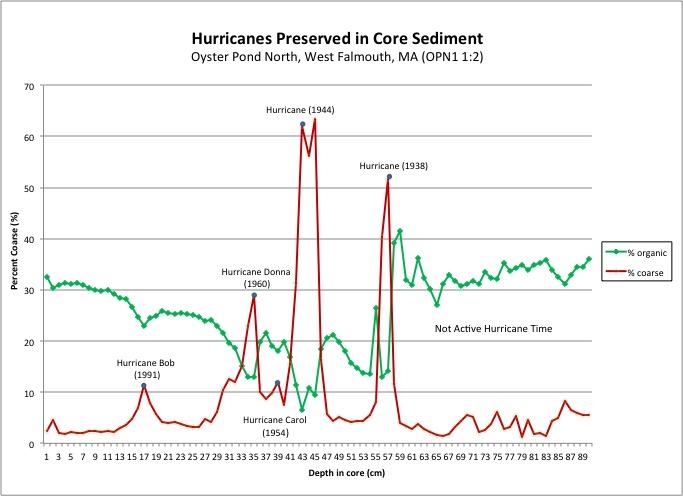
After the sediment is sieved, we weigh the coarse material left over. Then we make a graph showing how the amount of coarse material changes with depth in the core. Most of the spikes visible in the graph are indicative of hurricanes which occurred in the past. Some of the recent hurricanes that we know the names of are even labeled in this example!

