
CAFE
Offshore Washington State, the seafloor is in collision with the continent and, as a result, is pushed beneath the continent and down into the mantle. This process of subduction results in the generation of large earthquakes, some of them capable of generating tsunamis, and is also responsible for the volcanism along the Cascadia arc at volcanoes such as Mount St. Helens. The volcanic process begins deep beneath the Earth’s surface when fluids carried down by the seafloor plate are released causing the mantle to melt.
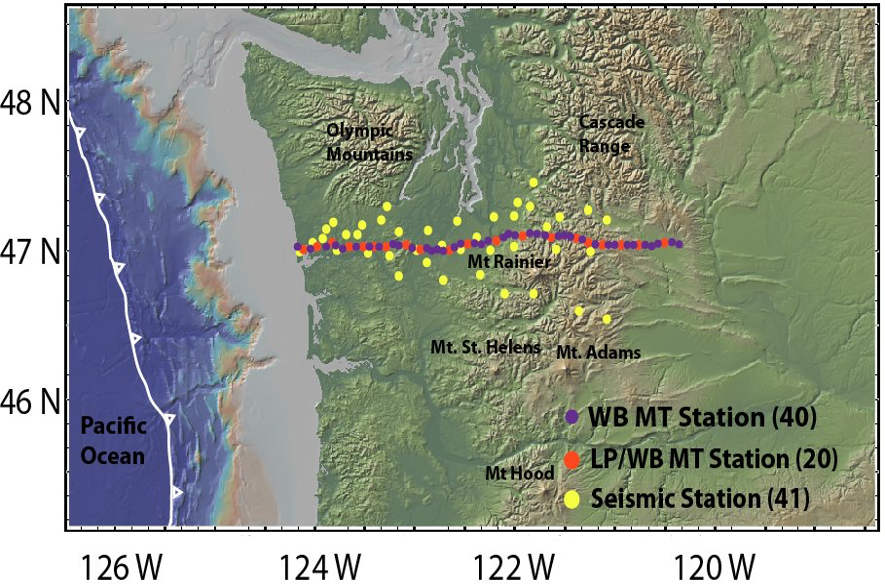
Figure 1. A Map showing station locations for the CAFE seismic and magnetotelluric stations (broadband and long-period) across central Washington State.
MT data were collected in an East-West profile through Washington state, along a line roughly coincident with the previous Café seismic experiment (Figure 1). The PhD student working on the MT data also analysed a subset of the seismic data and used constraints from the seismic image to inform the MT data modeling.
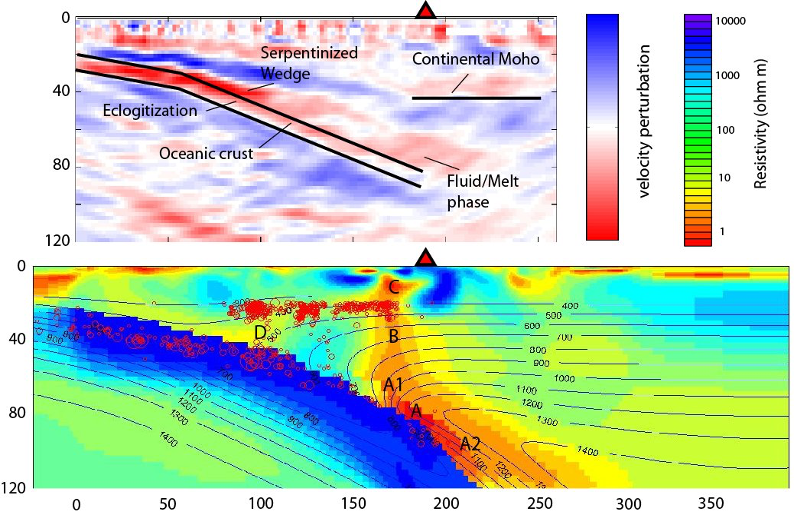
Seismic and MT models for the Café Line Data. The top model shows a seismic velocity distribution in the subsurface [McGary et al, submitted]. The bottom model shows the primary MT inversion image for the CAFE line and includes both a thermal profile [Van Keken et al., 2010] and the location of earthquake hypocenters (red circles) [McCrory et al., 2012]. Fluids and Melts are more conductive (orange-red colors in the model). Fluid is released from the subducting slab and enters the overlying mantle wedge at A. Melt is initiated at or very near the interface and is transported upward by buoyancy (A1) and dragged down (A2) by convection in the wedge. The fluid/melt phase rises through the mantle wedge (B) until it reaches the crust, where it is joined by fluids released from shallower reactions (D). The combined fluid/melt continues to rise until reaching a reservoir (C) in the crust. Mount Rainier is shown for both models as a red triangle. The two models share the same scale, with the coastline set at x=0 in the horizontal.
Funding Agencies
Partners/Collaborators
Research Papers