Model Description
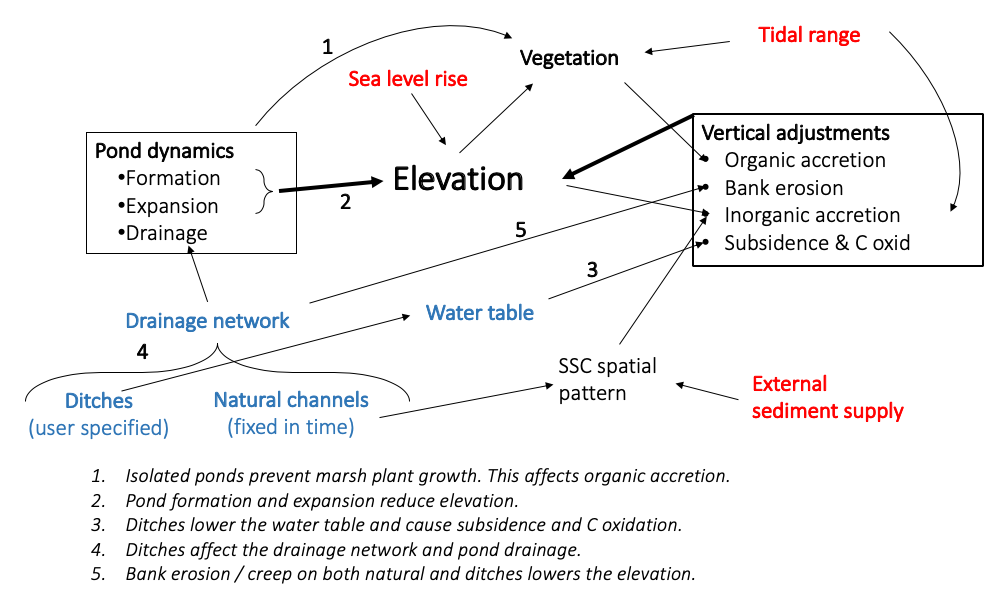
Model development is outlined in Geomorphology (Mariotti et al., 2020).
Modeled Inputs
- Channel network geometry: The model is run with the same channel network geometry and marsh domain for all simulations. The channel network was extracted from Great Barnstable Marsh, MA.
- Tidal range: Tidal range is constant through time in each model run. Great Barnstable Marsh, MA has a spring tide of 3.8 meters.
- Suspended sediment concentration (within the channel network): This parameter is constant through time in each model run. The model accounts for variations in suspended sediment concentration (SSC) away from the main channel network. Great Barnstable Marsh, MA, has an SSC of 30 mg/L.
- Sea-level rise: The relative sea-level rise (RSLR) history is 1 mm/year during the period of marsh formation (i.e. the past 1,000 to 100 years in the model) and 3 mm/yr for the past century for all model simulations. This creates a synthetic marsh at the present time, labeled as "Present Day (modeled)" within the "Time horizon" drop-down menu. The model then forecasts the marsh evolution under different scenarios of future RSLR rate.
- Ditches: Ditches that are regularly maintained need to be identified (and are handled by the model in a different way), and specified as the percentage (%) of ditches maintained
Modeled Outputs
- Elevation: meters relative to mean sea level
- Vertical accretion rates: millimeters per year
- Soil organic matter content and bulk density
Observed Elevation
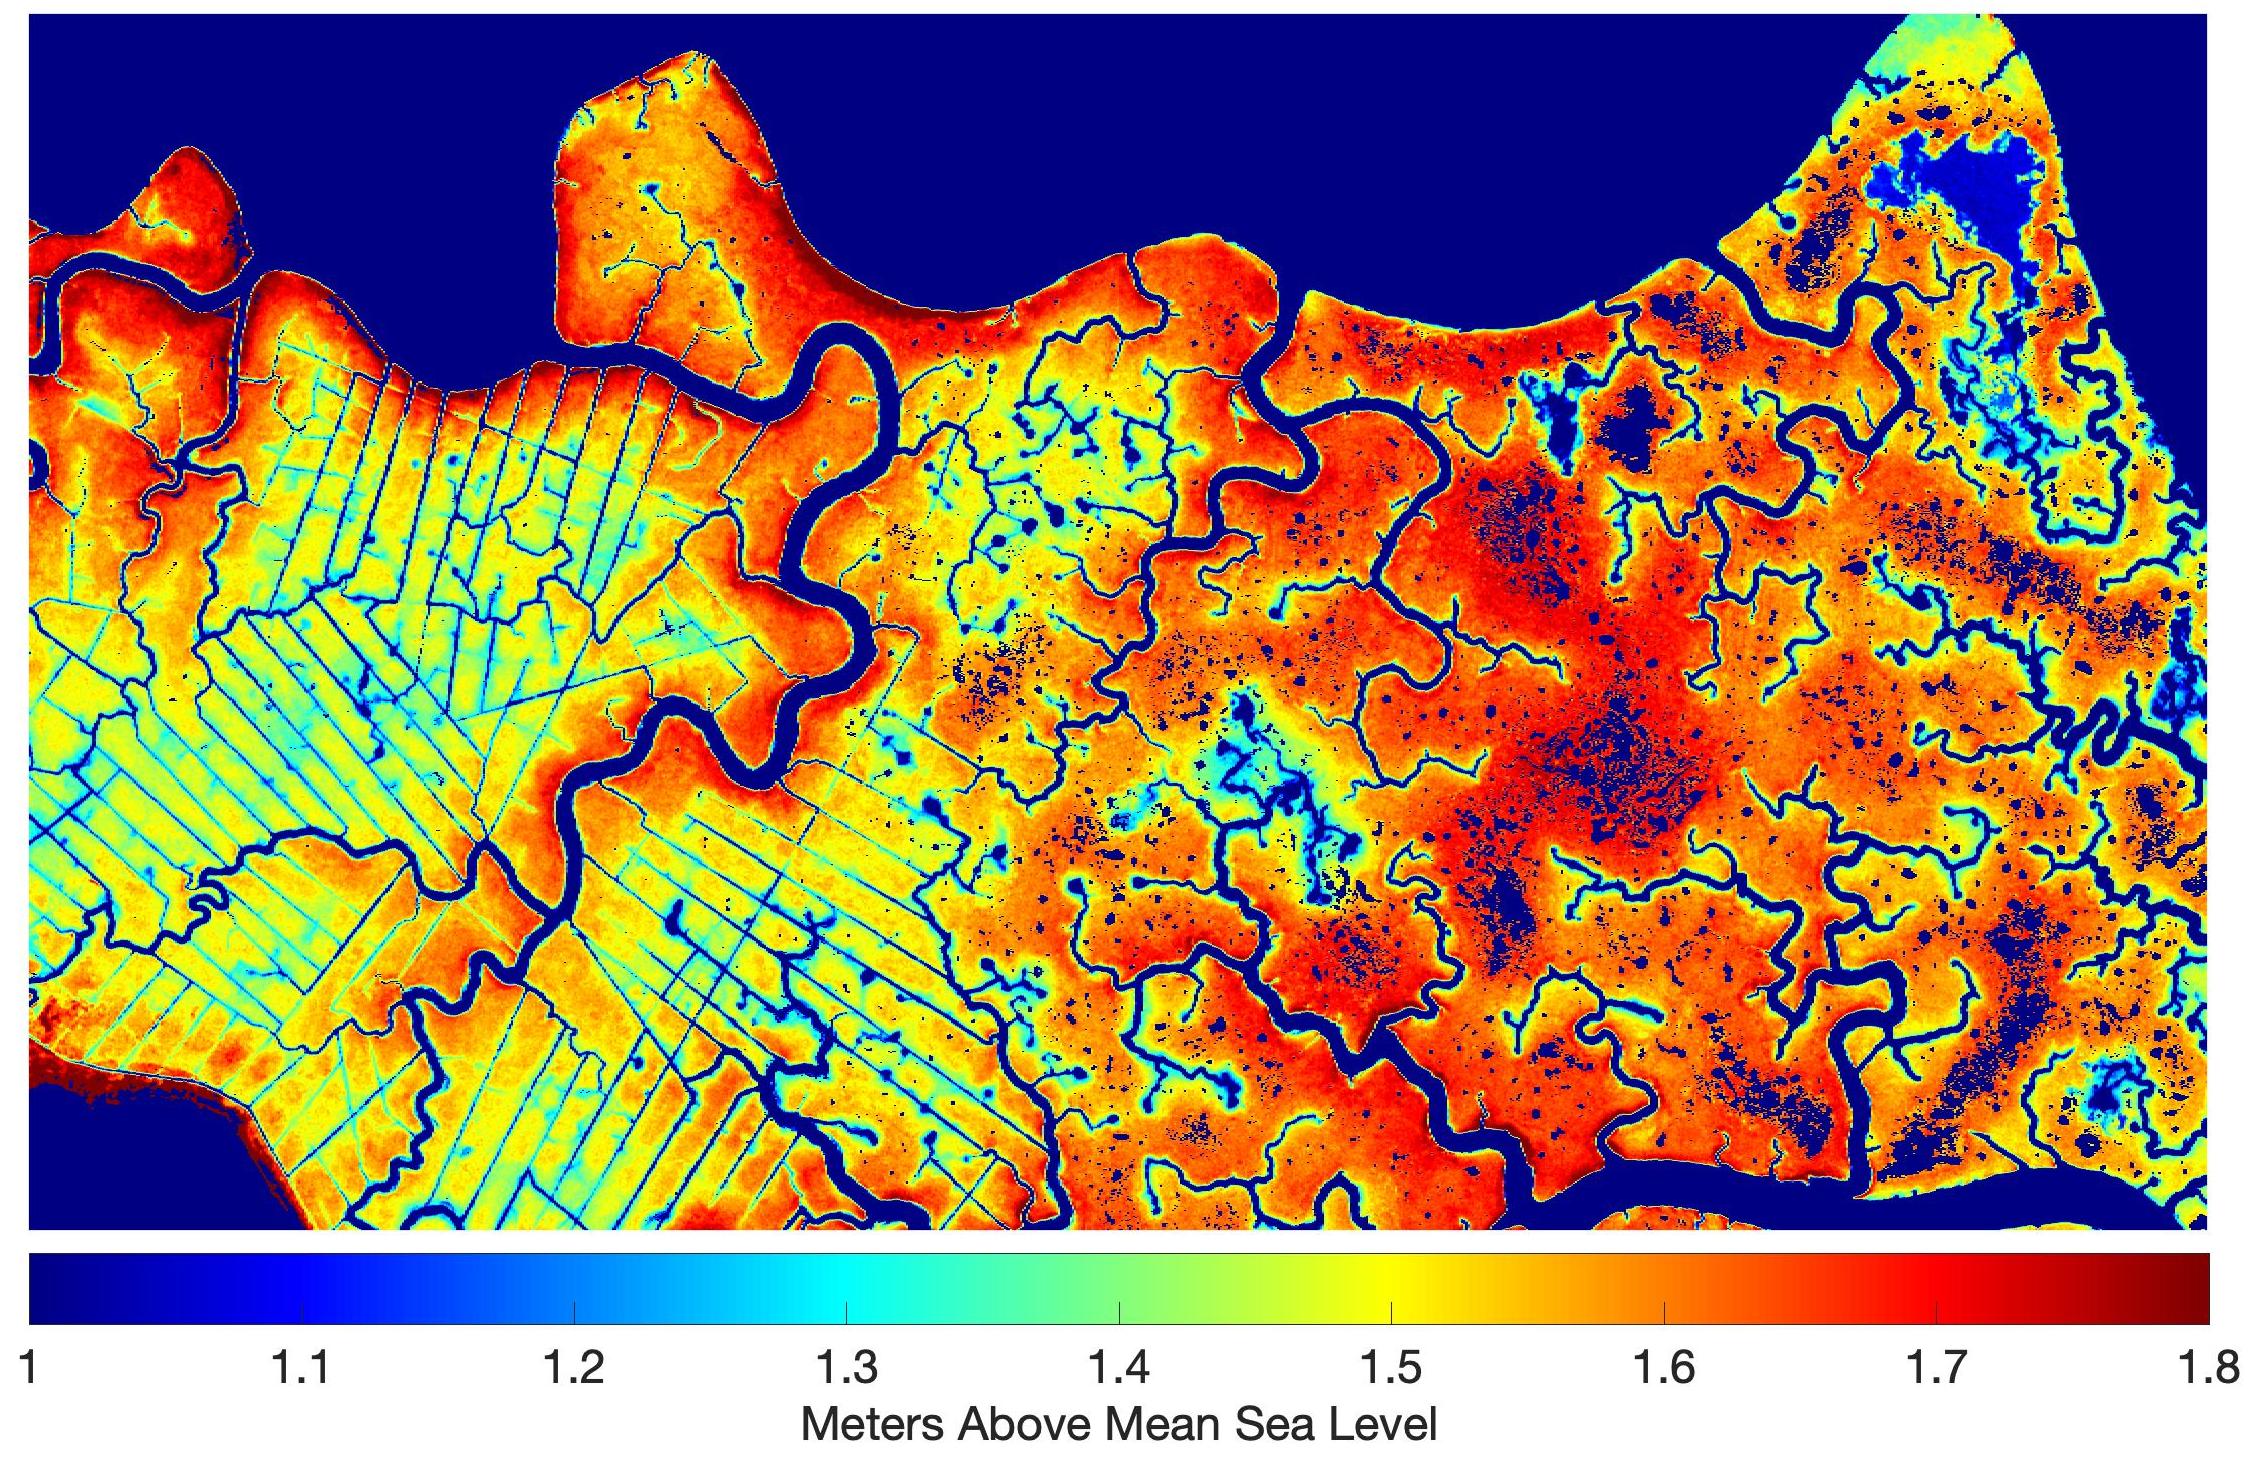
Modeled Present Day Elevation
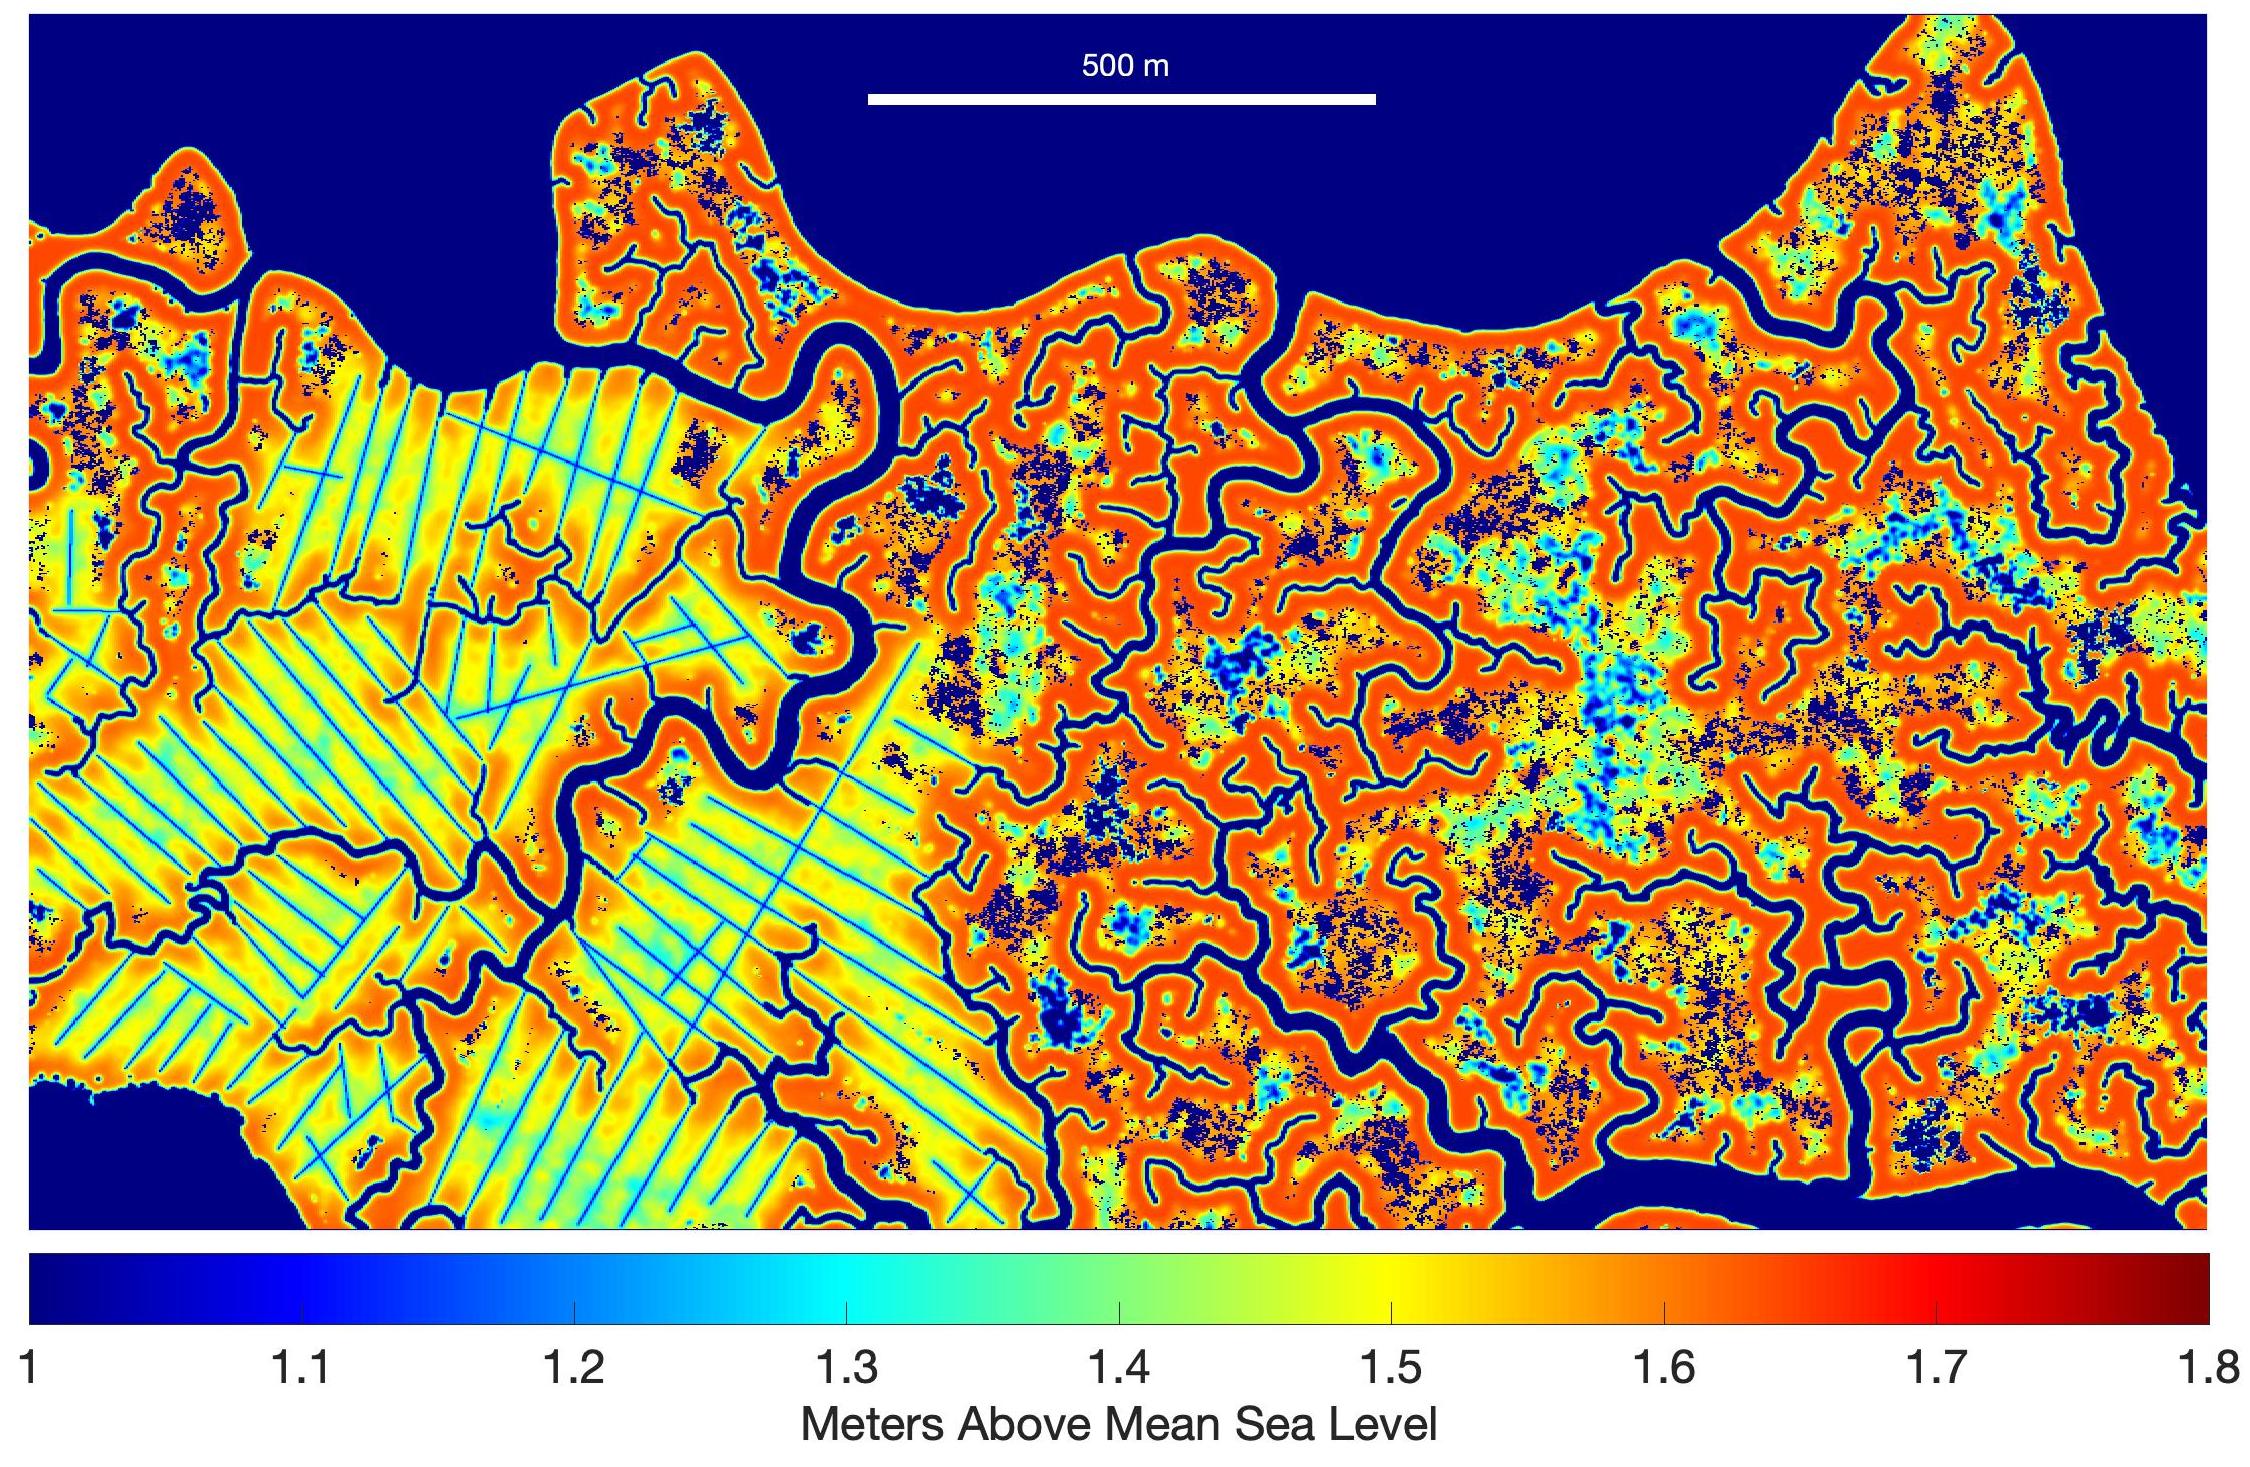
In order to validate the model, we set up simulations that aim to reproduce the present-day elevation (without using the present-day simulation to initialize the model). For simplicity, we assume that the RSLR rate has been equal to 1 mm/yr for the last few centuries, and that it increased to 3 mm/yr in 1910. The sediment supply is assumed to have remained unchanged during the whole marsh history (i.e., co=30 mg/l). Ditches are assumed to have been dug in 1930 and maintained at the same elevation since then.
The simulation is thus initialized 1000 years in the past with an arbitrary flat topography close to mean high water (MHW). The model is then run (including the increase in RSLR rate in 1910 and the digging of the ditches in 1930) until 2010. The comparison between the observed and modeled elevation at present time is shown above.
In the unditched area, the model captures the elevation of the vegetated marsh (at about 1.7 m above MSL), as well the size and the extension of the ponds. Clearly, the location of the ponds is different, because ponds are a stochastic process and cannot be predicted deterministically. In the ditched area, the model captures the absence of ponds, as well as the lower elevation. Noticeably, the model captures the spatial variability of elevation within the ditches area (e.g., changing from 1.3 to 1.5 m above MSL). This heterogeneity is associated with the presence of the ponds that were drained when ditches were dug and that are not fully recovered by present time.
The model used to produce the results in this website is available on the Community Surface Dynamics Modeling System repository: https://csdms.colorado.edu/wiki/Model:MarshPondModel
doi: 10.5281/zenodo.4085606
Bulk Soil Field Results
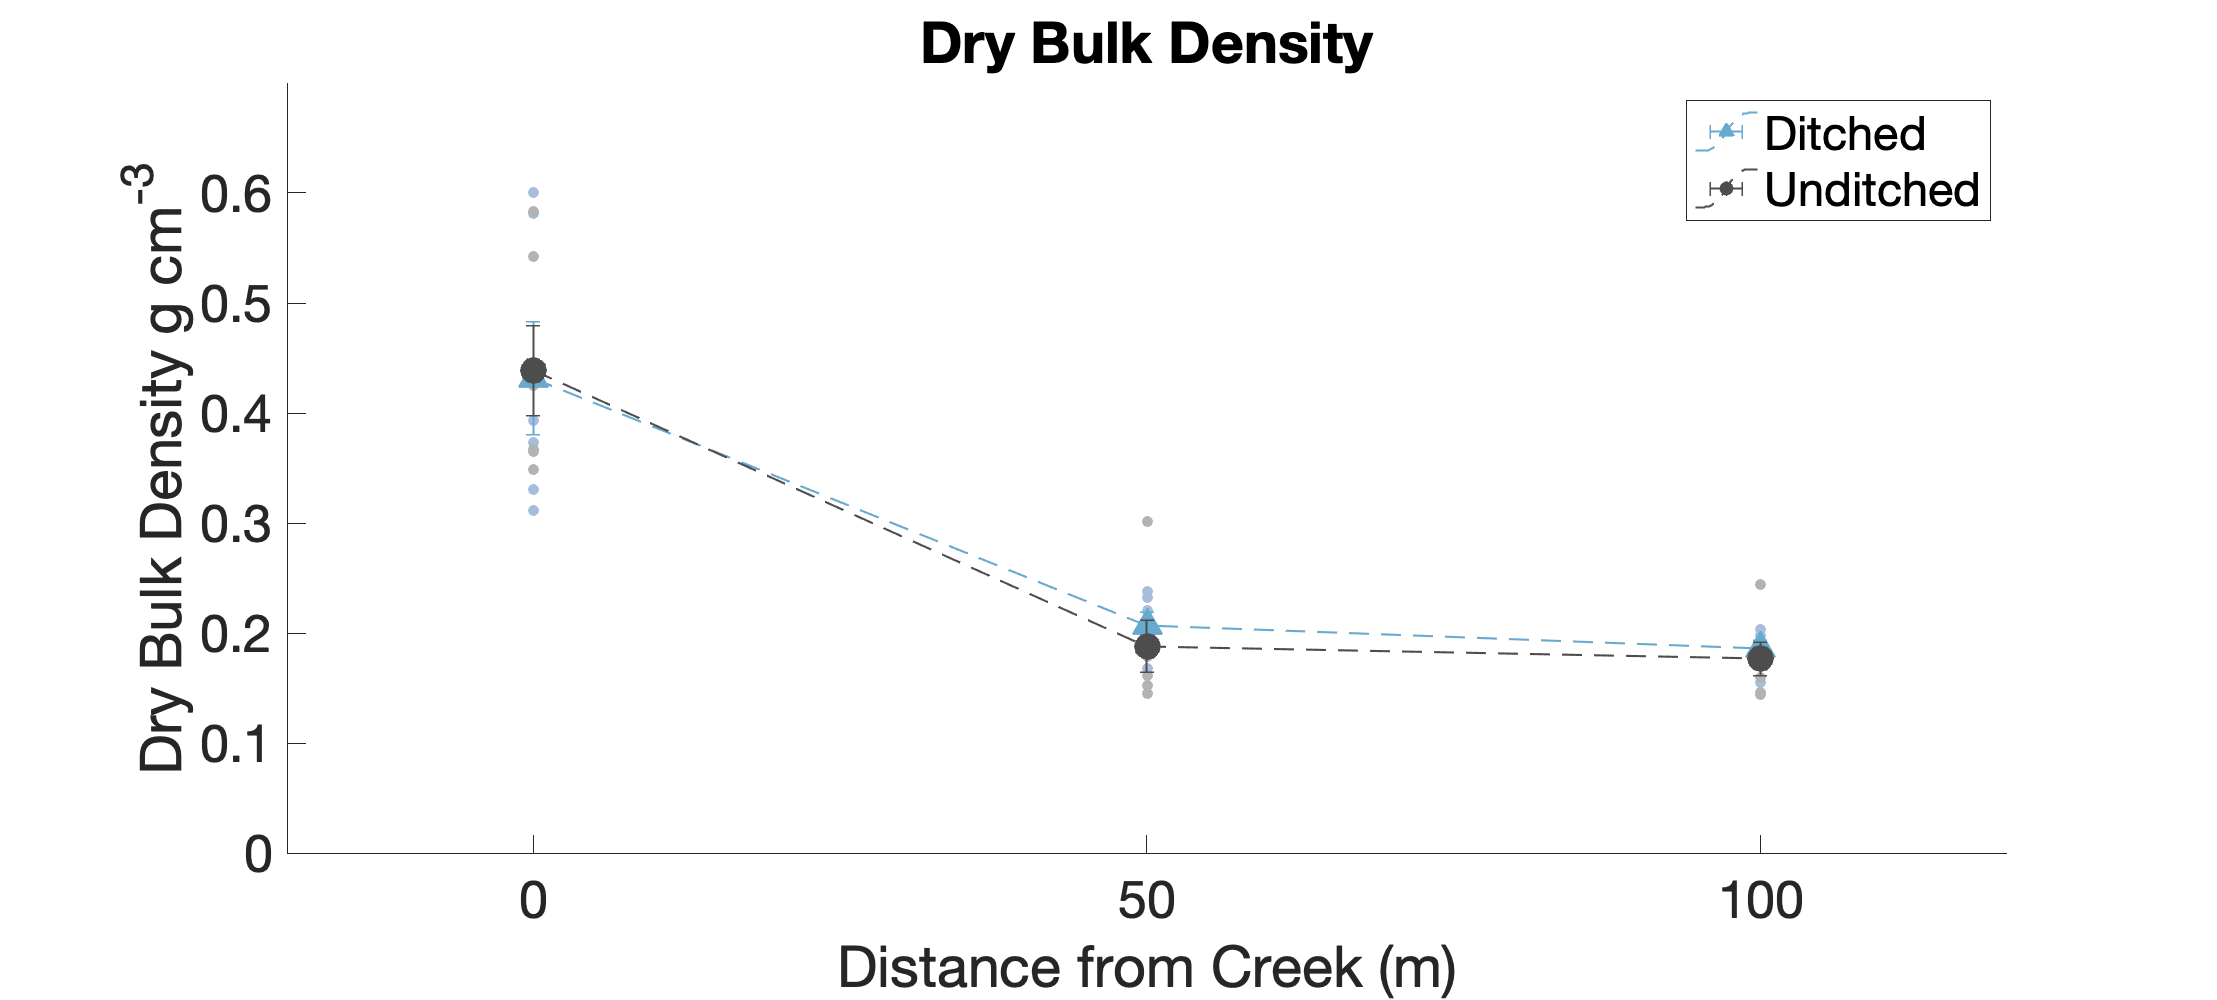
Fig 1a. Measured dry bulk density values (g cm-3) for the ditched and unditched marsh at varying distances from the tidal creek for Great Barnstable Marsh, MA.
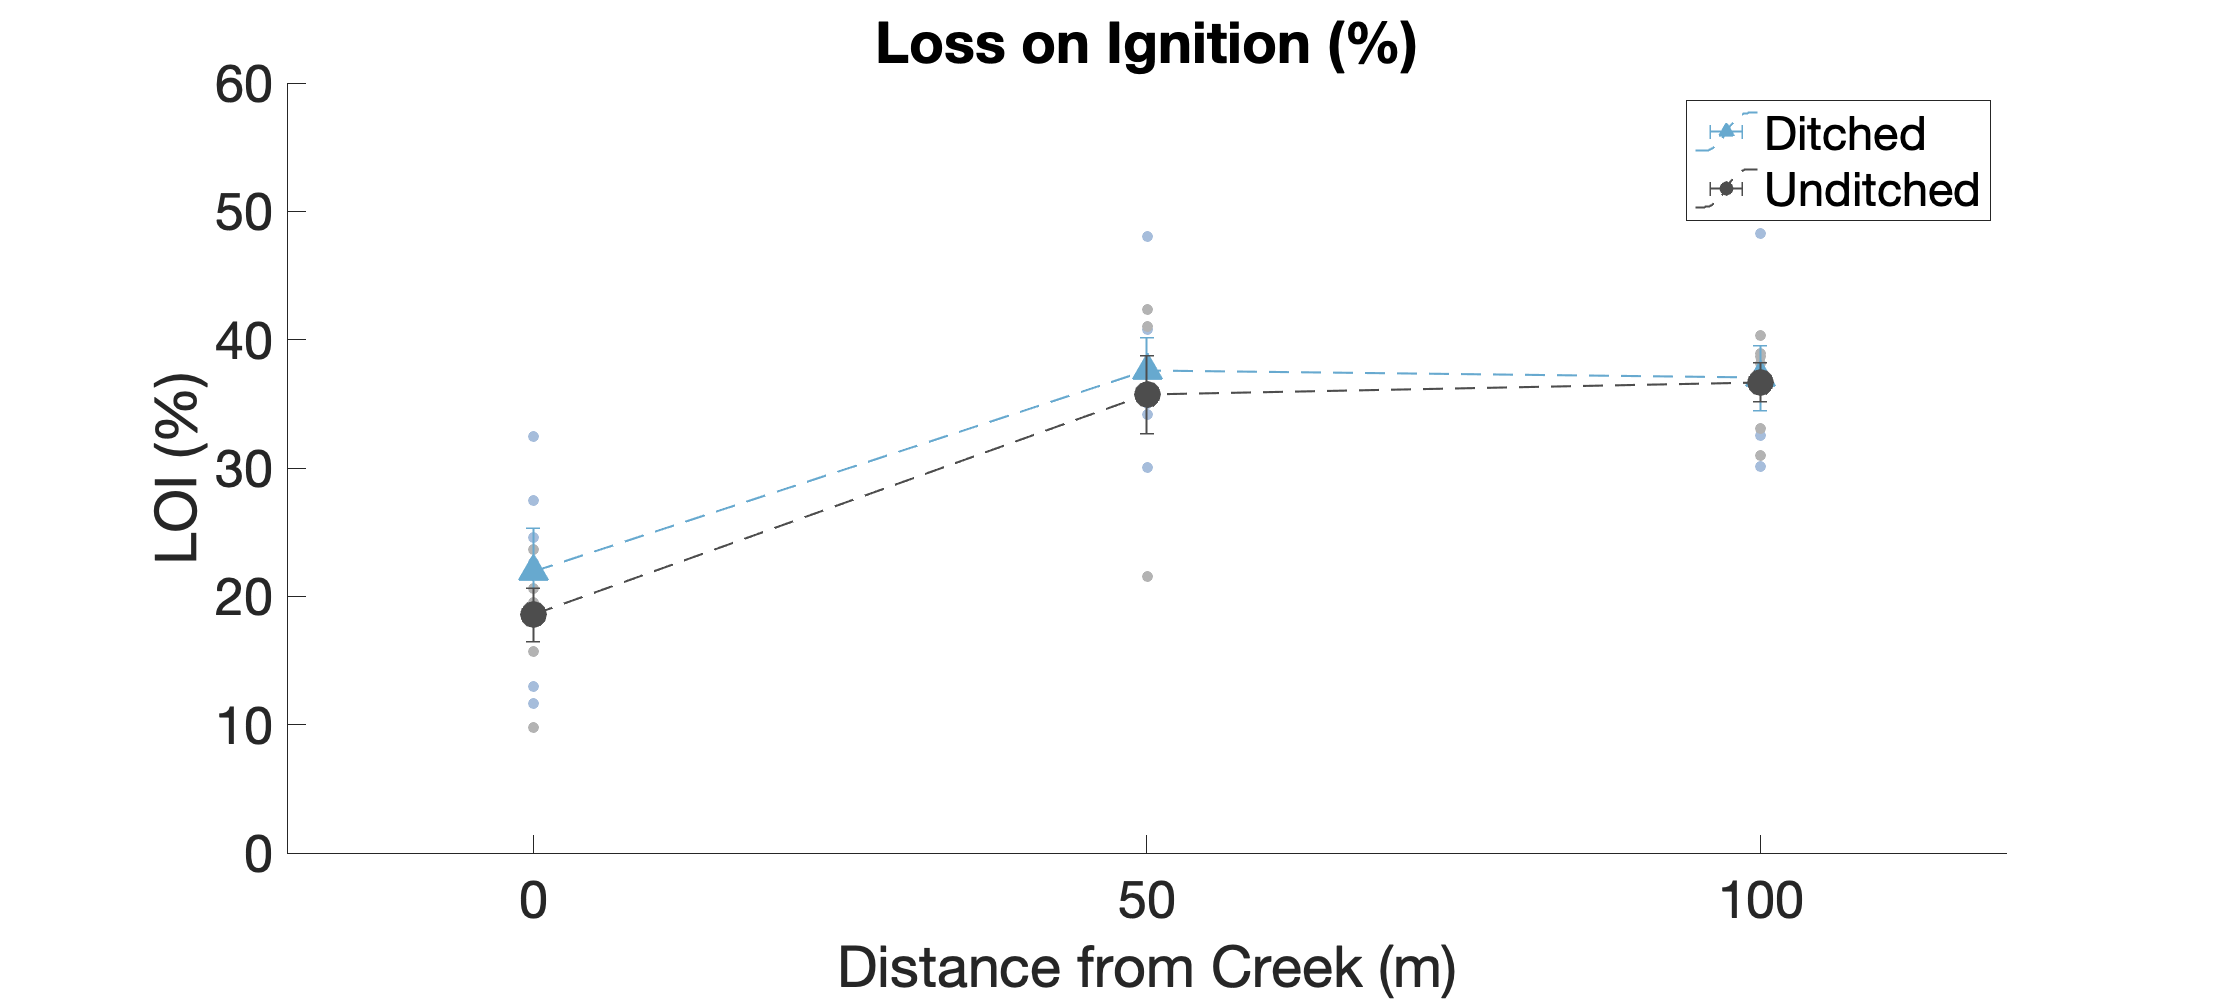
Fig 2a. Measured loss on ignition (LOI) for the ditched and unditched marsh at varying distances from the tidal creek for Great Barnstable Marsh, MA.
Modeled Bulk Soil Parameters
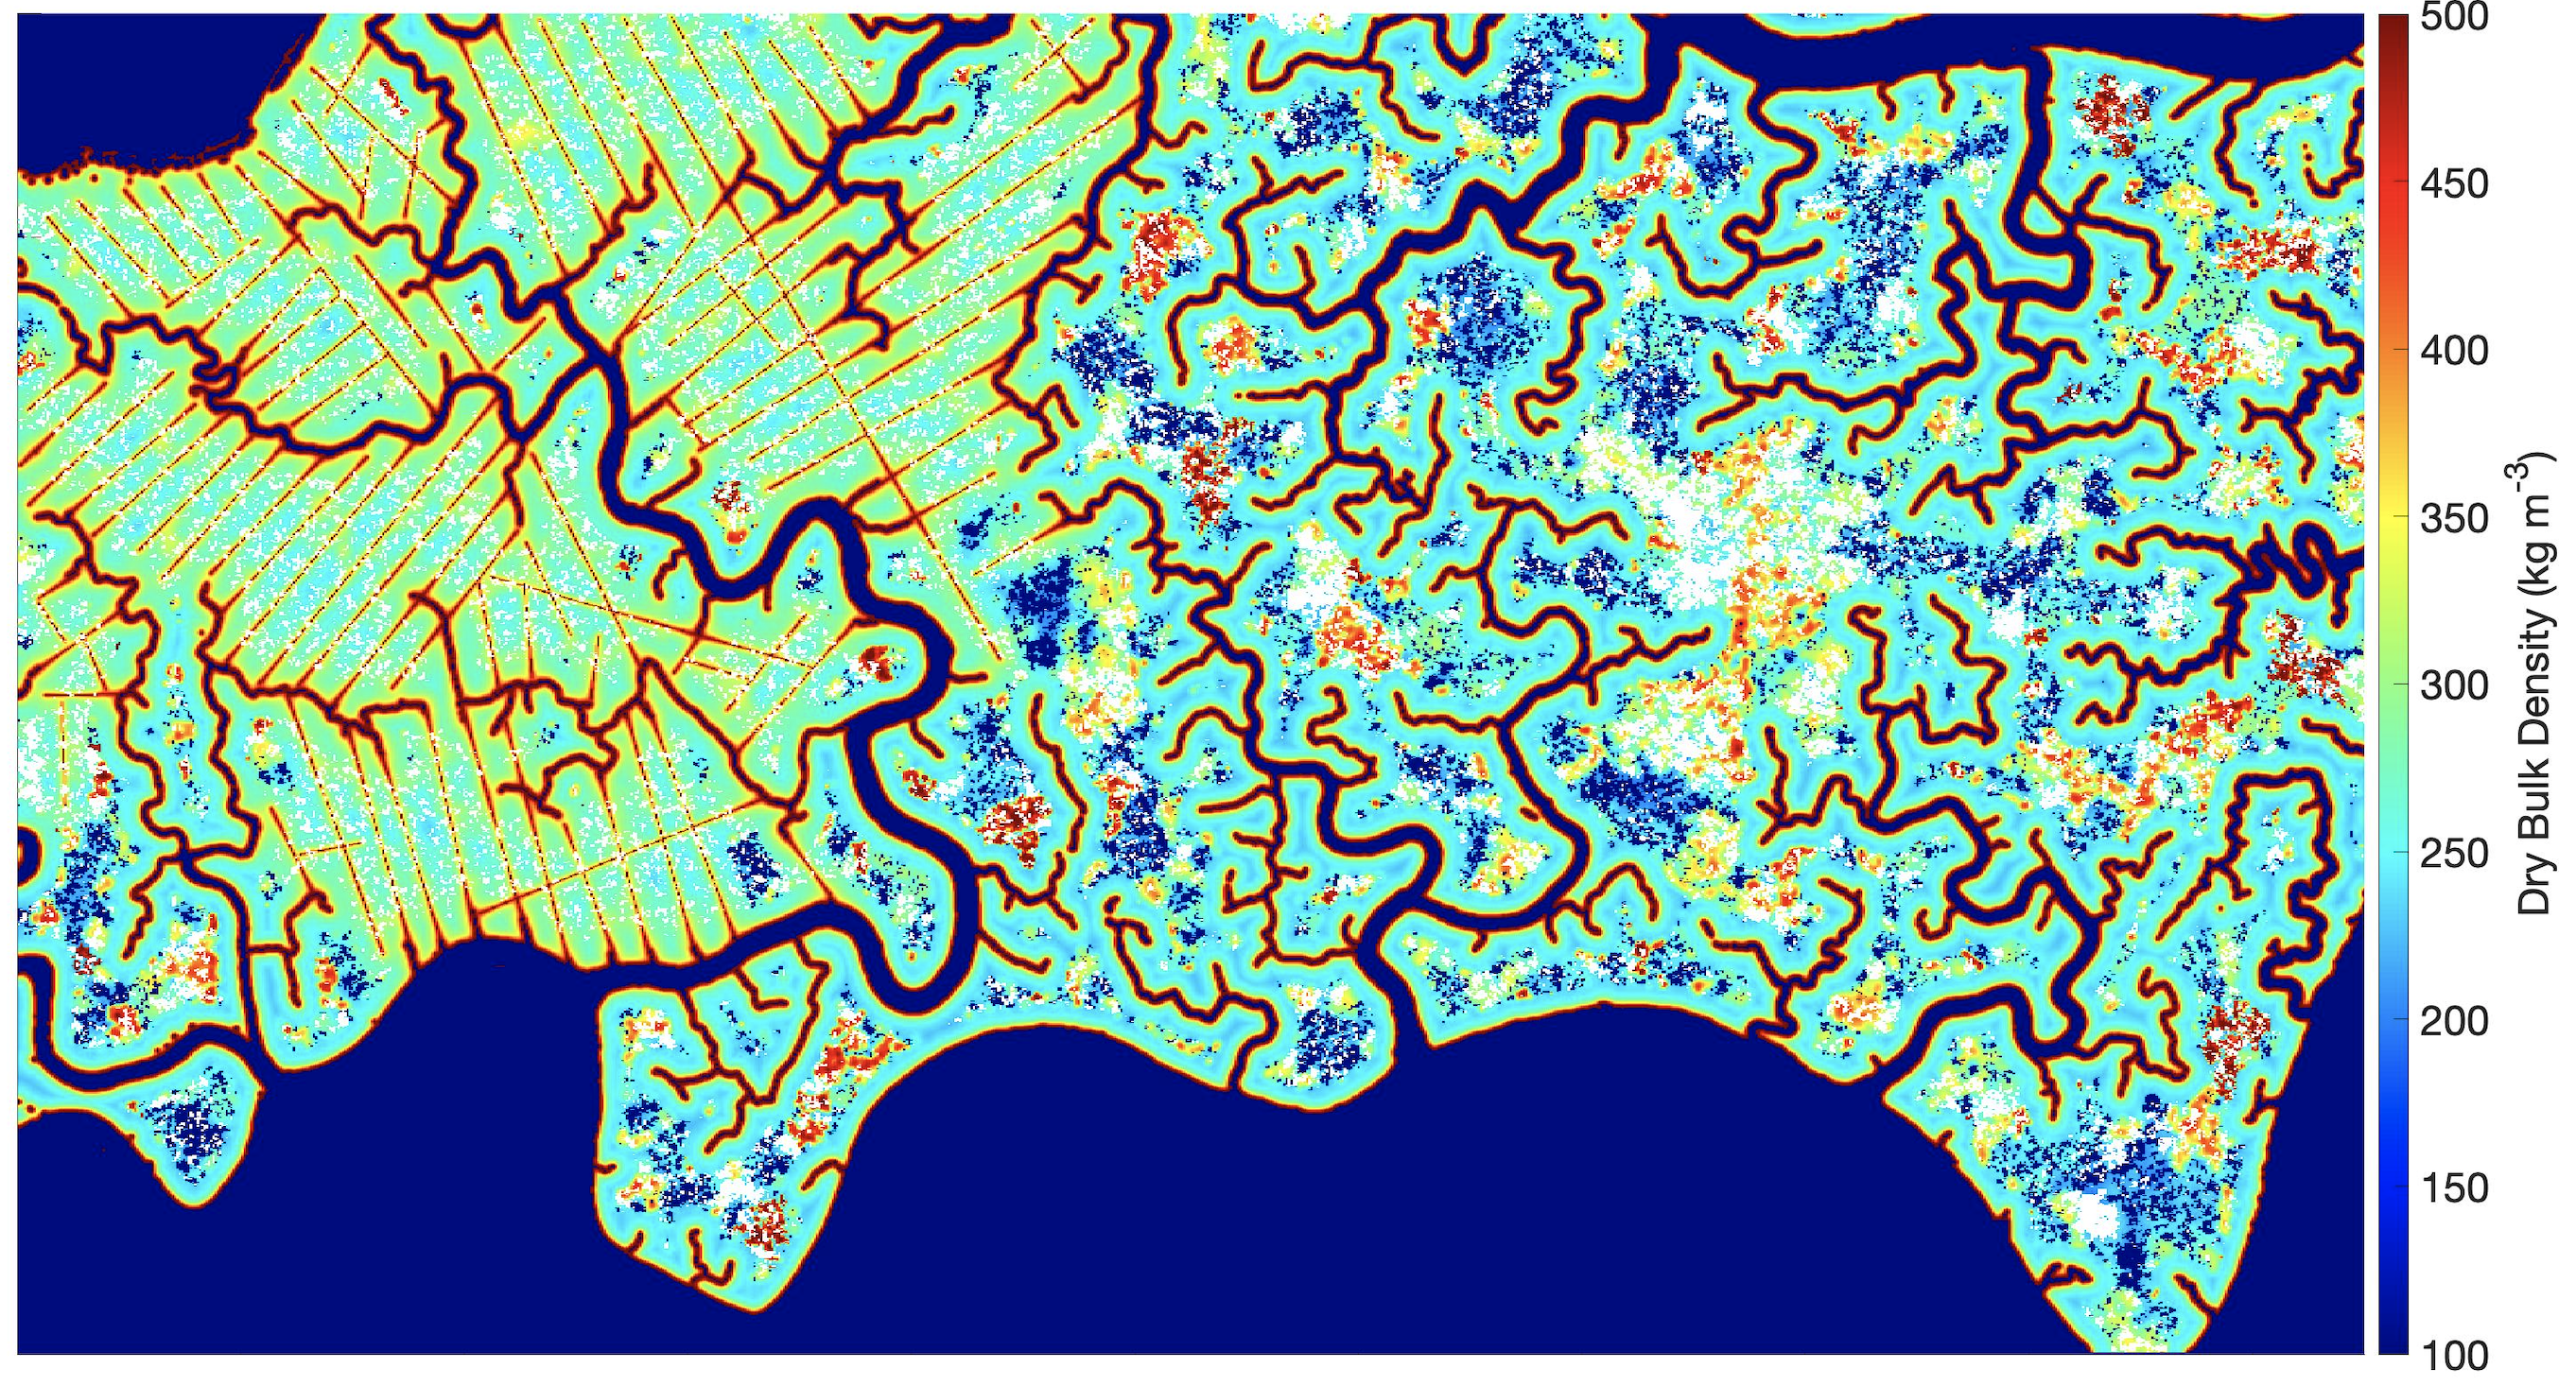
Fig 1b. Modeled dry bulk density values (kg m-3) for Great Barnstable Marsh, MA.
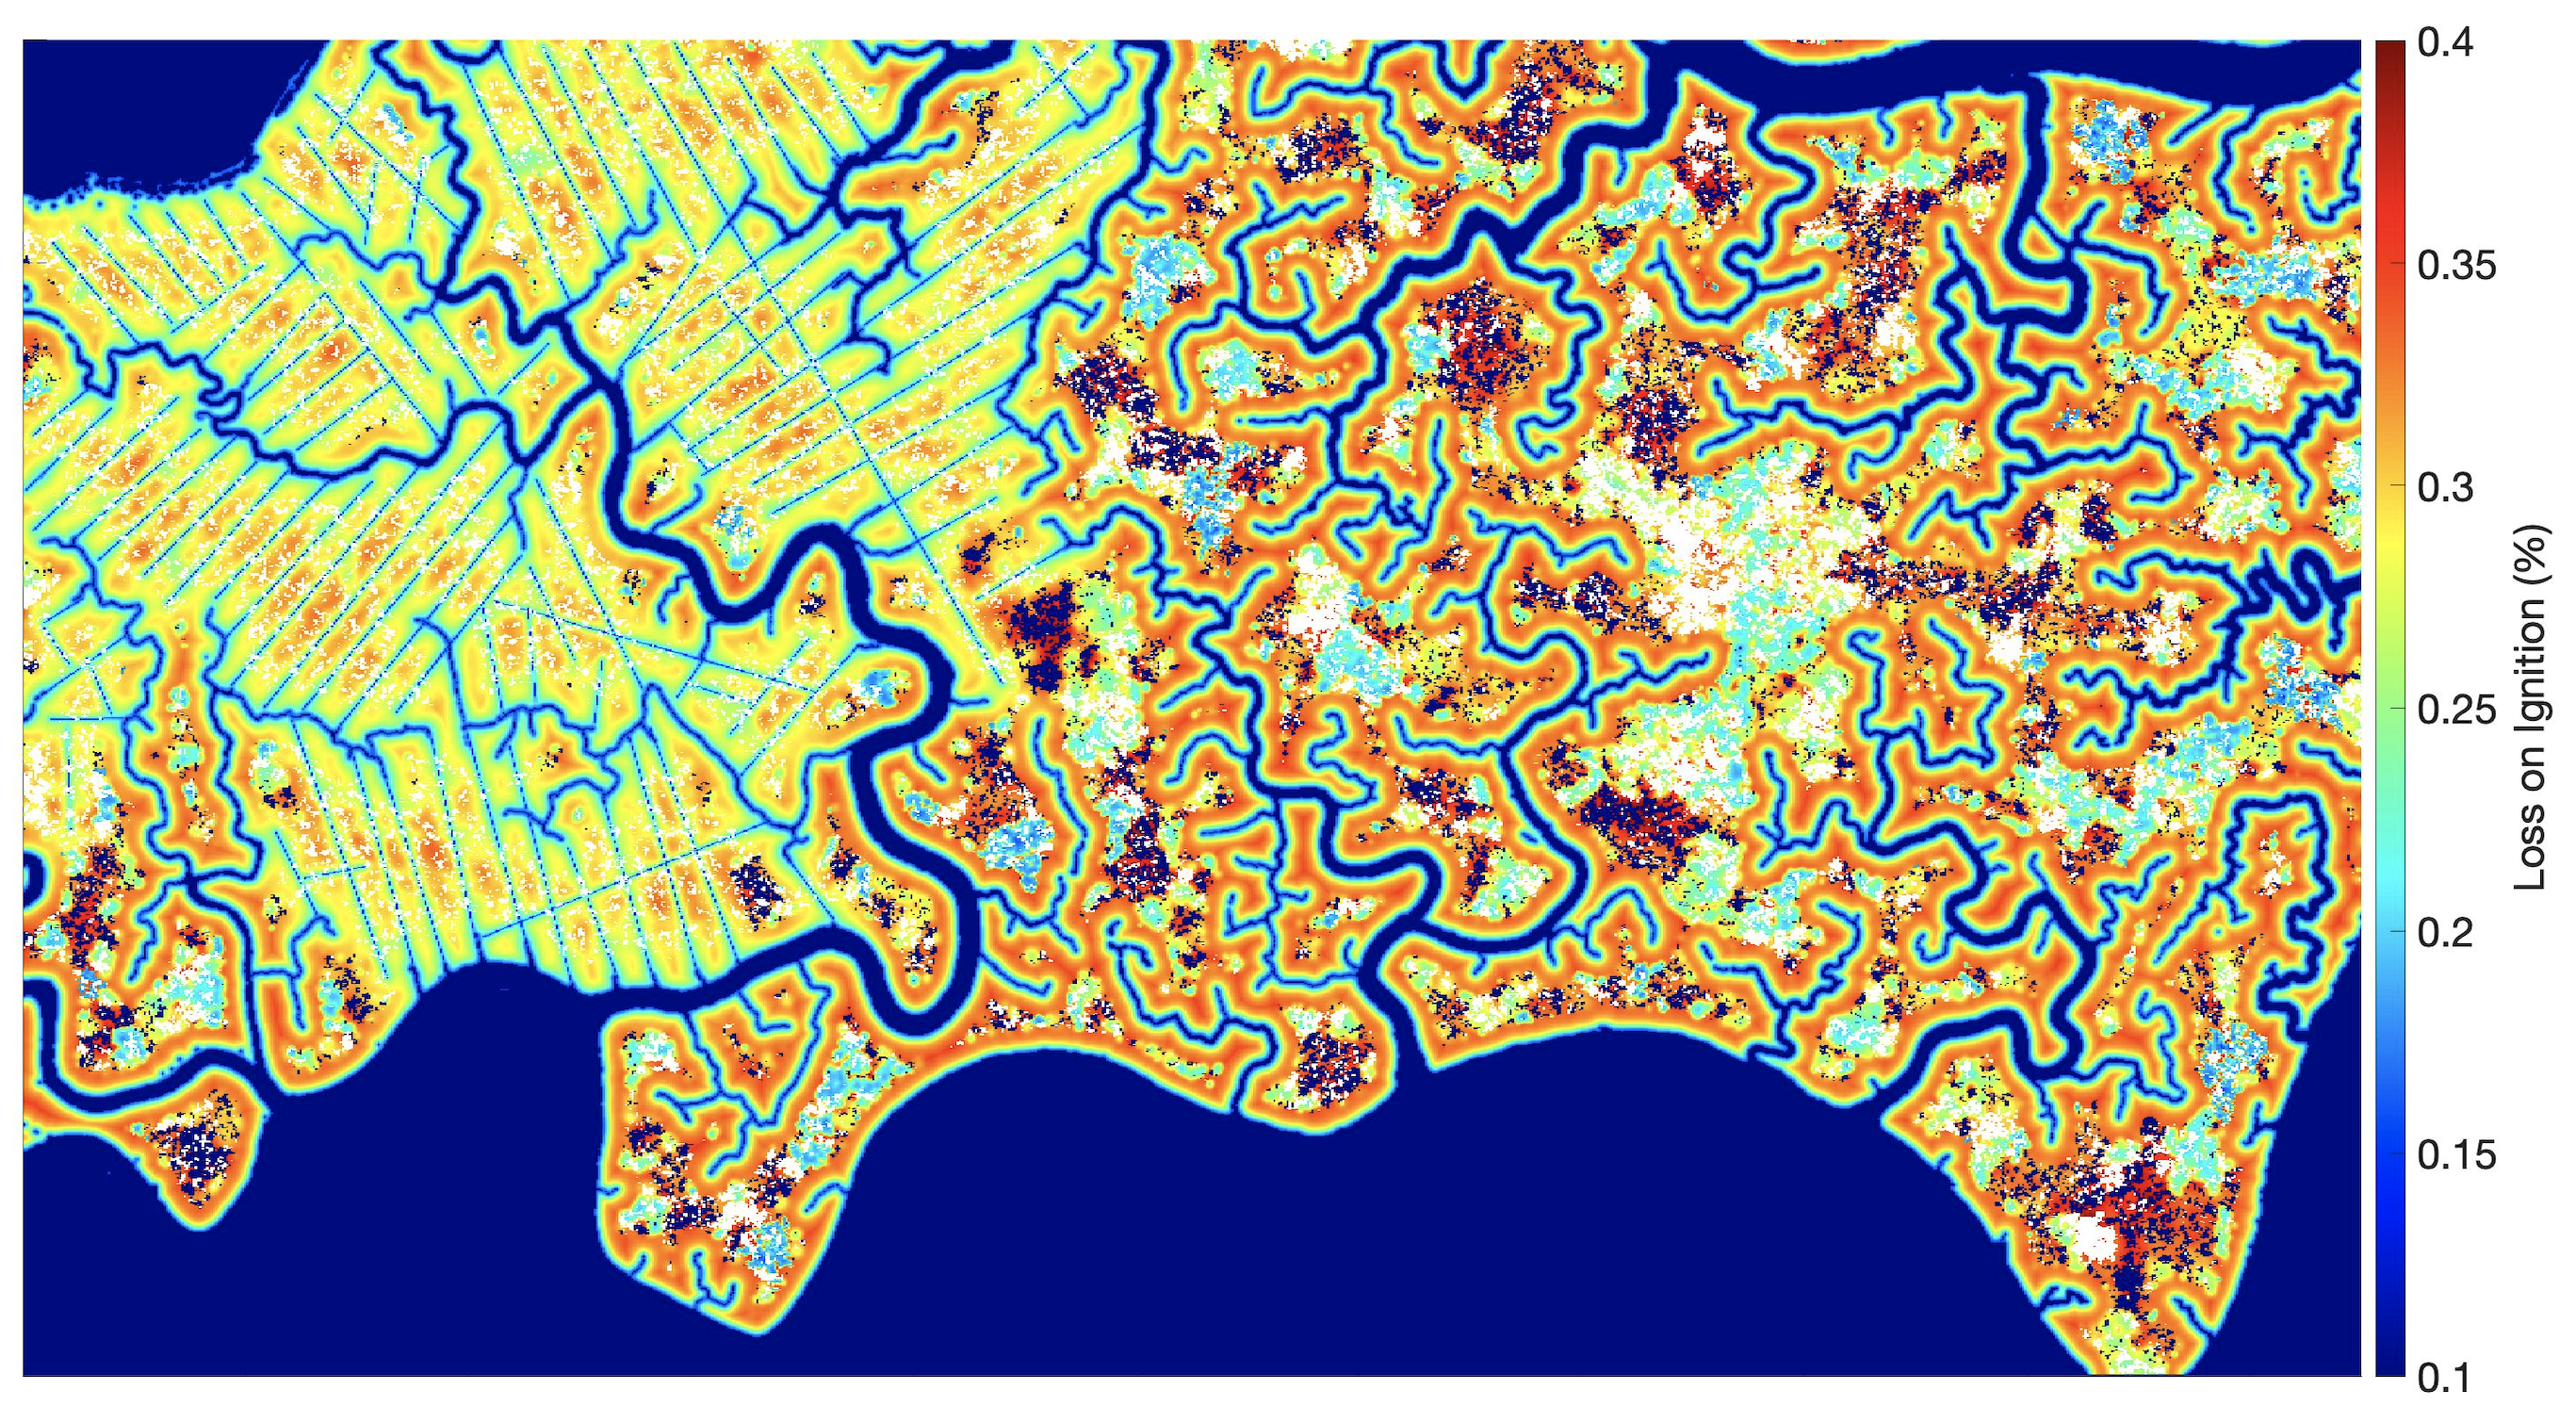
Fig 2b. Modeled loss on ignition (LOI) for the ditched and unditched marsh at varying distances from the tidal creek for Great Barnstable Marsh, MA.
Table 1. Comparison of measured and modeled bulk soil properties for Great Barnstable Marsh, MA.

