Hydrographic section data with chemical observations (1995 and repeats)
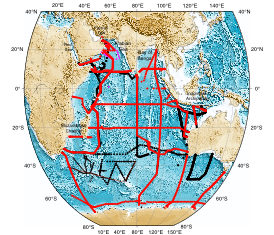
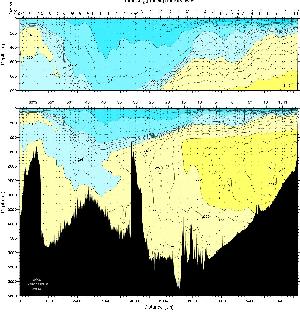
The principal hydrographic data set (Fig. 2.1) is the 1995 Indian Ocean survey (WOCE), composed of multiple zonal and meridional sections (Ffield, 1997), most with full suites of chemical measurements (Table 2.1), including carbon observations (red in Fig. 2.1). Full chemistry includes: temperature, salinity, oxygen, nutrients, chlorofluorocarbons, 3He, tritium, D14C, total inorganic carbon (TIC), and alkalinity. An overview of what is available for each primary WOCE section in Fig. 2.1 is found in the WOCE Indian Ocean Atlas (http://www-pord.ucsd.edu/whp_atlas/indian_index.html) (Talley, 2009), for example Figure 2.2.
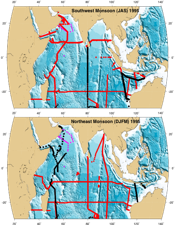
Additional data sets include repeat hydrographic sections within the same 1995 time frame and monthly hydrography with carbon in the Arabian Sea (JGOFS) (magenta in Figure 2.1). Due to the strong monsoonal variability, we will not treat the northern Indian Ocean as a steady state for which we can use all WOCE sections. Instead the SW and NE monsoon periods will be separated as in Fig. 2.1 (right column), using the repeat hydrography. And, importantly, we will use output from the POP and ECCO models to look at monsoonal response since the single repeats cannot provide true seasonal sampling.
We will also analyze repeats of the 32°S section, which bounds the Indian Ocean and is the canonical section for calculating the Indian Ocean’s role in global overturn (e.g. Figs. 1.1). A complete section, with partial chemistry, was performed in 1987, followed by an incomplete section with full chemistry in WOCE, a complete section with full chemistry in 2002 (U.K.), and a new section will begin in March 2009 with full chemistry (U.S.).
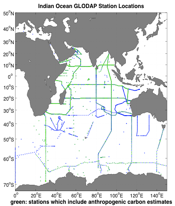
The primary seasonal synthesis will be for the SW monsoon period observations which bracket the western boundary and Arabian Sea with the full suite of chemistry, and include all major sections south of 15°S. Most sections in this realization, except for the 1987 32°S transect and the repeated 80°E section, include carbon (red in Fig. 2.1). The data sets with chemistry have already been merged and carefully quality controlled for the WOCE Indian Ocean Atlas (see prior NSF support) and GLODAP (Figure 2.3); repeat data sets have also been merged and subjected to quality control by WHPO (now CCHDO), CDIAC, and US JGOFS. Most "1-time" survey data were collected on multiple legs from the R/V Knorr, and were either collected by the same group or intercalibrated. In 1995, coordinating with the 1-time survey, NOAA repeated several sections in the opposite monsoonal season. German and British data in the same time frame are also included in our proposed effort. We will use the GLODAP anthropogenic carbon (Cant) estimates (Key et al., 2004) provided for most of these lines.
To compute geostrophic velocity from hydrography initial reference velocities are required for each station pair. Our first estimate will be the reference velocity field constructed by Reid (2003) for the 1995 WOCE survey. These data have been quality controlled, station pairs at intersections have already been chosen for determining dynamic heights, and an initial estimate of a bottom reference velocity is provided for every station pair. These data were used to examine structure in global meridional overturn (Talley et al., 2003), and to study details of the meridional heat and freshwater transports (Talley, 2003, 2008). Our other principal choice will be the ADCP (shipboard and lowered) velocities collected at the same time as the station data on at least all of the cruises with chemical tracers. We will also consider constraining the velocities with the mean subsurface float streamfunction from Davis (2005) (Figure 3.1 in section 3.2).
Table 2.1
Properties available through GLODAP
Property | # Bottles | % Bottles | #Stations | %Stations |
|---|---|---|---|---|
Temperature | 70012 | 100 | 2439 | 100 |
Salinity | 68552 | 97 | 2427 | 99 |
Oxygen | 68868 | 98 | 2423 | 99 |
Nitrate | 67549 | 96 | 2364 | 97 |
Nitrite | 47148 | 67 | 1580 | 65 |
Phosphate | 67405 | 96 | 2338 | 96 |
Silicate | 67744 | 96 | 2364 | 97 |
TIC | 33285 | 47 | 1657 | 68 |
TALK | 29279 | 42 | 1576 | 65 |
CFC11 | 31573 | 45 | 1743 | 71 |
CFC12 | 30858 | 44 | 1668 | 68 |
Cant | 19359 | 28 | 1179 | 48 |


