Project #1: Changes in Arctic sea ice and their impact on timing of life history and production of zooplankton
Plain Language Summary
The boundaries of species distributions in the Arctic Ocean are sensitive to climate change. This has been demonstrated through this modeling study on an important zooplankton species, Calanus glacialis, a key component of the Arctic marine food webs. Our numerical experiments suggested that the species showed a poleward boundary shift over the period from 1980 to 2014 in response to sea ice loss, upper ocean warming, and enhanced primary production. The mechanistic understanding gained from this study could be applicable to other marine organisms exposed to strong seasonality and drastic environment changes in the Arctic Ocean, and thus allowing a better prediction of future ecosystem changes.
Model species: Calanus glacialis
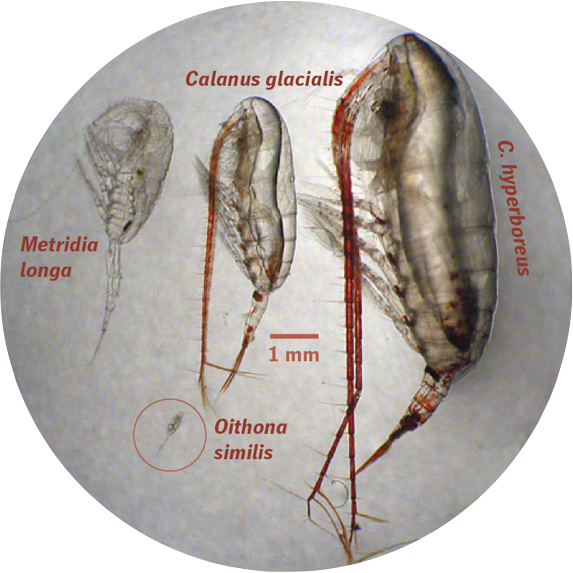
The copepod Calanus glacialis is a critical endemic species in the Arctic shelf/slope seas and plays fundamental roles in the marine food web (Photo credit: Carin Ashjian).
C. glacialis Life Cycle
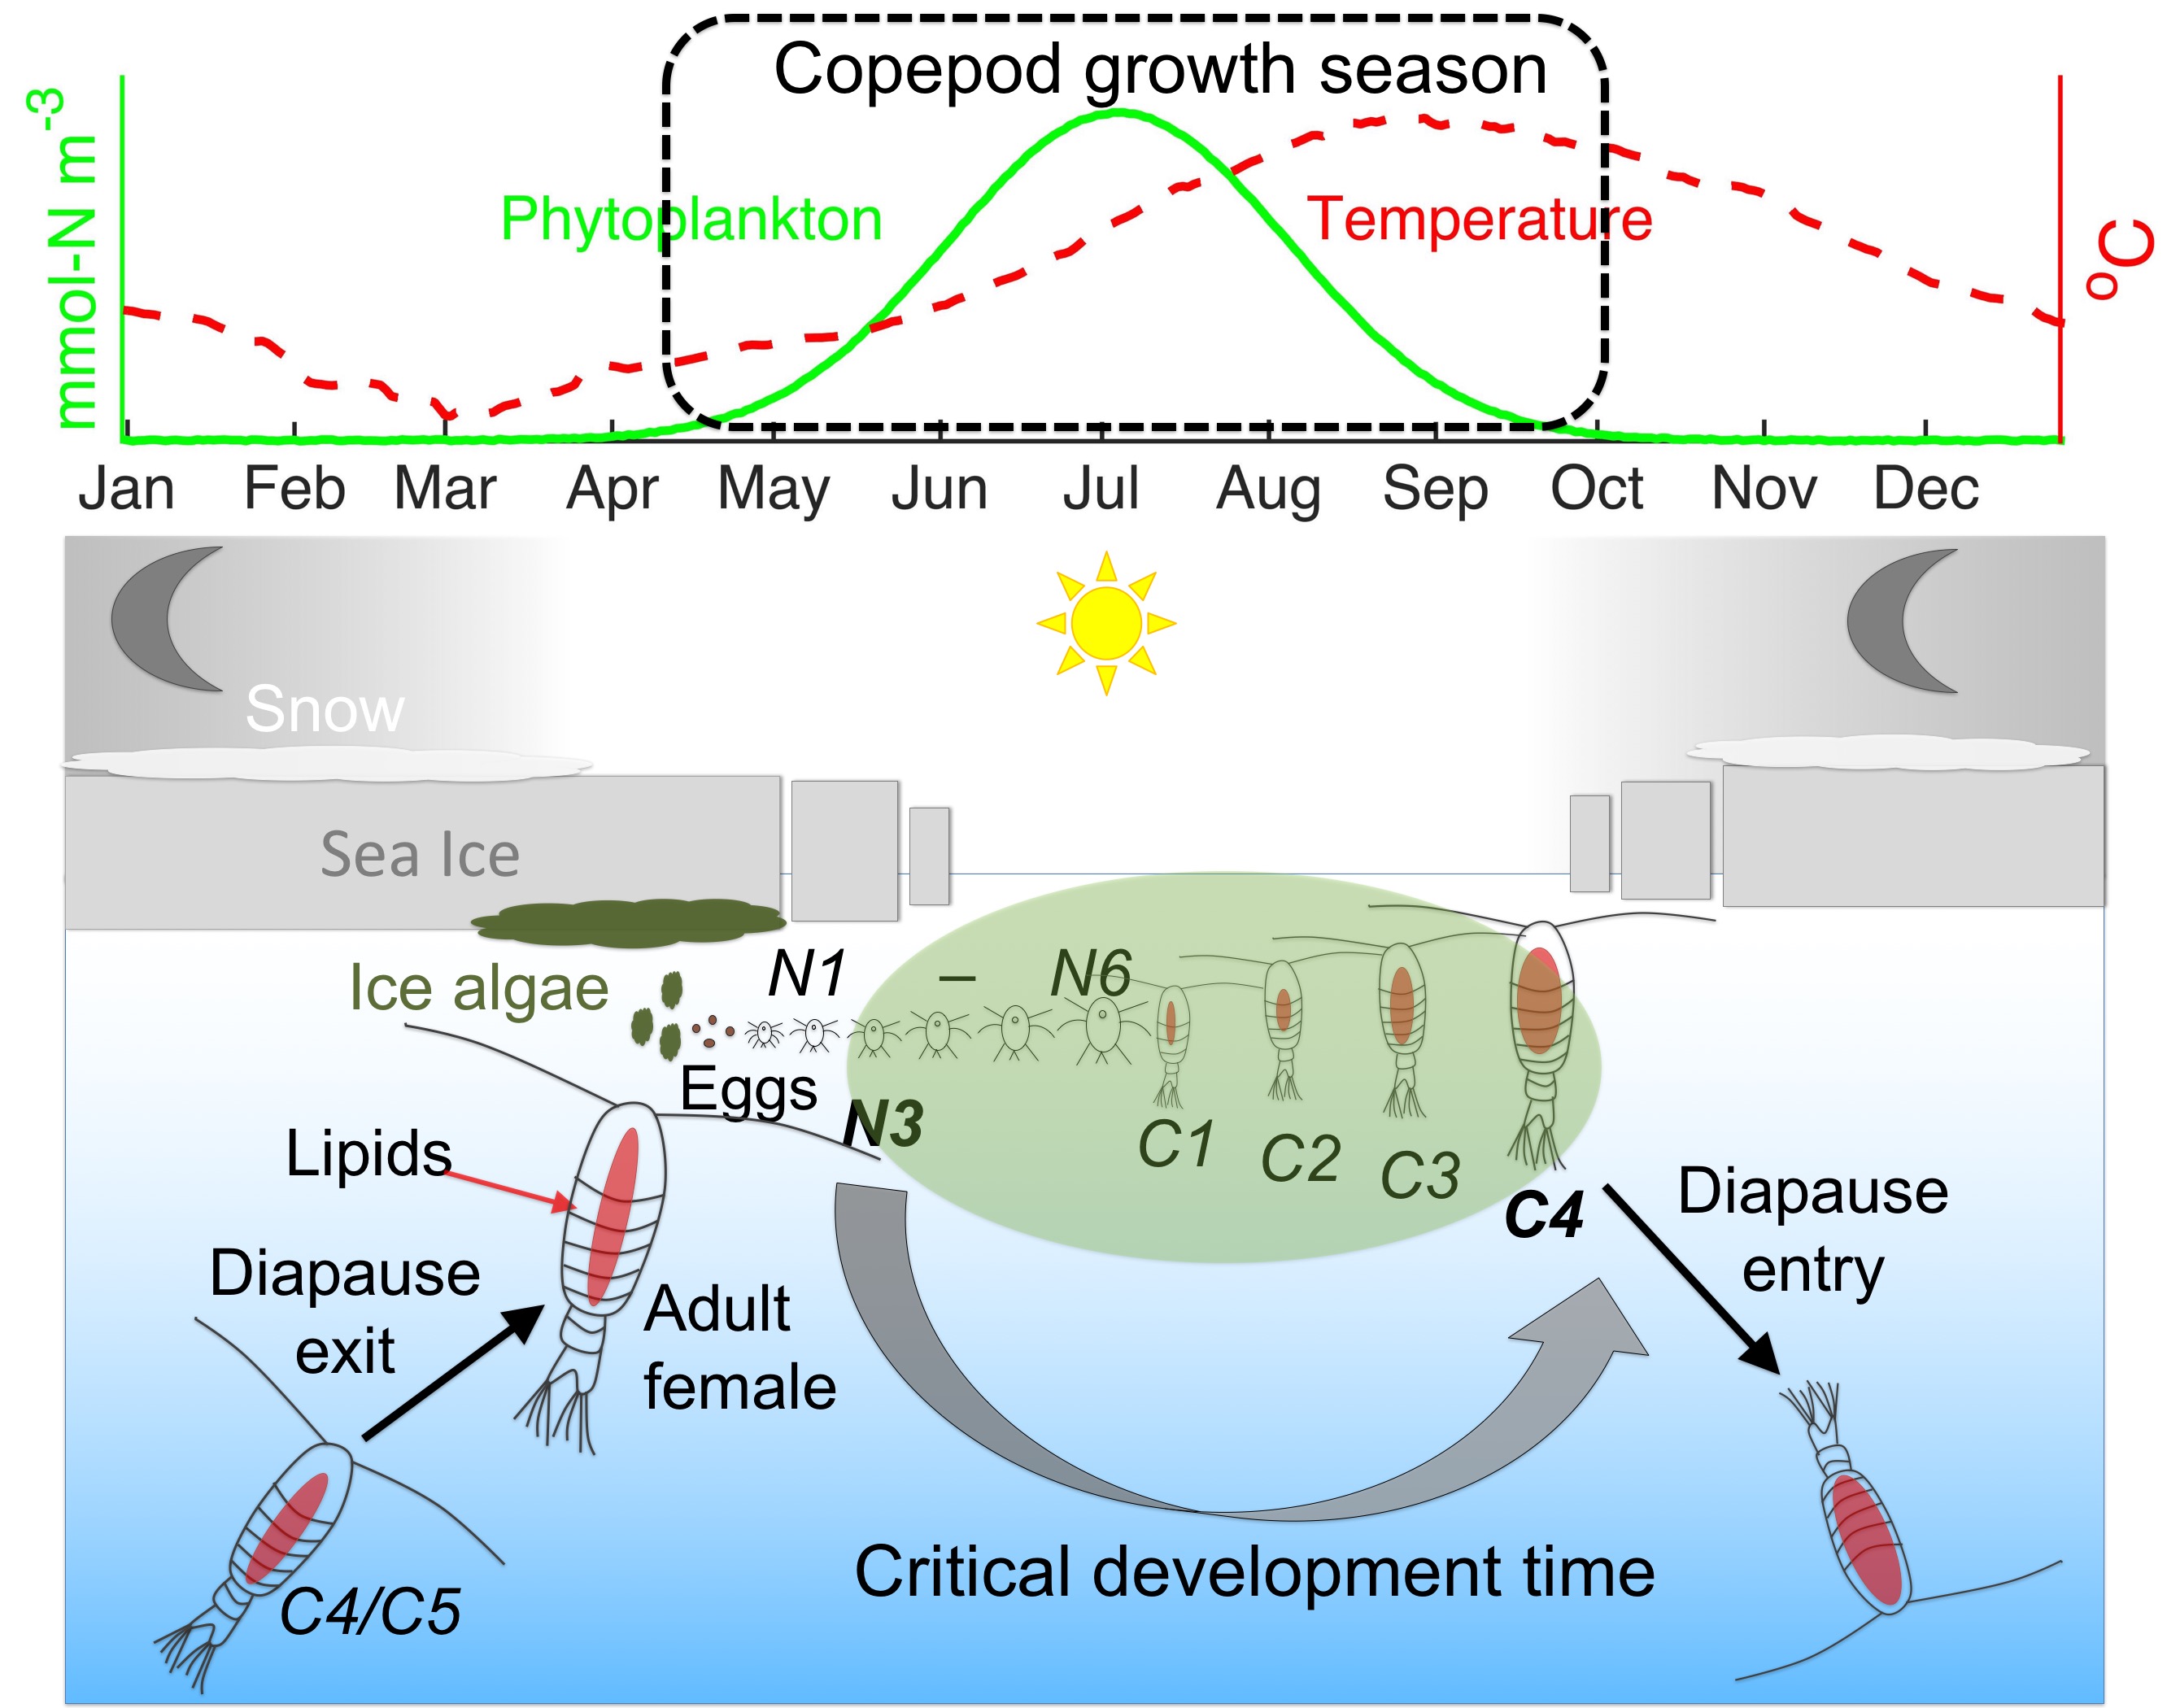
Annual life cycle of the copepod C. glacialis in the Arctic/subarctic environment (Feng et al. 2018).
Individual-based model: ArcIBM
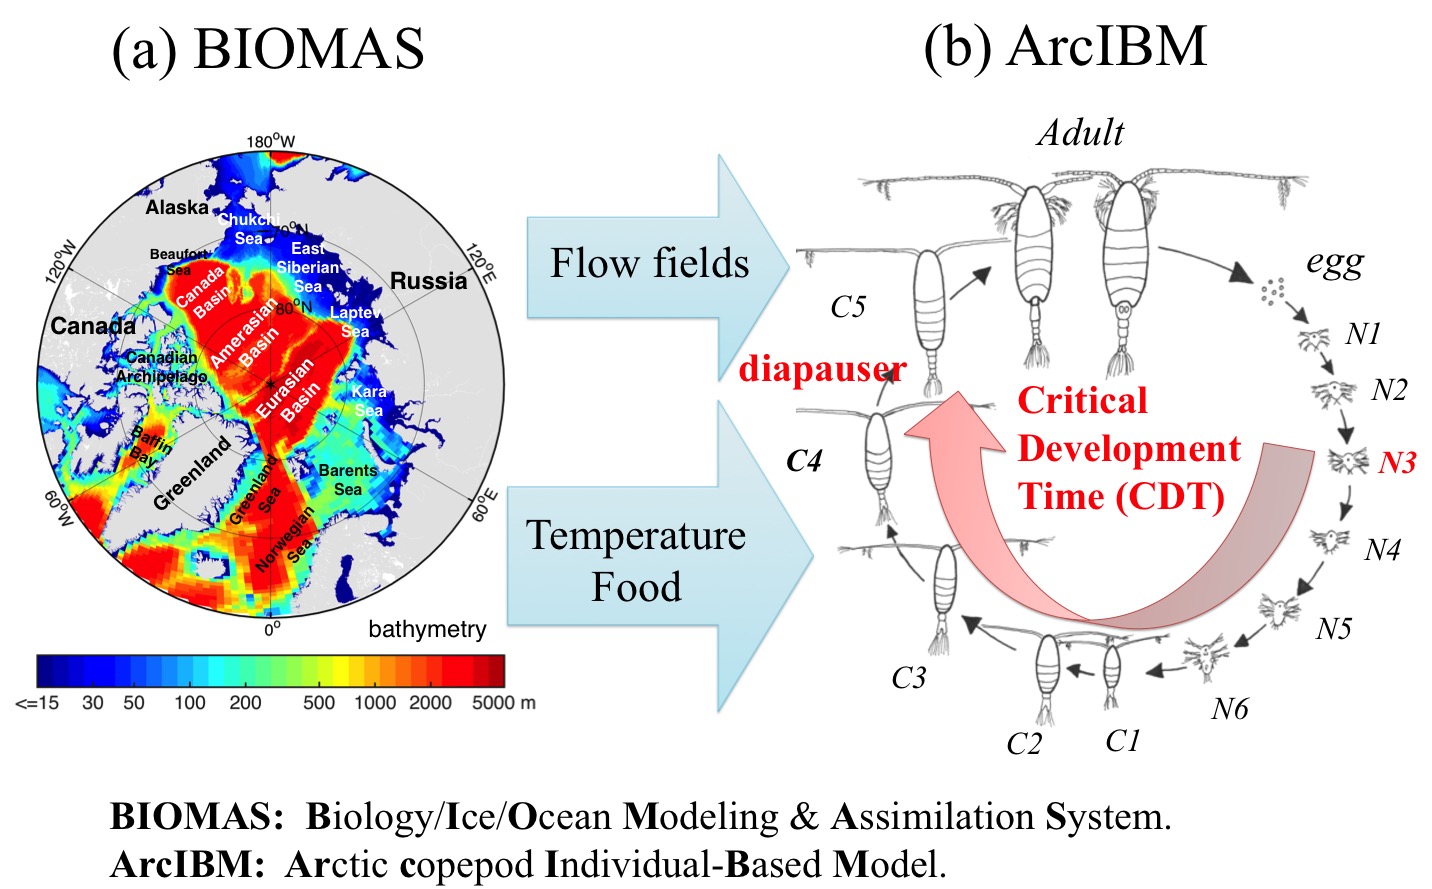
The offline model coupling between BIOMAS and ArcIBM. The BIOMAS-simulated daily-mean flow fields are temporally and spatially interpolated in ArcIBM to obtain meridional and zonal velocities for Lagrangian tracking. Temperature and food are interpolated to calculate copepod life history development (Feng et al. 2016).
Model Results
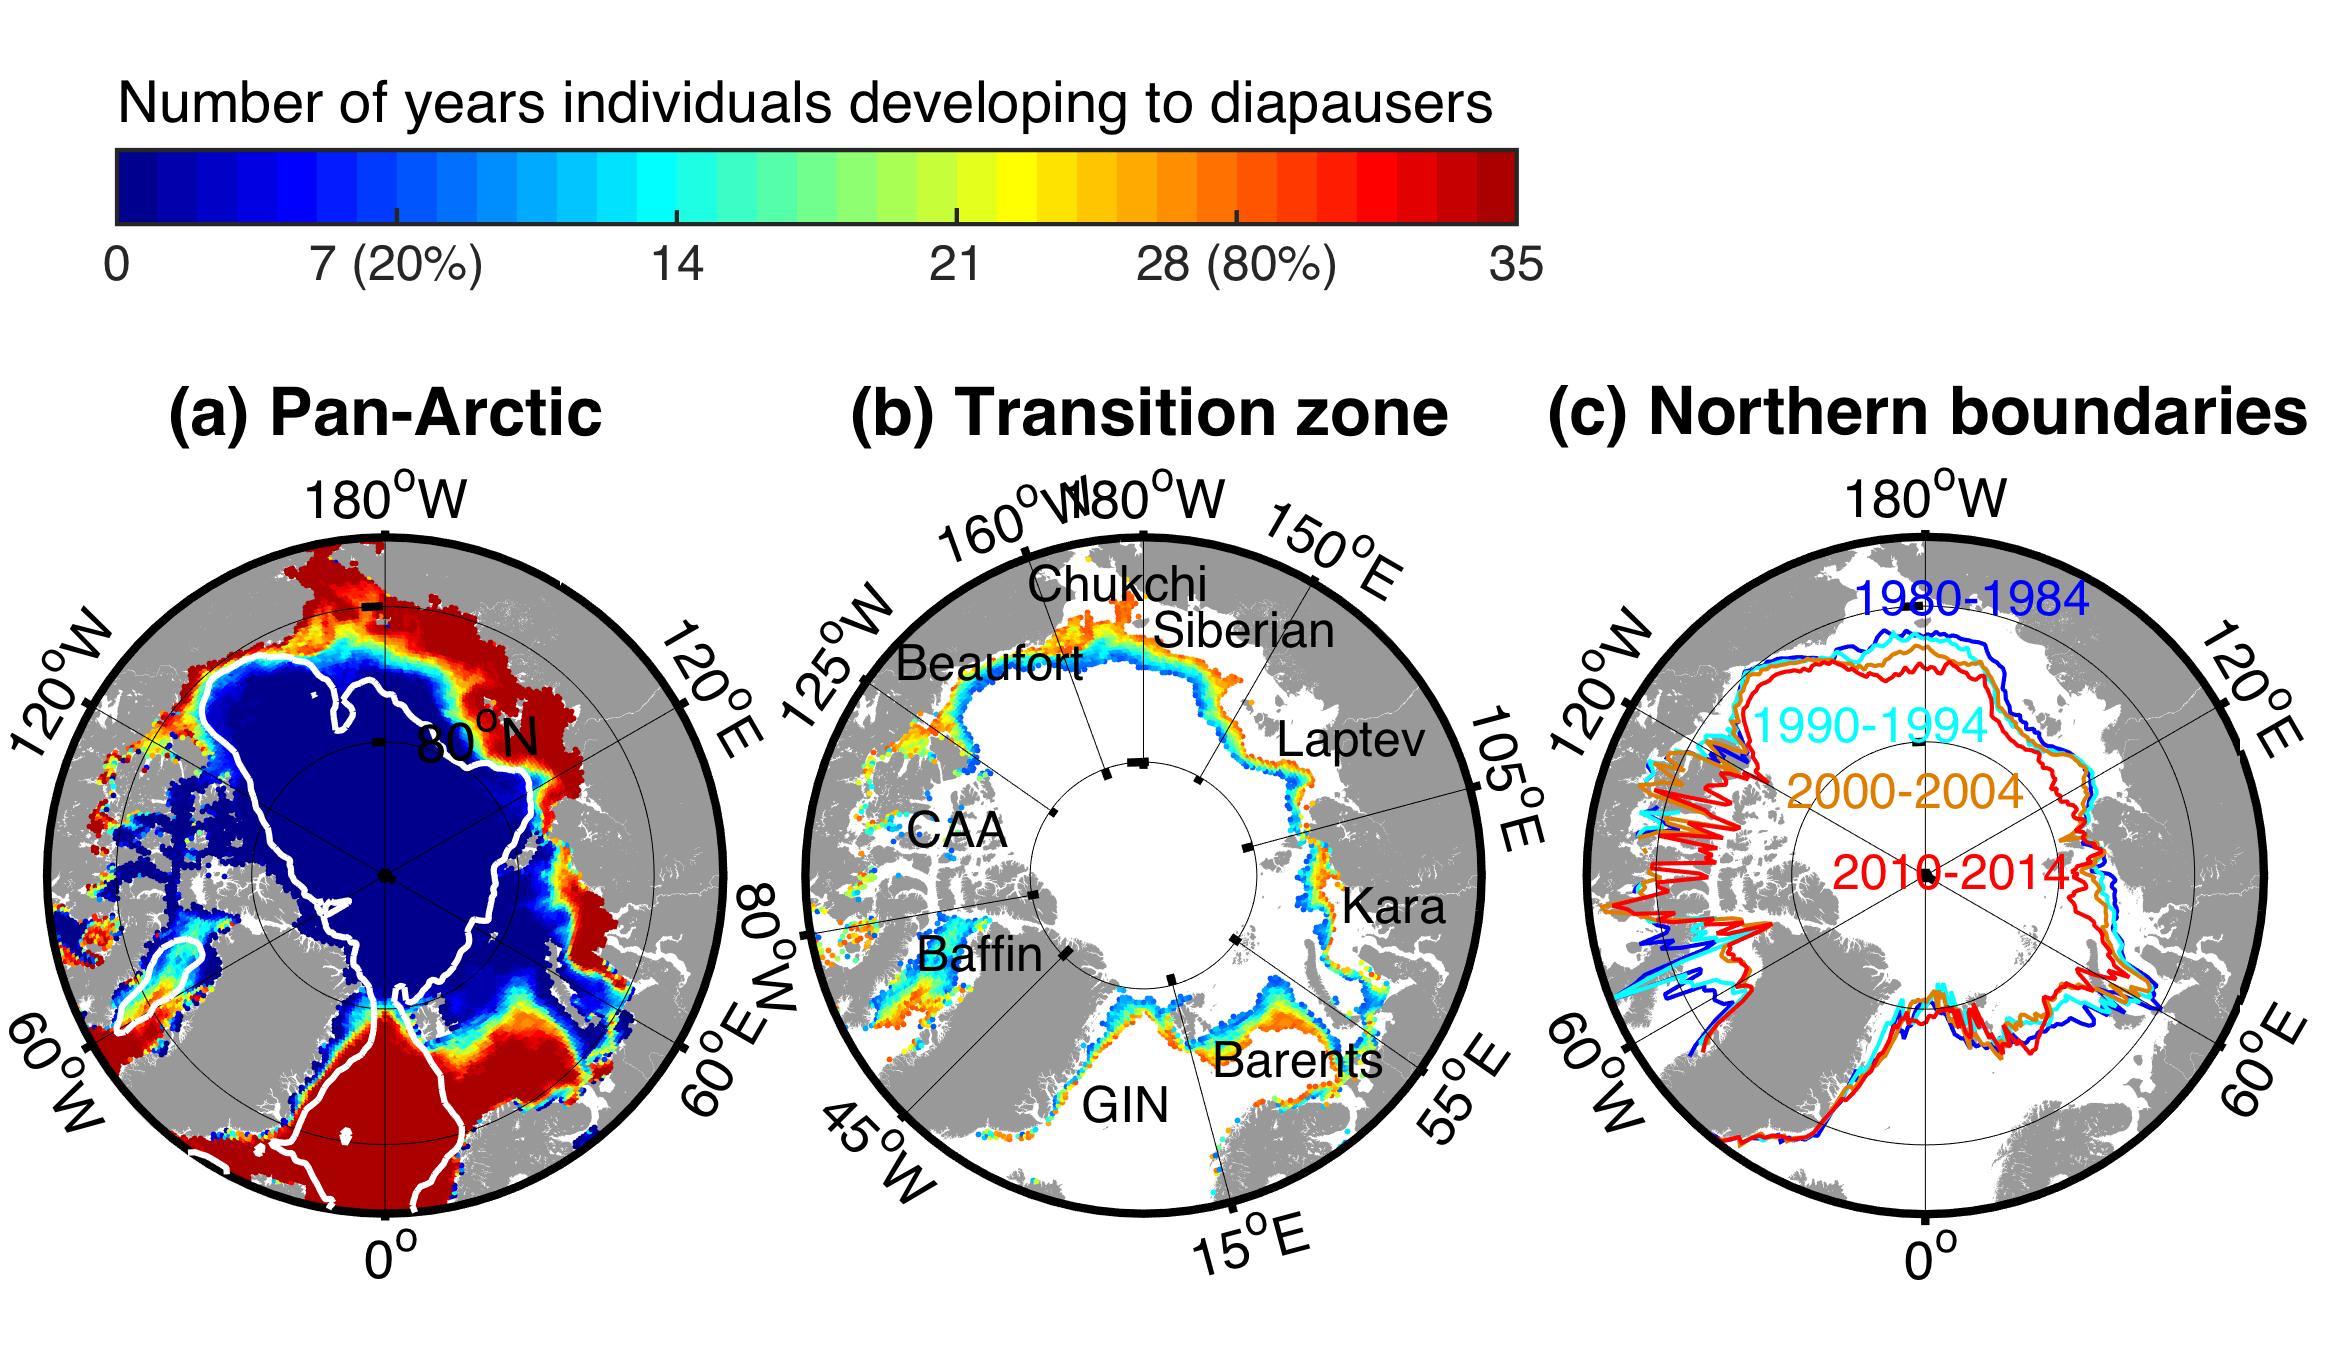
Model results (1980-2014): number of years that C. glacialis individuals develop to diapause before the end of the growth season: (a) in the Pan-Arctic and (b) in the transition zone, and (c) 5-year mean northern boundaries of diapausers in the years of 1980-1984, 1990-1994, 2000-2004 and 2010-2014. In Panel 2a, the 1000 m isobaths (white lines) are illustrated to separate shelf/slope seas from central basins. All C. glacialis individuals are positioned at their initial release locations. In Panel 2b, the transition zone is defined as the release location where C. glacialis individuals can successfully develop to diapause in 20-80% of the 35 modeled years (7-28 years). The names and longitudinal ranges of all 9 geographic sectors are shown. In Panel 2c, the northern boundaries of each 5-year period are the mean annual northernmost latitudes of all simulated diapausers in that period.
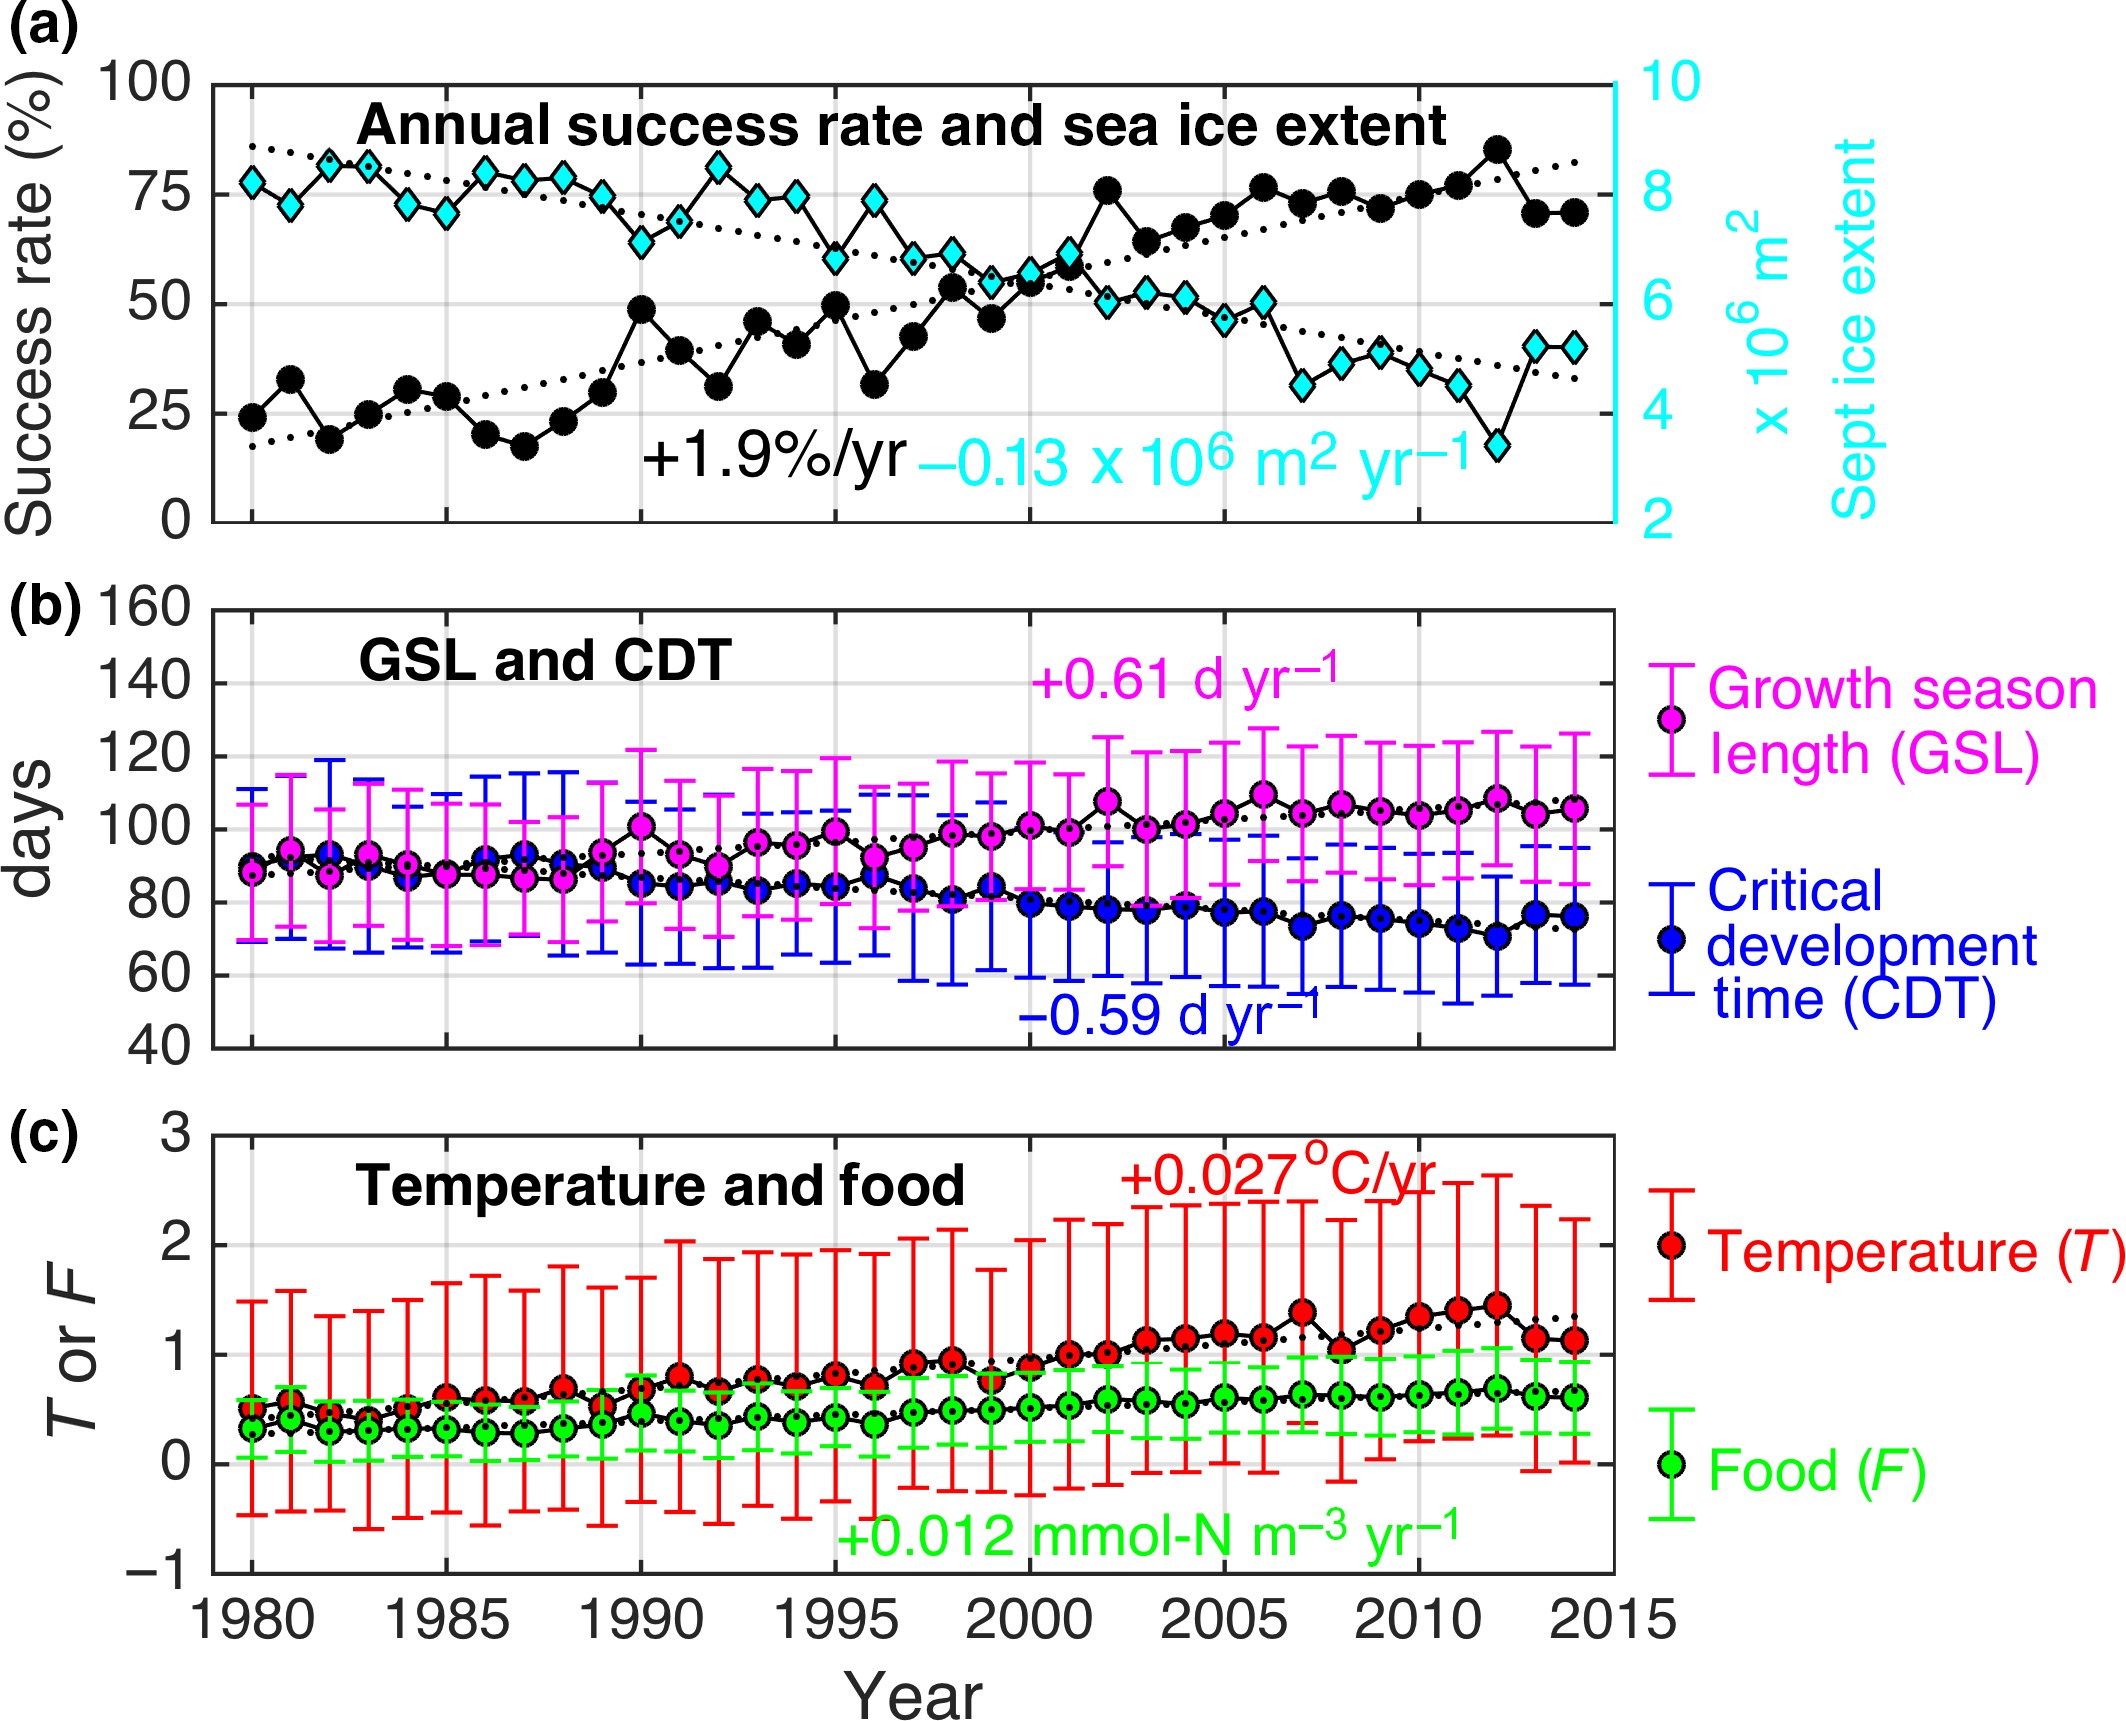
Annual success rates (ASR; 3a), mean growth season length (GSL; 3b), critical development time (CDT; 3b), temperature (T; 3c), and food (F; 3c) of transition-zone C. glacialis individuals for the modeled years, September mean sea ice extent (3a), and fitted linear trends for all parameters (black dotted lines). Error bars show standard deviations.
Funding Agencies
The National Science Foundation Arctic Program under grant number 1417677.


Partners/Collaborators
This is a joint project with Dr. Rubao Ji and Dr. Carin Ashjian (WHOI), Dr. Jinlun Zhang (University of Washington) and Dr. Robert Campbell (University of Rhode Island).