Time-series Stations

All Time-series Stations Metadata
| Site | Location | Time Range | Temporal Resolution | Bottom Depth | # of Visits | Dedicated Vessel | Parameters | Original DOI(s) |
|---|---|---|---|---|---|---|---|---|
| KNOT | 44.0°N, 155.0°E | 1992– 2020 | 1-3 cruises/yr | 6000m | 21 | No | T,S,O2,NO3,NO2,SiOH4,PO4,NH4,DIC,TA,pH | 10.25921/tarq-6v91 |
| K2 | 47.0°N, 160.0°E | 1999– 2020 | 1-3 cruises/yr | 6000m | 49 | No | T,S,O2,NO3,NO2,SiOH4,PO4,NH4,DIC,TA,pH,DOC | 10.25921/mpfz-sv16 |
| ALOHA | 22.8°N, 158.0°W | 1988– 2019 | Monthly | 4750m | 311 | Yes | T,S,O2,NO3,NO2,SiOH4,PO4,DIC,TA,pH, TPC,TPN,TPP,DOC | 10.1575/1912/bco-dmo.3773.1 |
| Munida | 45.8°S, 171.5°E | 1998– 2019 | 6 cruises/yr | 1000 m | 80 | Yes | T,S*,NO3,SiOH4,PO4,DIC,TA | NA |
| GIFT | 36.9°N, 6.0° W | 2005– 2015 | Seasonal | 315m - 842m | 26 | Yes | T,S*,O2,NO3,SiOH4, TA,pH,DOC | 10.20350/digitalCSIC/10549; 10.20350/digitalCSIC/12499 |
| CVOO | 17.6°N, 24.3°W | 2006– 2019 | 1-3 cruises/yr | 3600m | 42 | Partly | T,S,O2,NO3,NO2,SiOH4,PO4,NH4,DIC,TA, TPC,TPN,TPP | 10.1594/PANGAEA.958597 |
| RADCOR | 43.4°N, 8.4°E | 1989– 2020 | Monthly | 15m - 80m | 80 | Yes | T,S*,O2,NO3,NO2,SiOH4, PO4,DIC,TA,pH | 10.1594/PANGAEA.919087; 10.20350/digitalCSIC/13786 |
| CARIACO | 10.5°N, 64.7°W | 1995– 2017 | Monthly | 1300m | 230 | Yes | S,O2,NO3,NO2,SiOH4, PO4,NH4,TA,pH, POC,PON,POP,DOC | doi10.1575/1912/bco-dmo.3093.1 |
| DYFAMED | 42.3°N 7.5°E | 1991– 2017 | Monthly | 2400m | 190 | No | T,S*,O2,NO3,NO2,SiOH4,PO4,DIC,TA,pH | 10.17882/43749 |
| IrmingerSea | 64.3°N 28.0°W | 1983– 2019 | Seasonal | 1000m | 131 | Yes | T,S,O2,NO3,SiOH4,PO4,DIC,TA,pCO2 | 10.3334/cdiac/otg.carina_irmingersea_v2; 10.25921/vjmy-8h90 |
| IcelandSea | 68.0°N, 12.7°W | 1985– 2019 | Seasonal | 1850m | 146 | Yes | T,S,O2,NO3,SiOH4,PO4,DIC,TA,pCO2 | 10.3334/cdiac/otg.carina_icelandsea; 10.25921/qhed-3h84 |
| OWSM | 66.0°N, 2.0°E | 2001– 2021 | 4-12 cruises yr-1 | 2100m | 147 | Until 2009 | T,S*,O2,NO3,SiOH4,PO4, DIC,TA | 10.3334/cdiac/otg_tsm_ows_m_66n_2e |
Station Descriptions and Summary Figures
ALOHA - Hawaii Ocean Time-series (HOT)
Scientists working on the Hawaii Ocean Time-series (HOT) program have been making repeated observations of the hydrography, chemistry and biology of the water column at a station north of Oahu, Hawaii since October 1988. The objective of this research is to provide a comprehensive description of the ocean at a site representative of the North Pacific subtropical gyre. Cruises are made approximately once per month to the deep-water (about 4800m) station ALOHA (A Long-term Oligotrophic Habitat Assessment) located 100 km north of Oahu, Hawaii. Measurements of the thermohaline structure, water column chemistry, currents, optical properties, primary production, plankton community structure, and rates of particle export are made on each cruise. ALOHA serves as the open ocean benchmark and its research goals are aligned with the main objectives of JGOFS and the World Ocean Circulation Experiment (WOCE). One of HOT’s principal objectives is to observe seasonal and interannual variations in water mass characteristics and biogeochemical variables. The monthly measurements since 1988 are representative of the oligotroph North Pacific eastern subtropical gyre with ALOHA lying in the center of the North Pacific- and North Equatorial Current. Typically, the site is characterized by a relatively deep permanent pycnocline (and nutricline), and shallow mixed-layer depth. Intermitted local wind forcing, caused by extratropical cyclones' cold fronts, impacts the annual cycle of the surface waters (Karl et al., 1996).
Karl, D.K., and Church, M.J. 2019. Station ALOHA: A Gathering Place for Discovery, Education, and Scientific Collaboration
Contact: Angelicque White
IGMETS METABASE Explorer record
ODIS User Interface (coming ~2024)
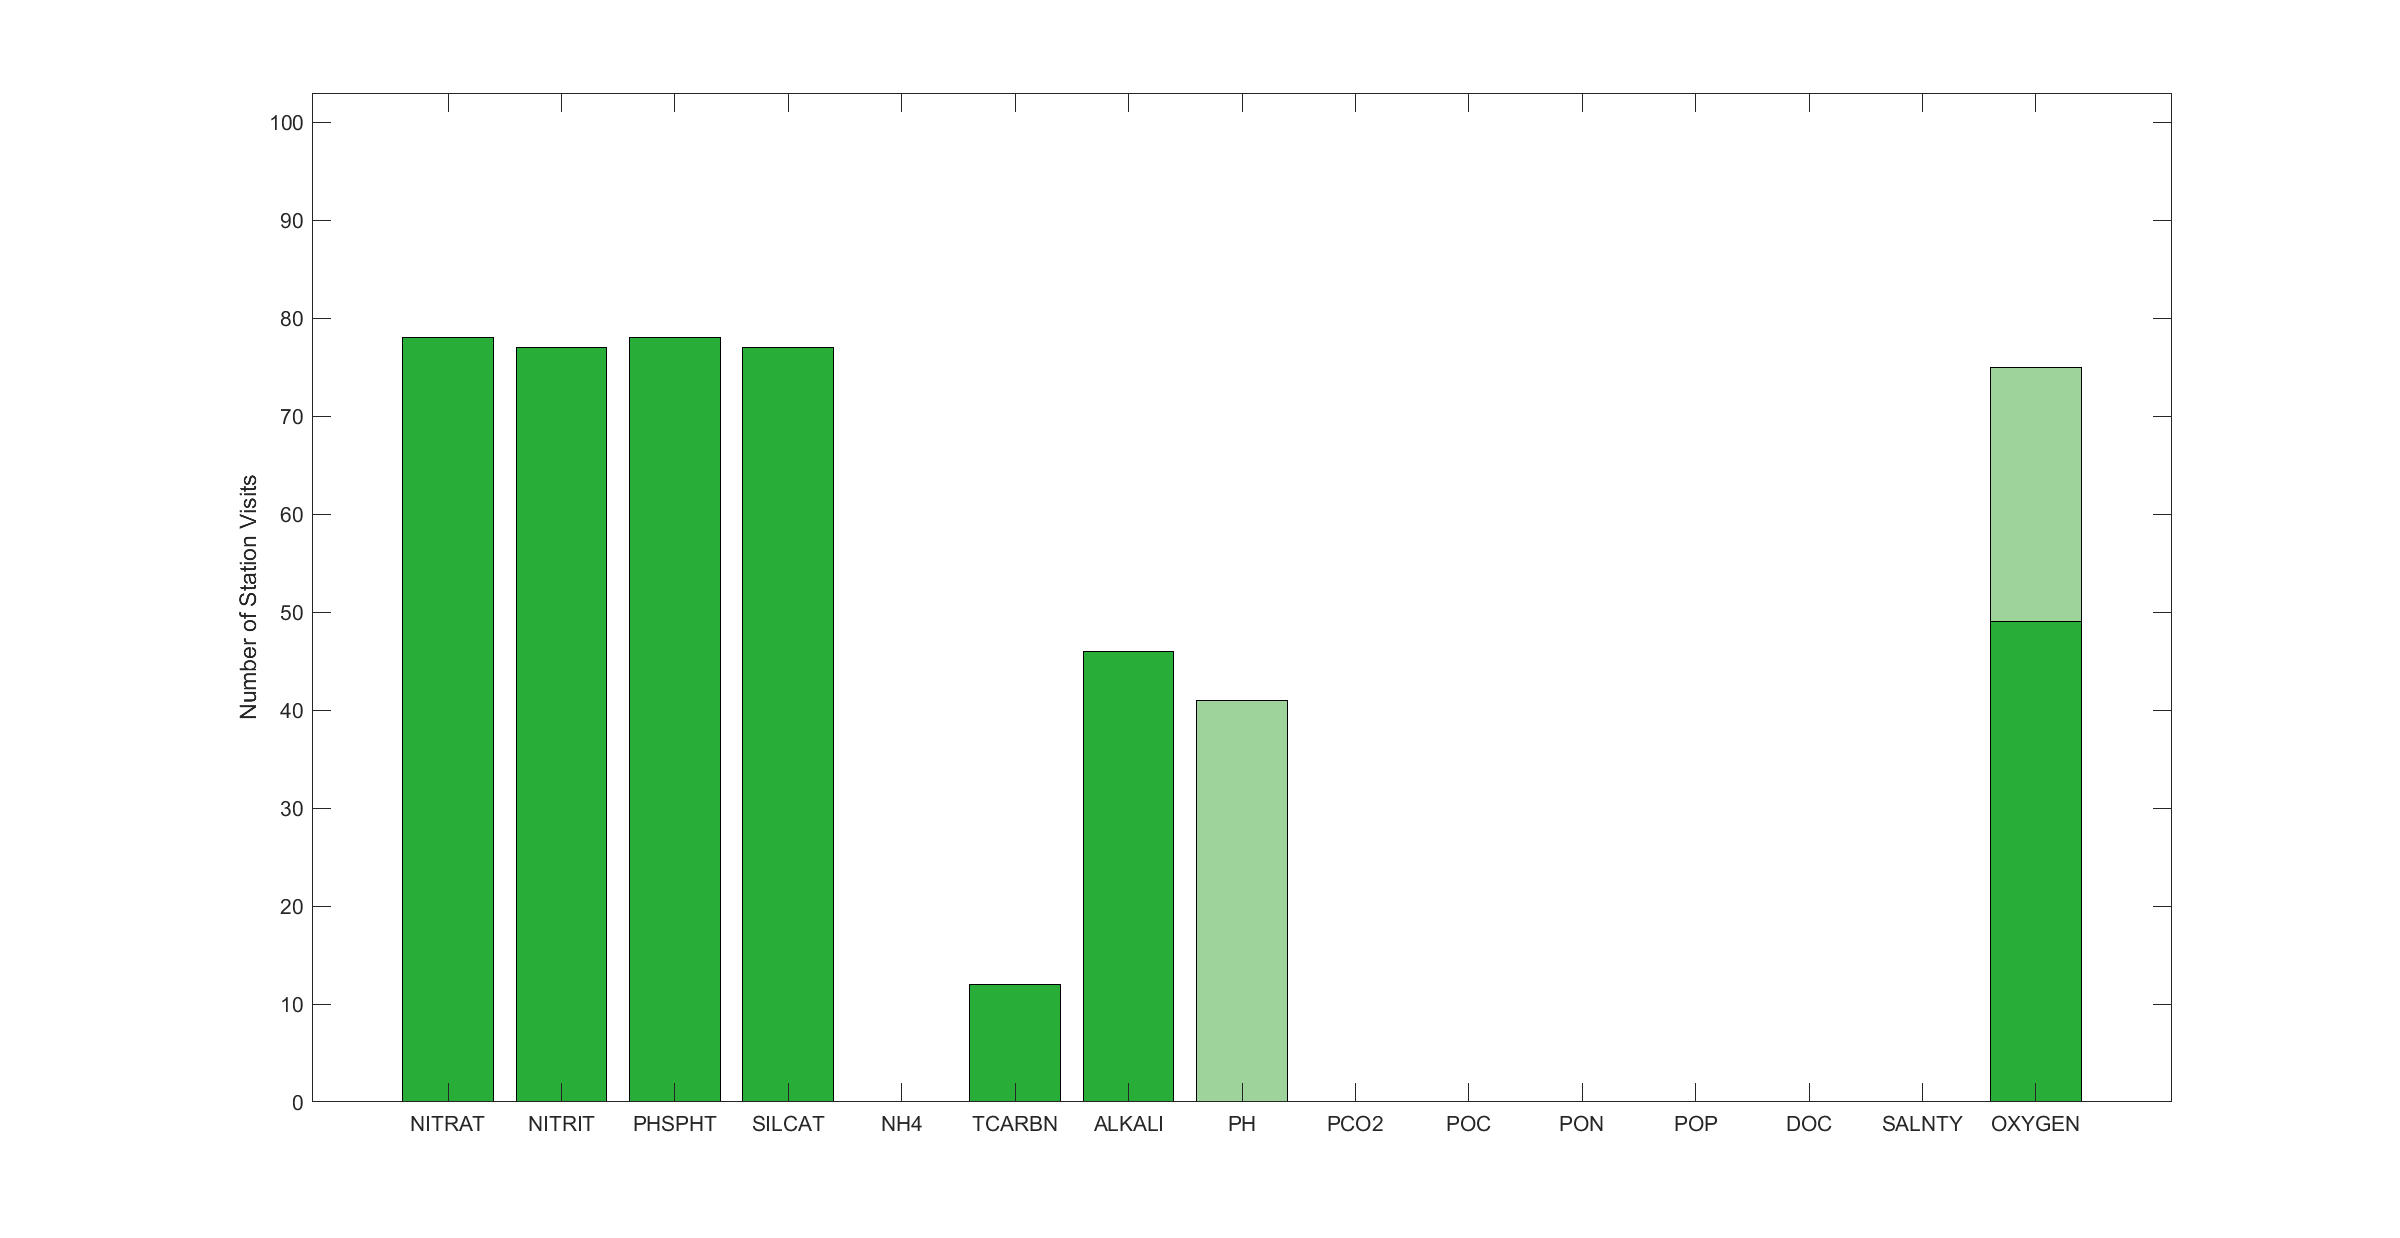
ALOHA results of best practices assessment
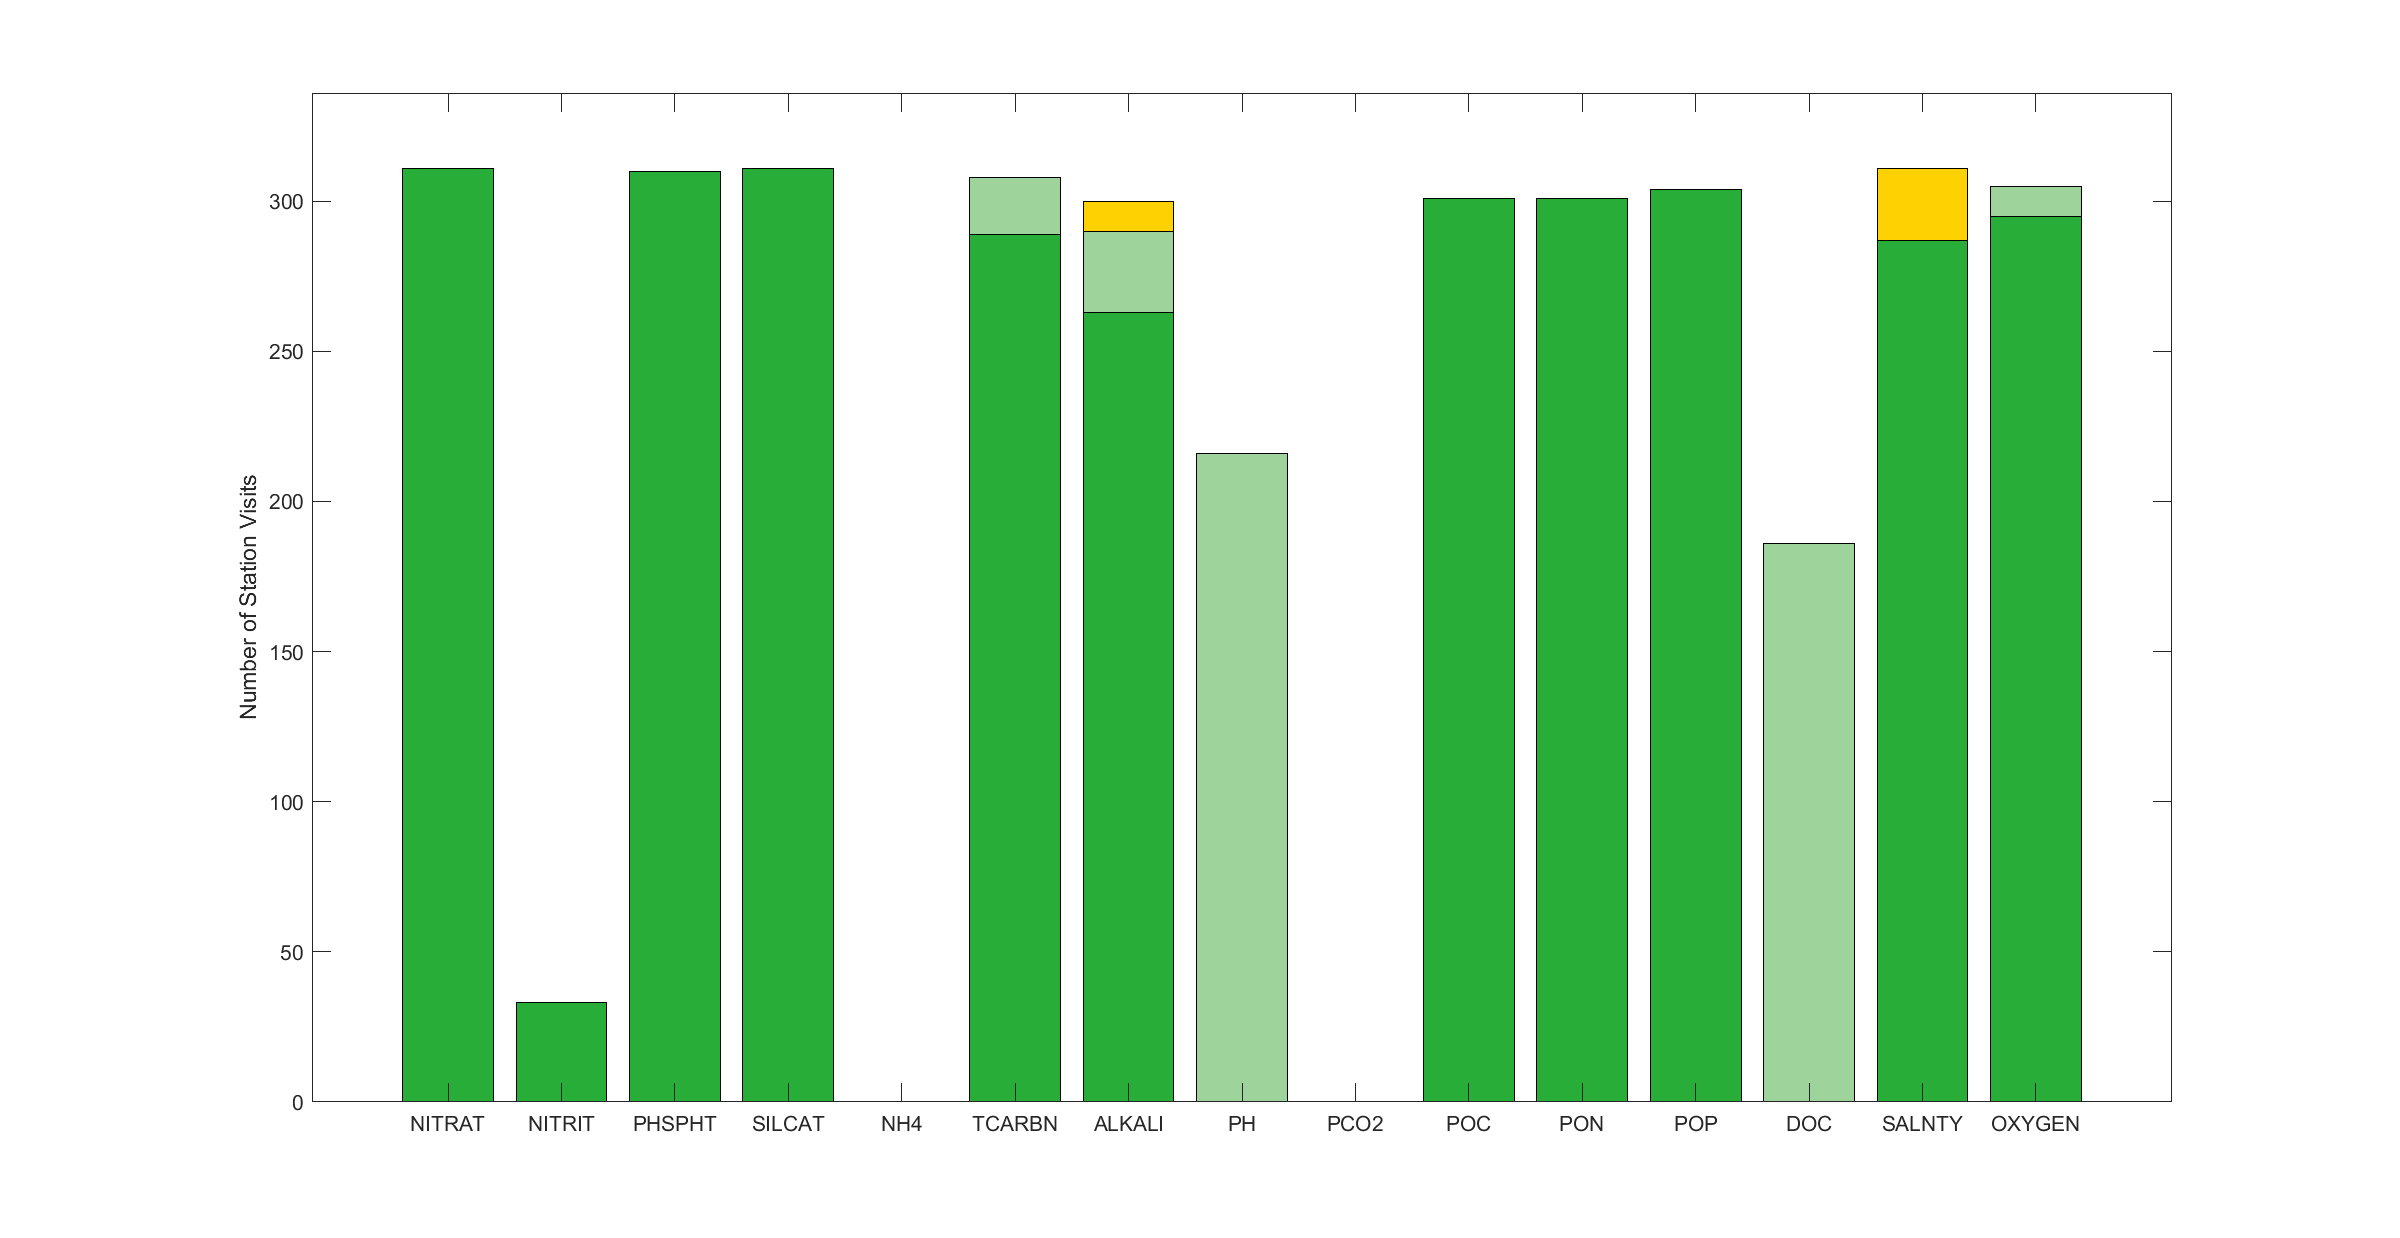
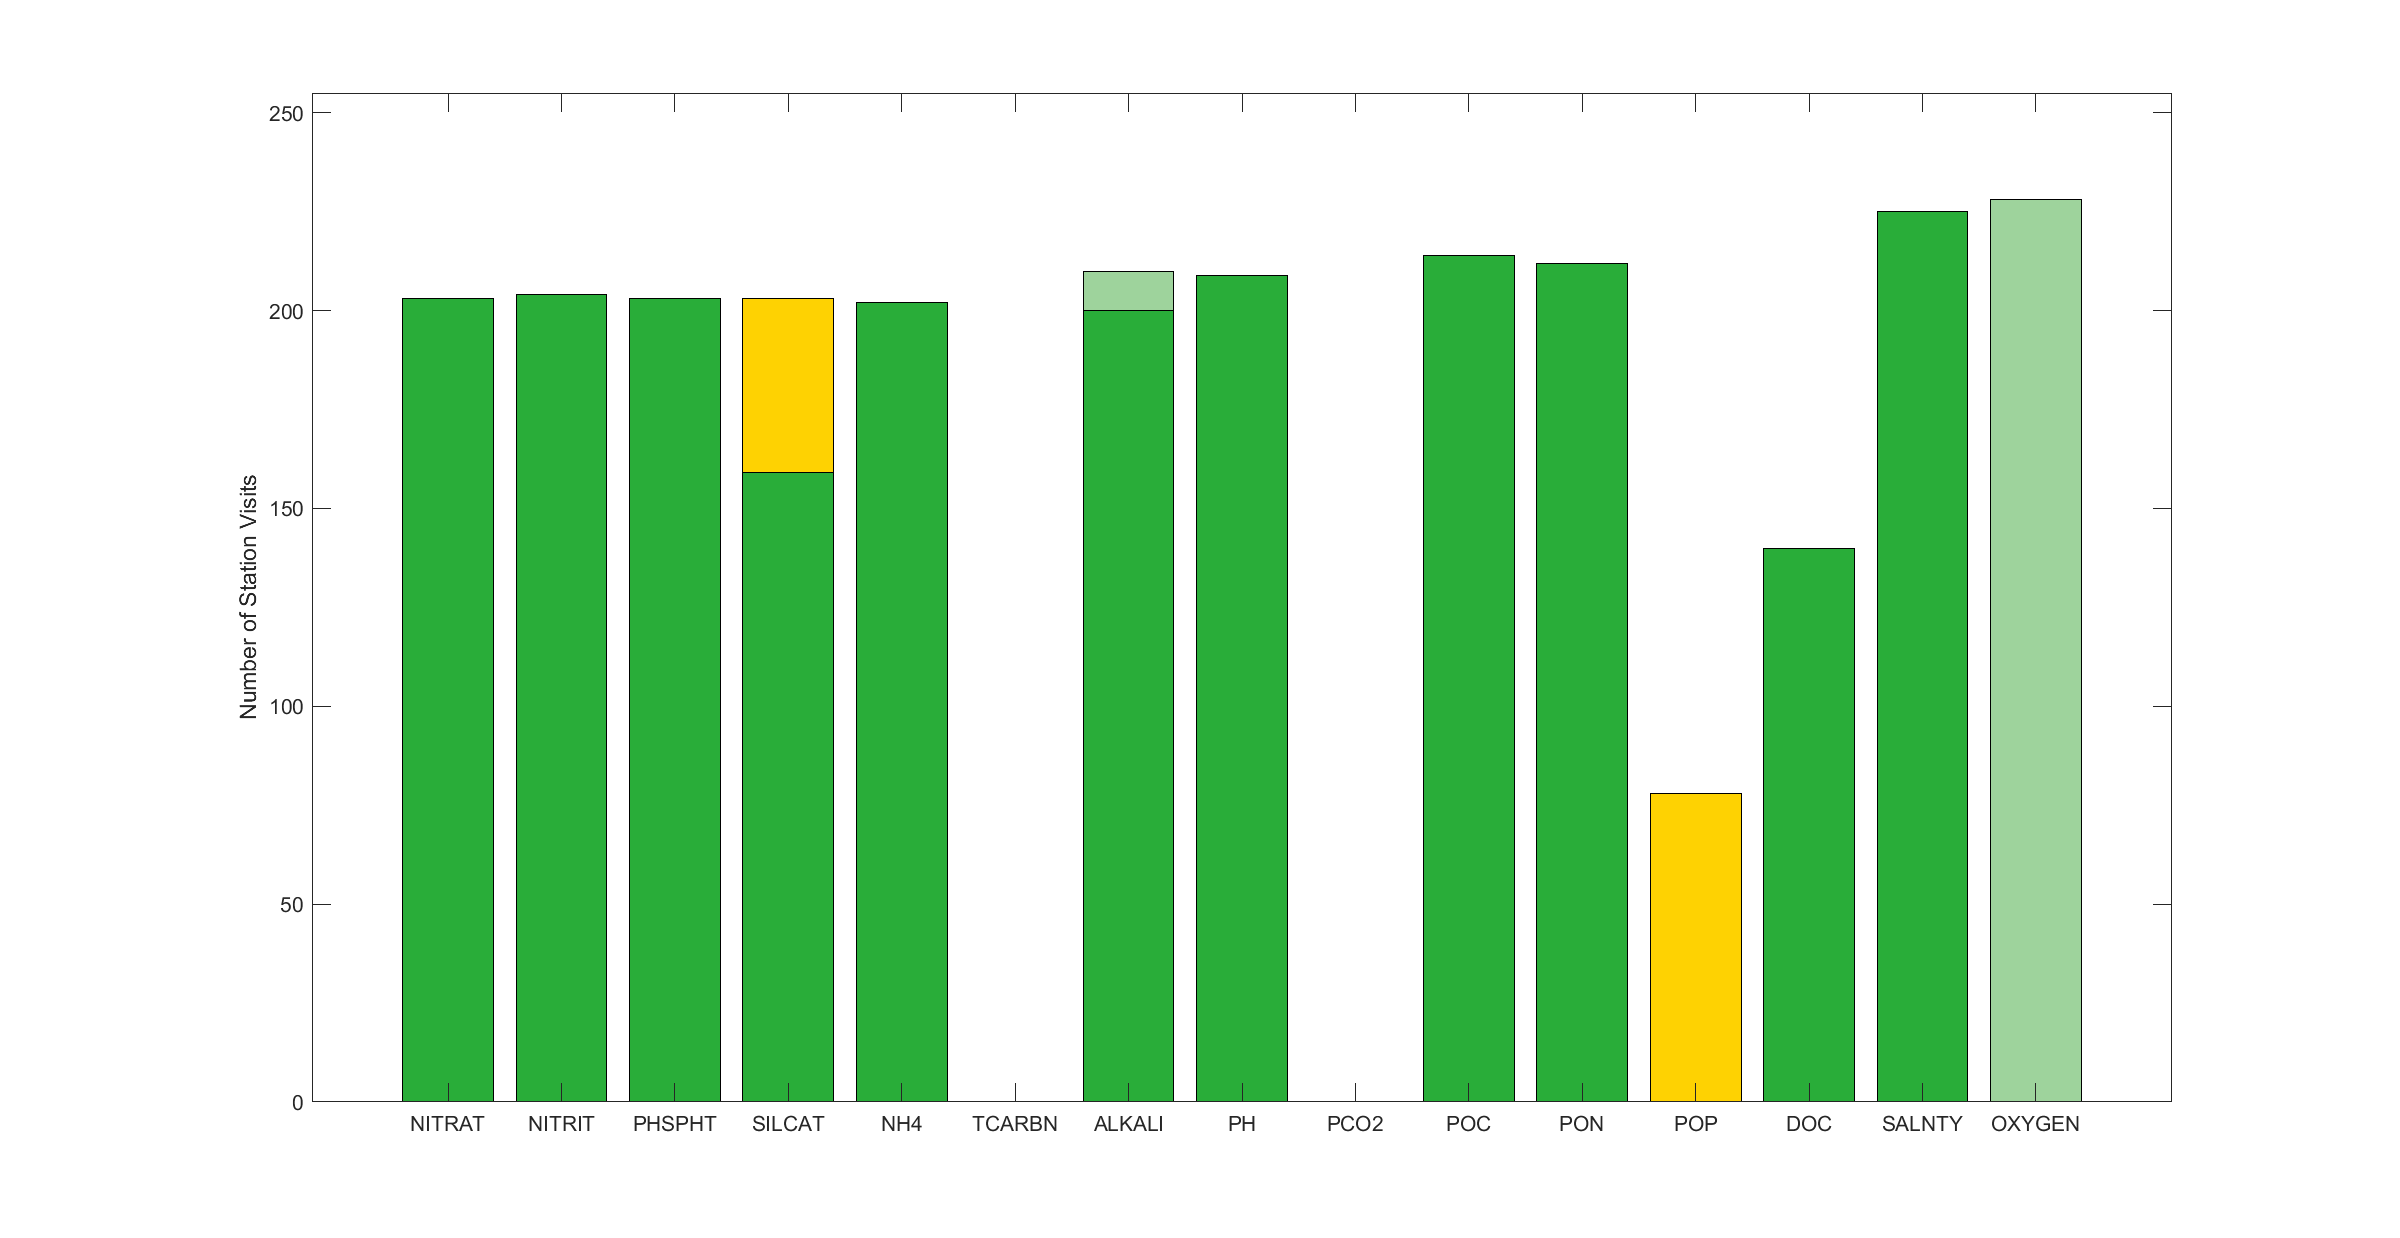
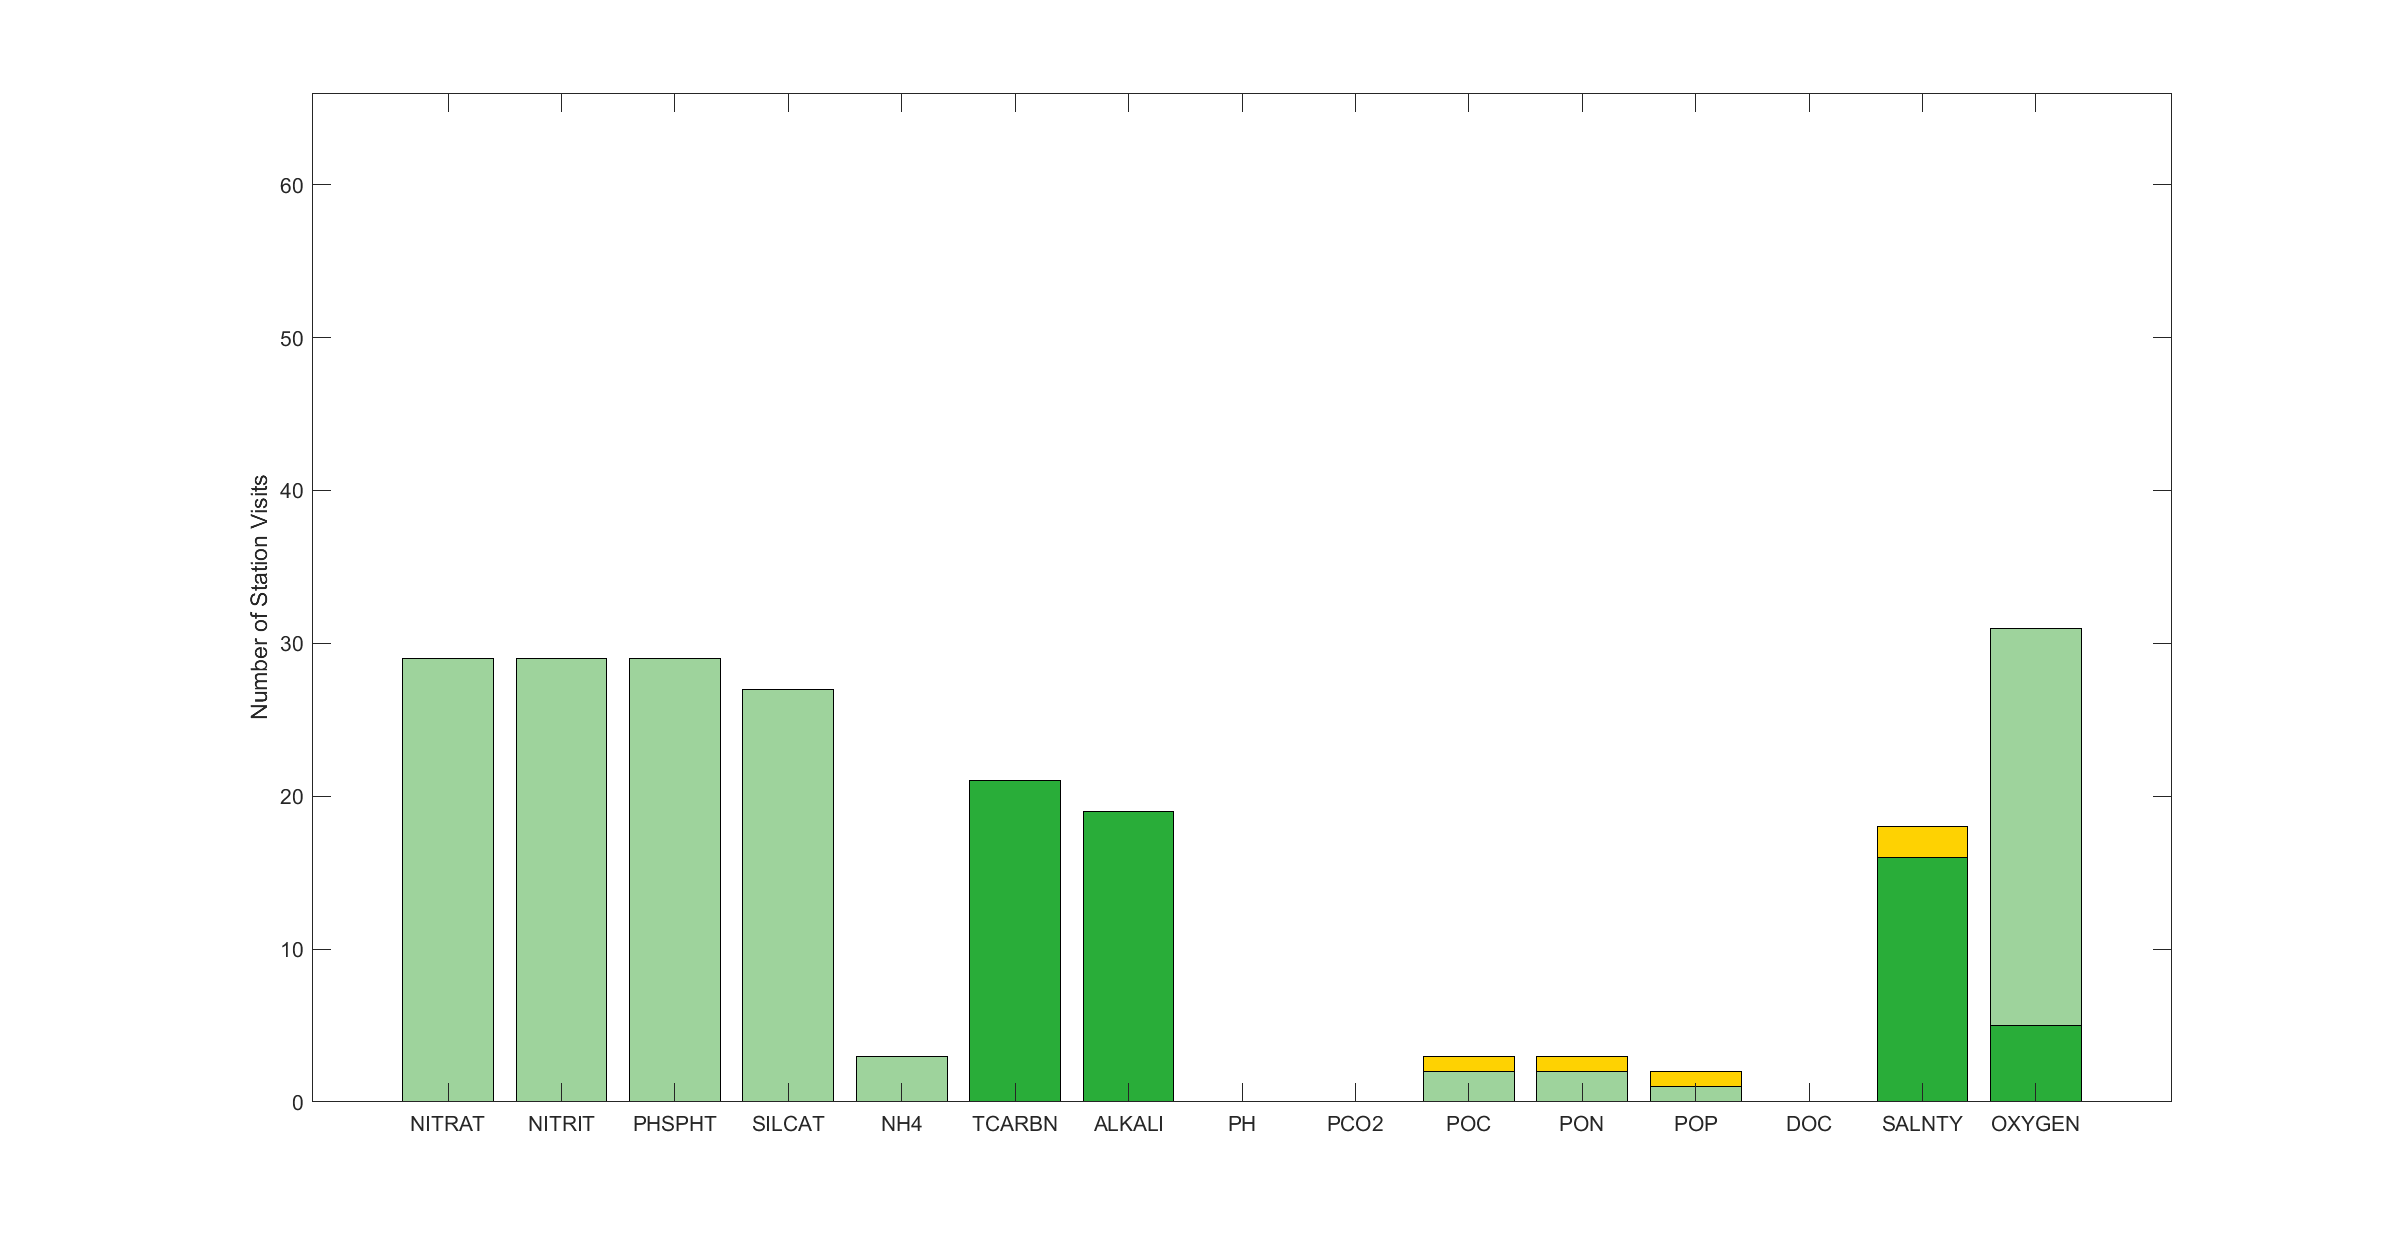
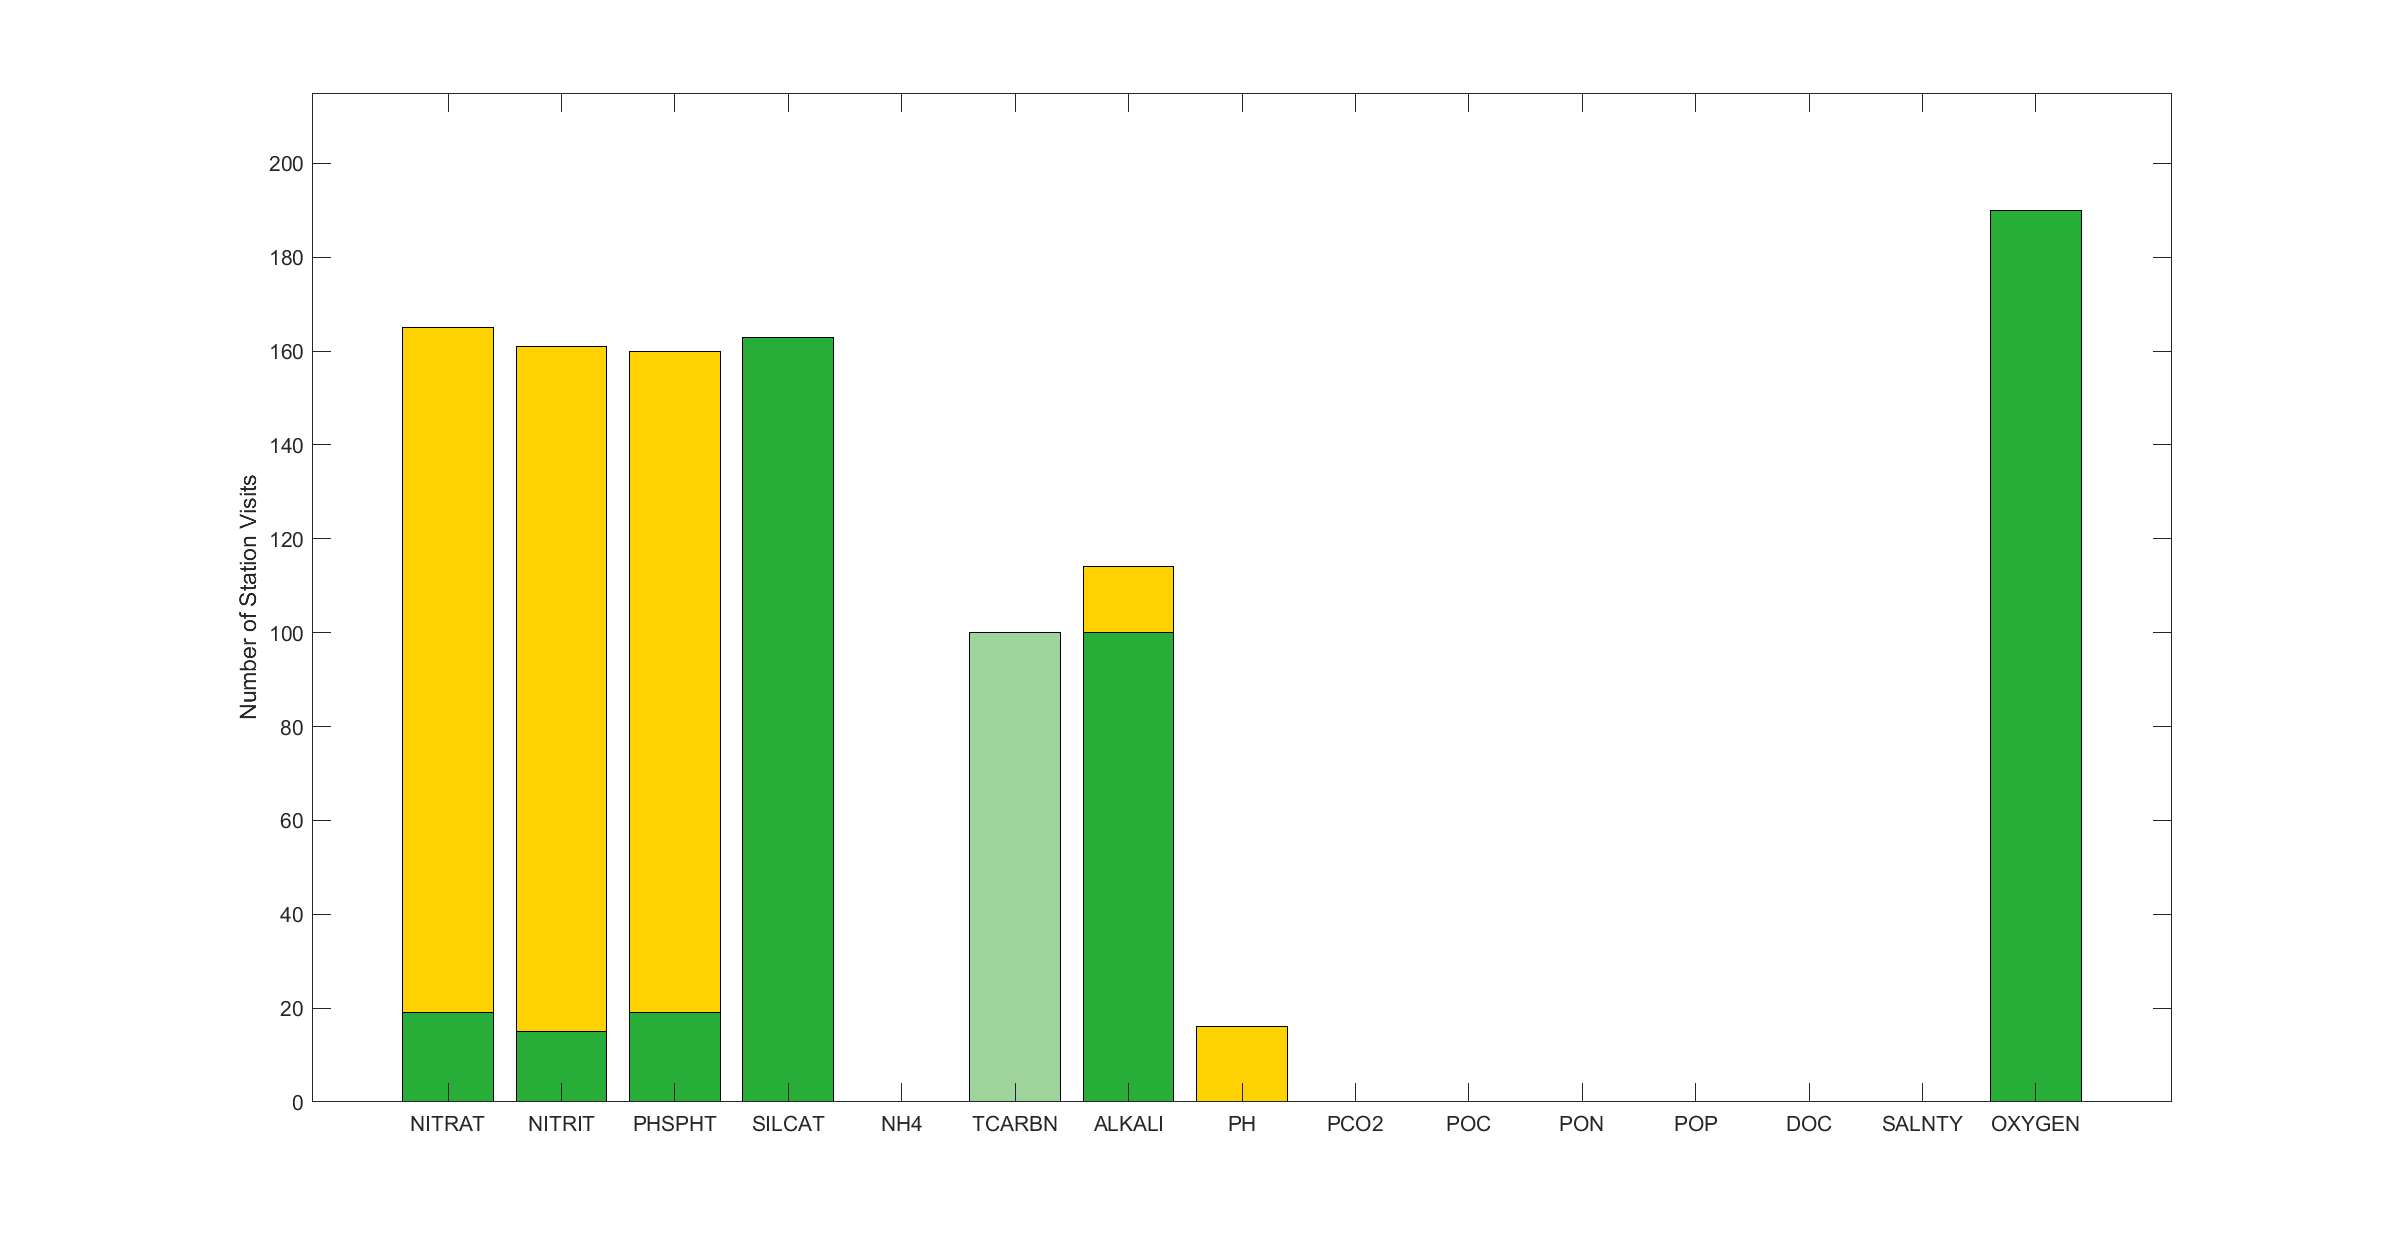
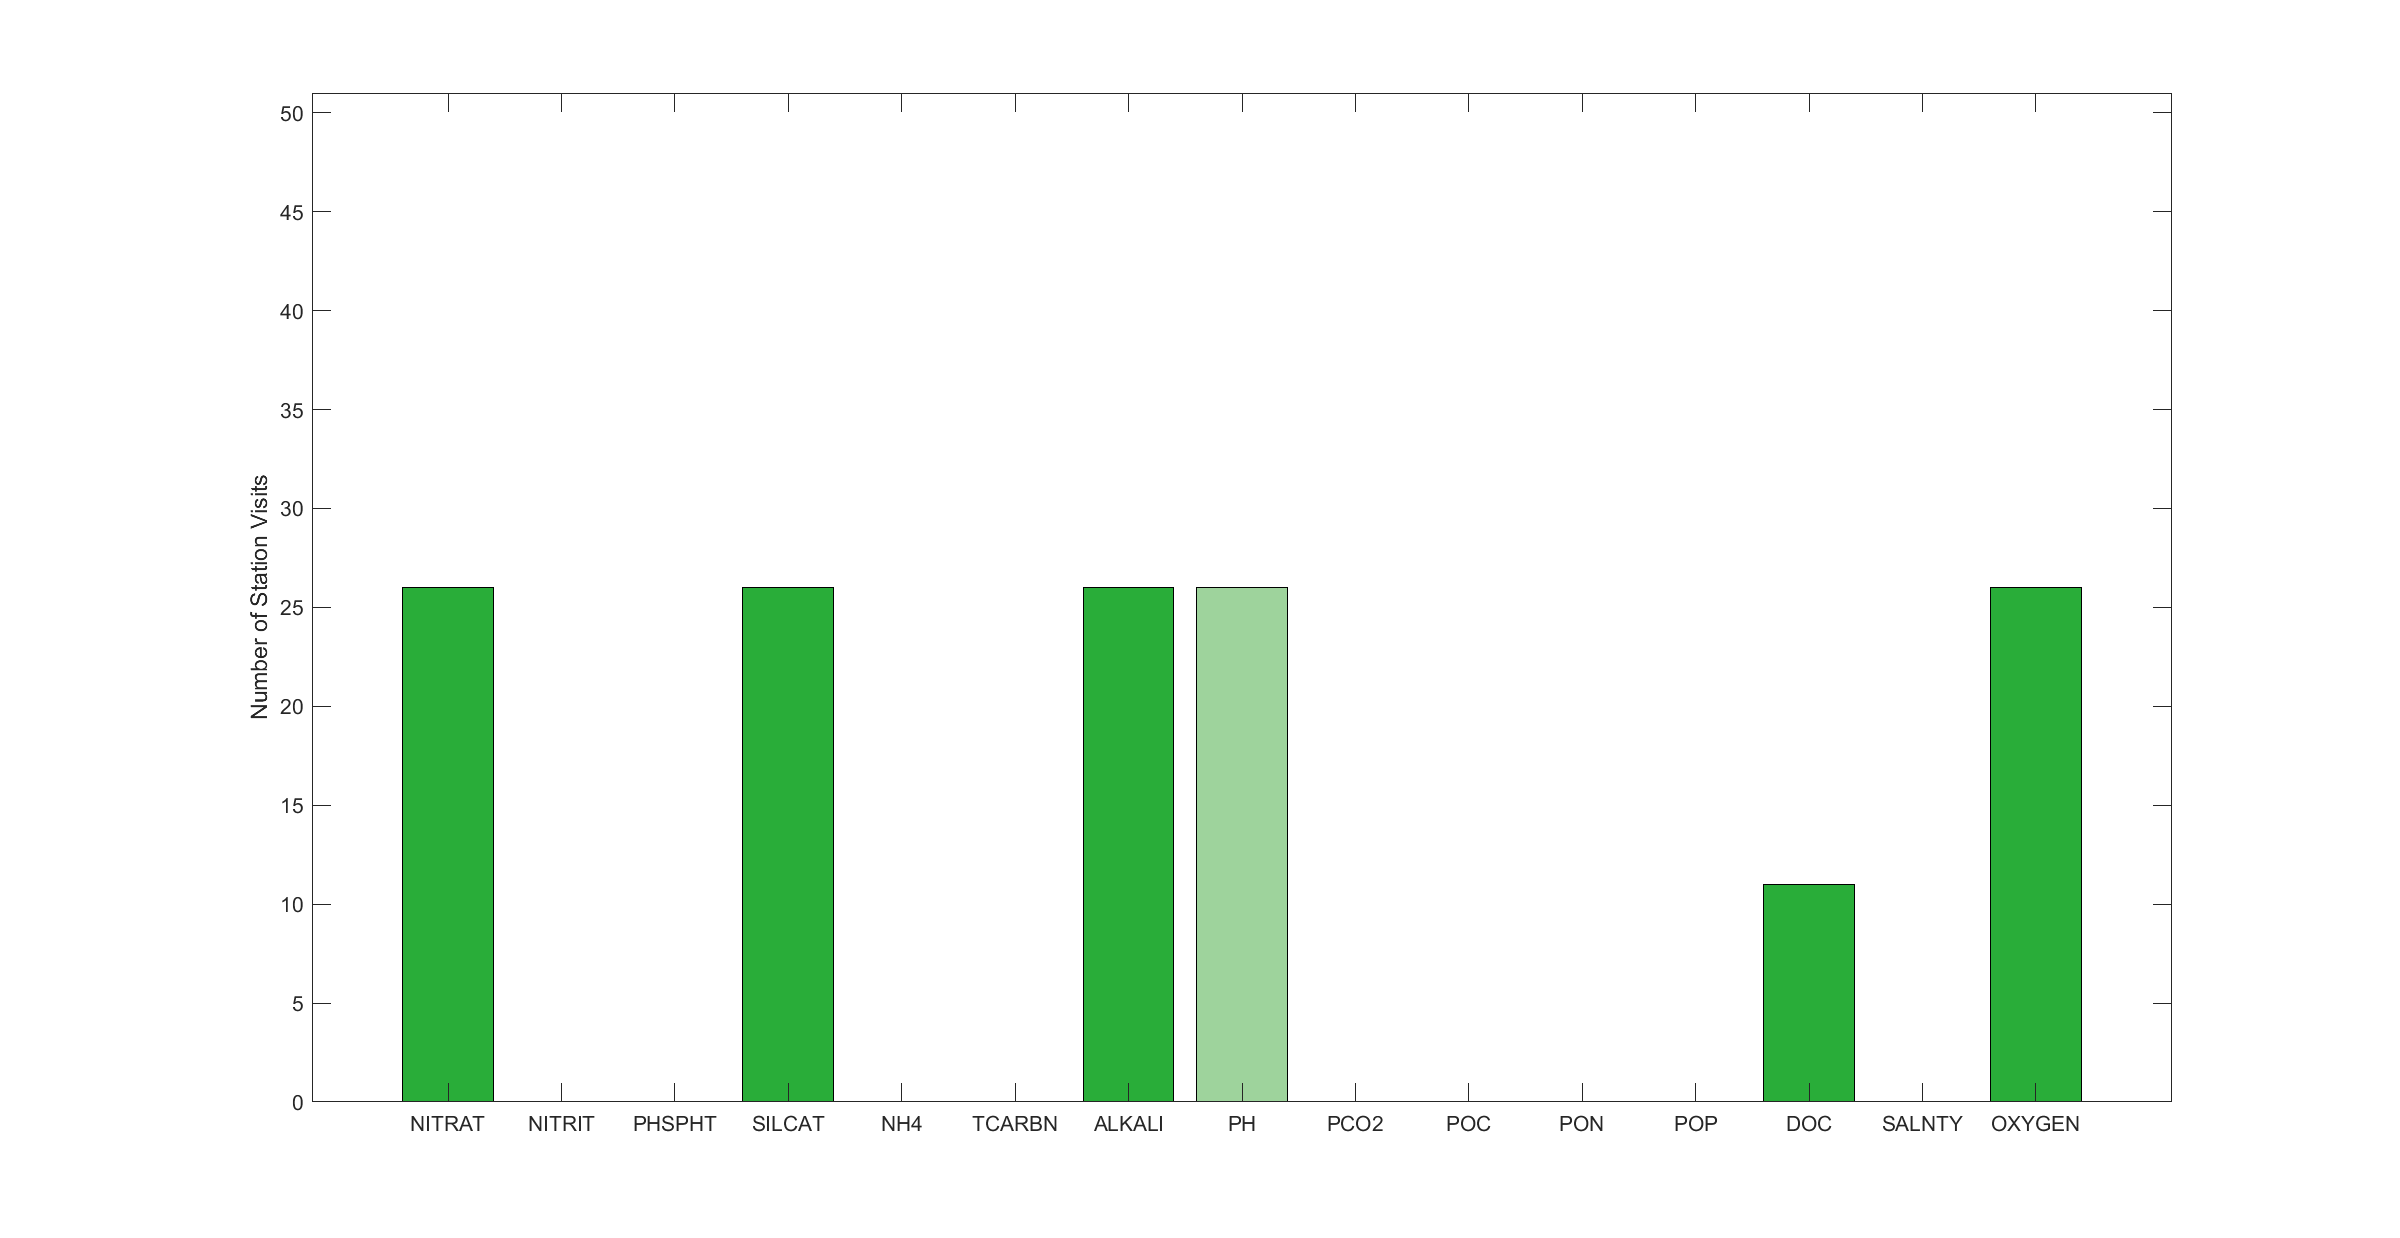
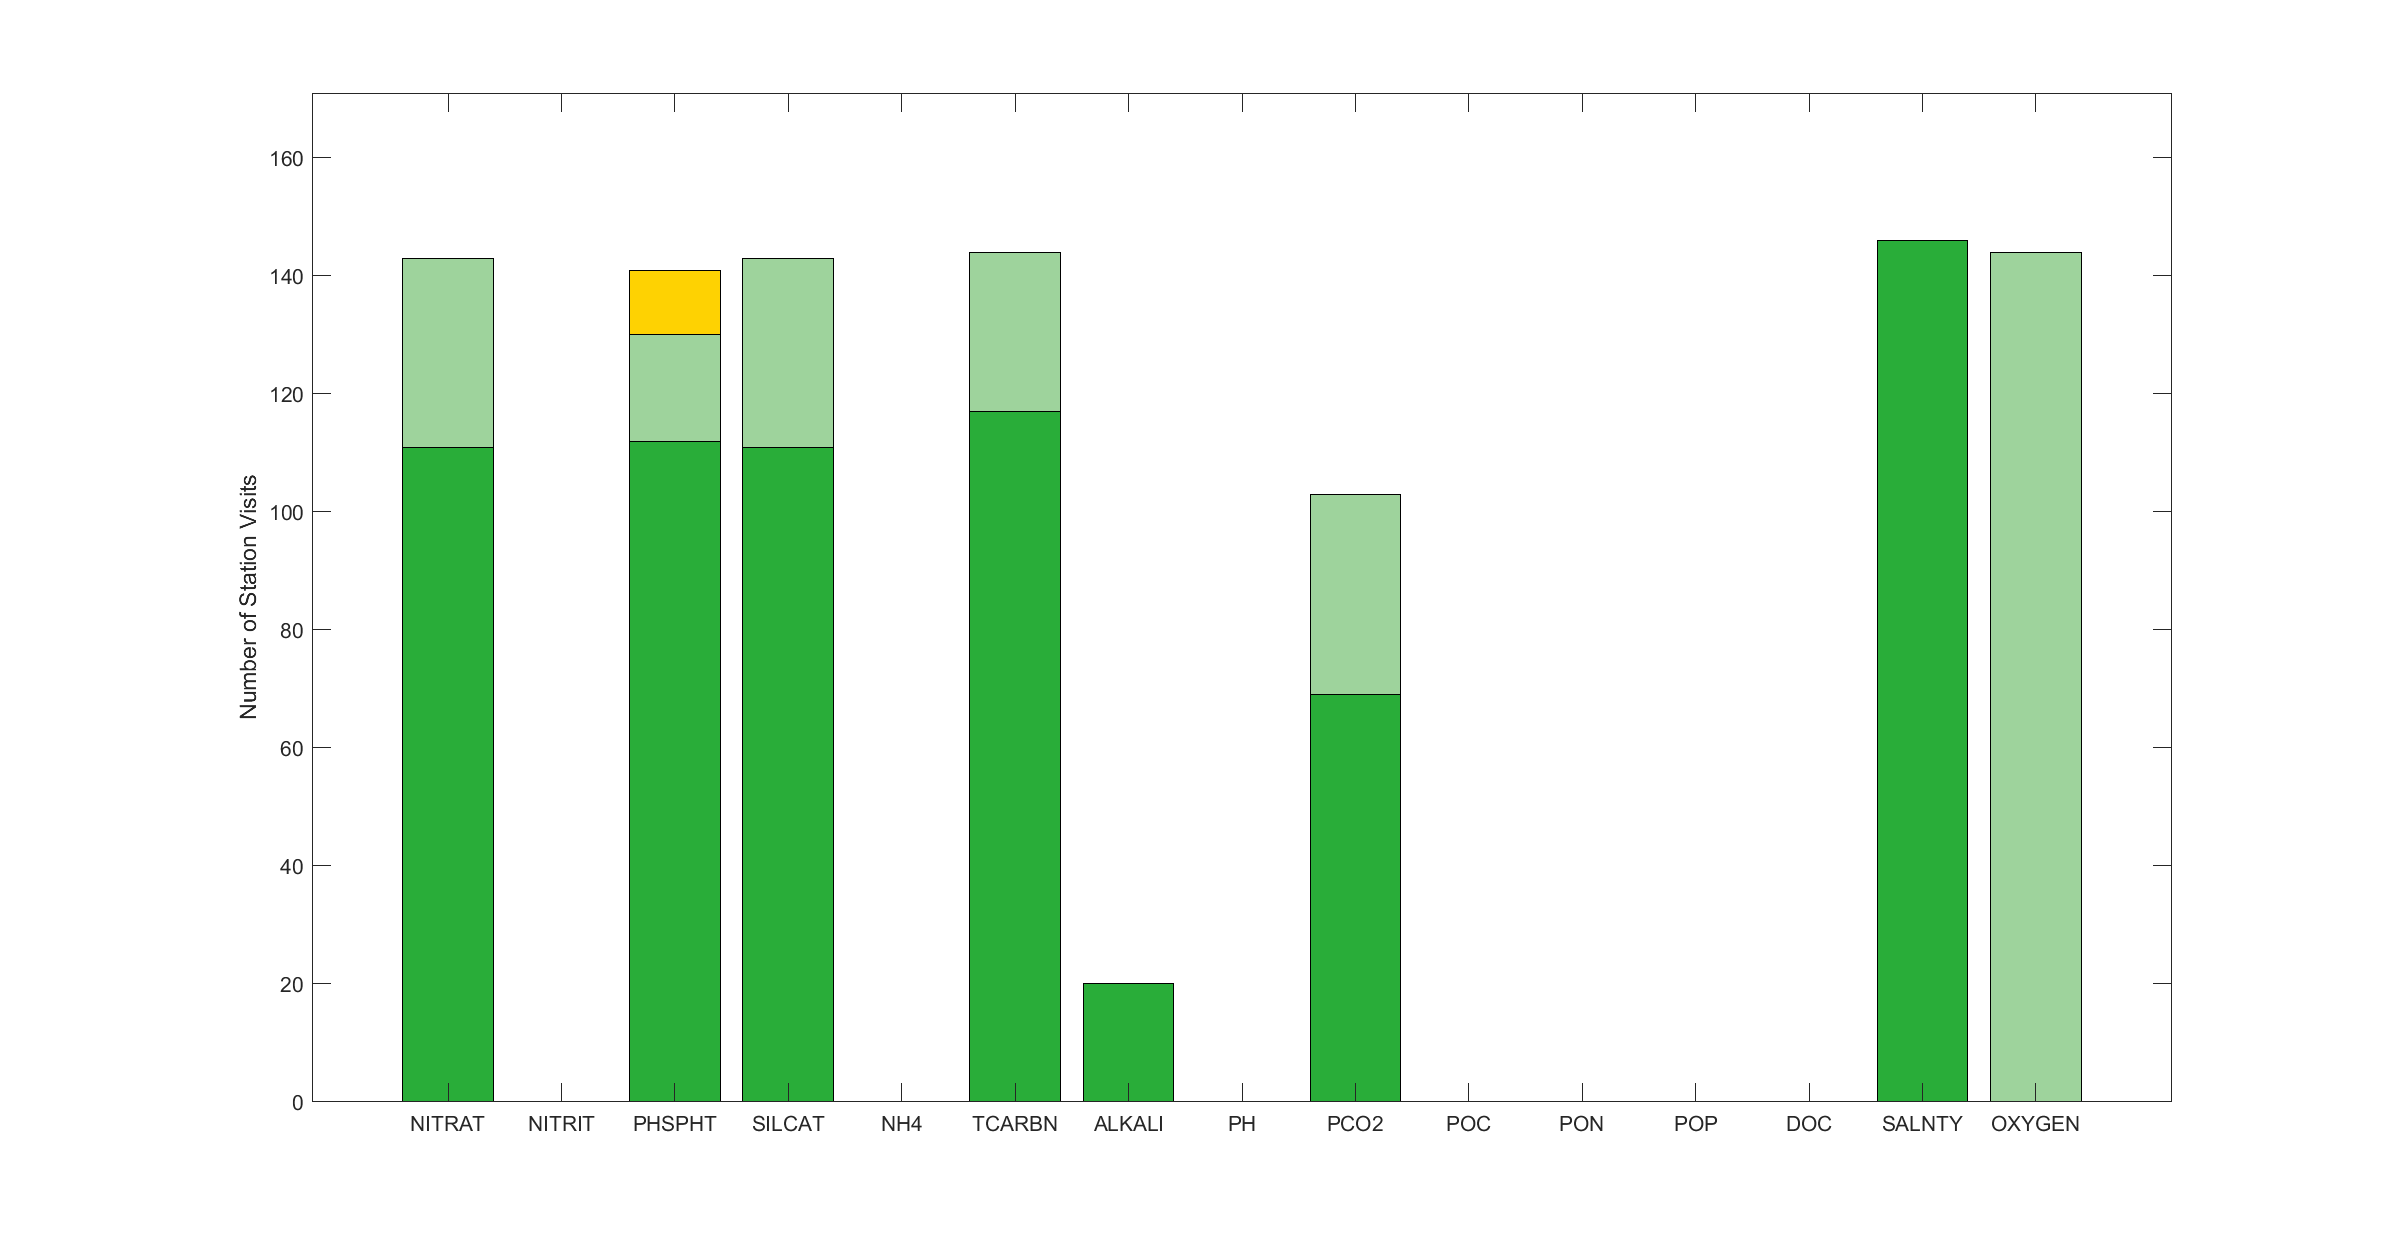
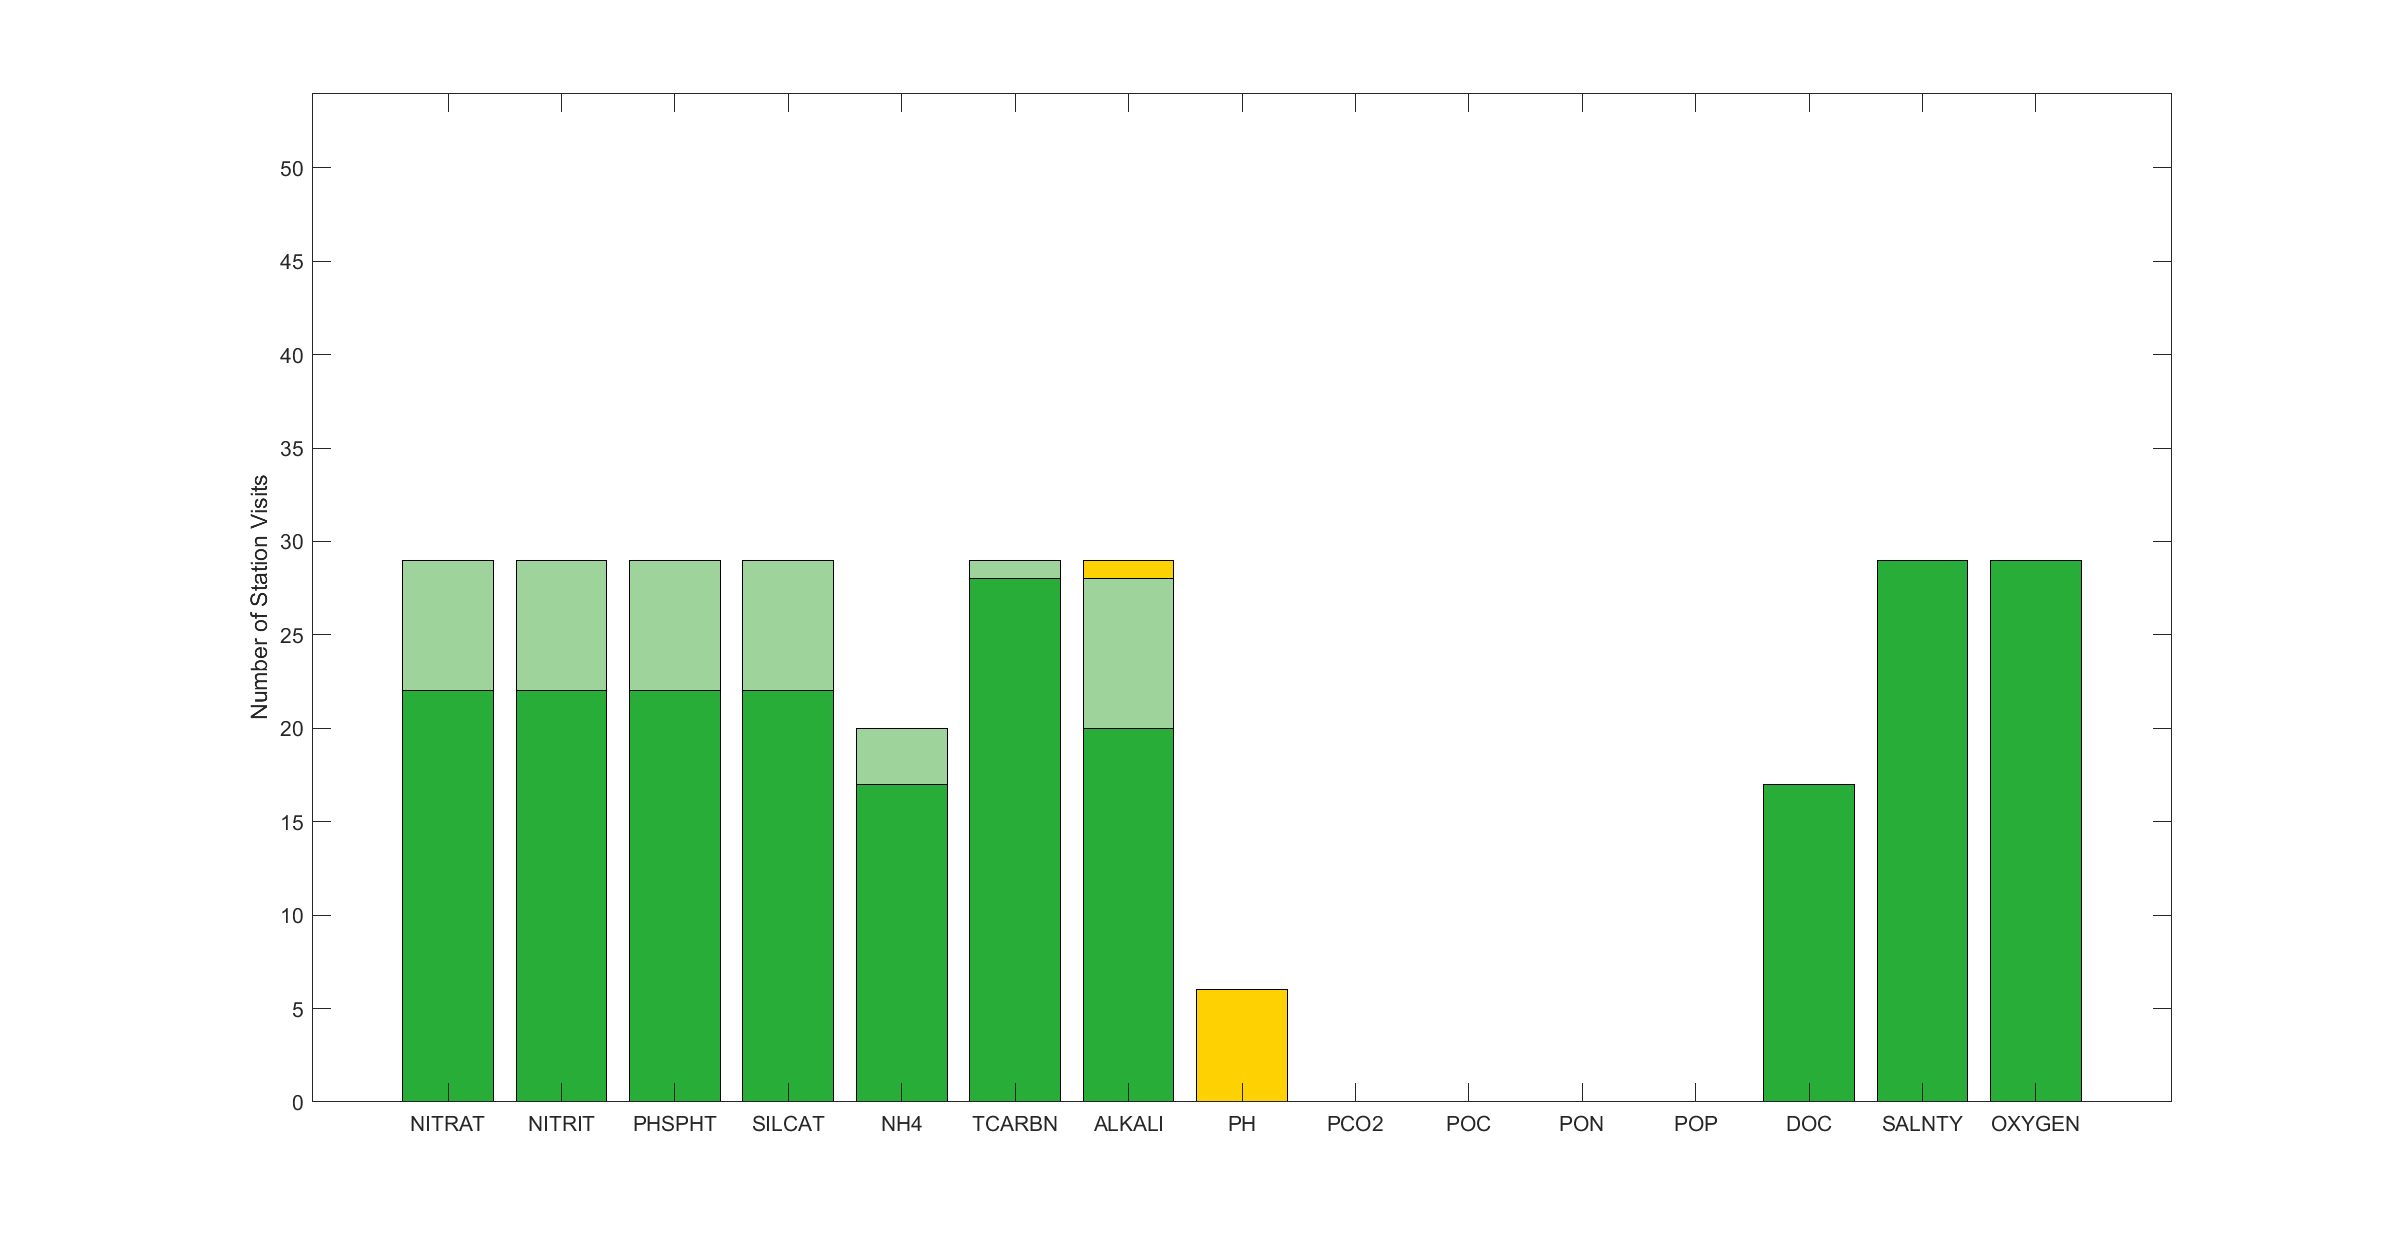
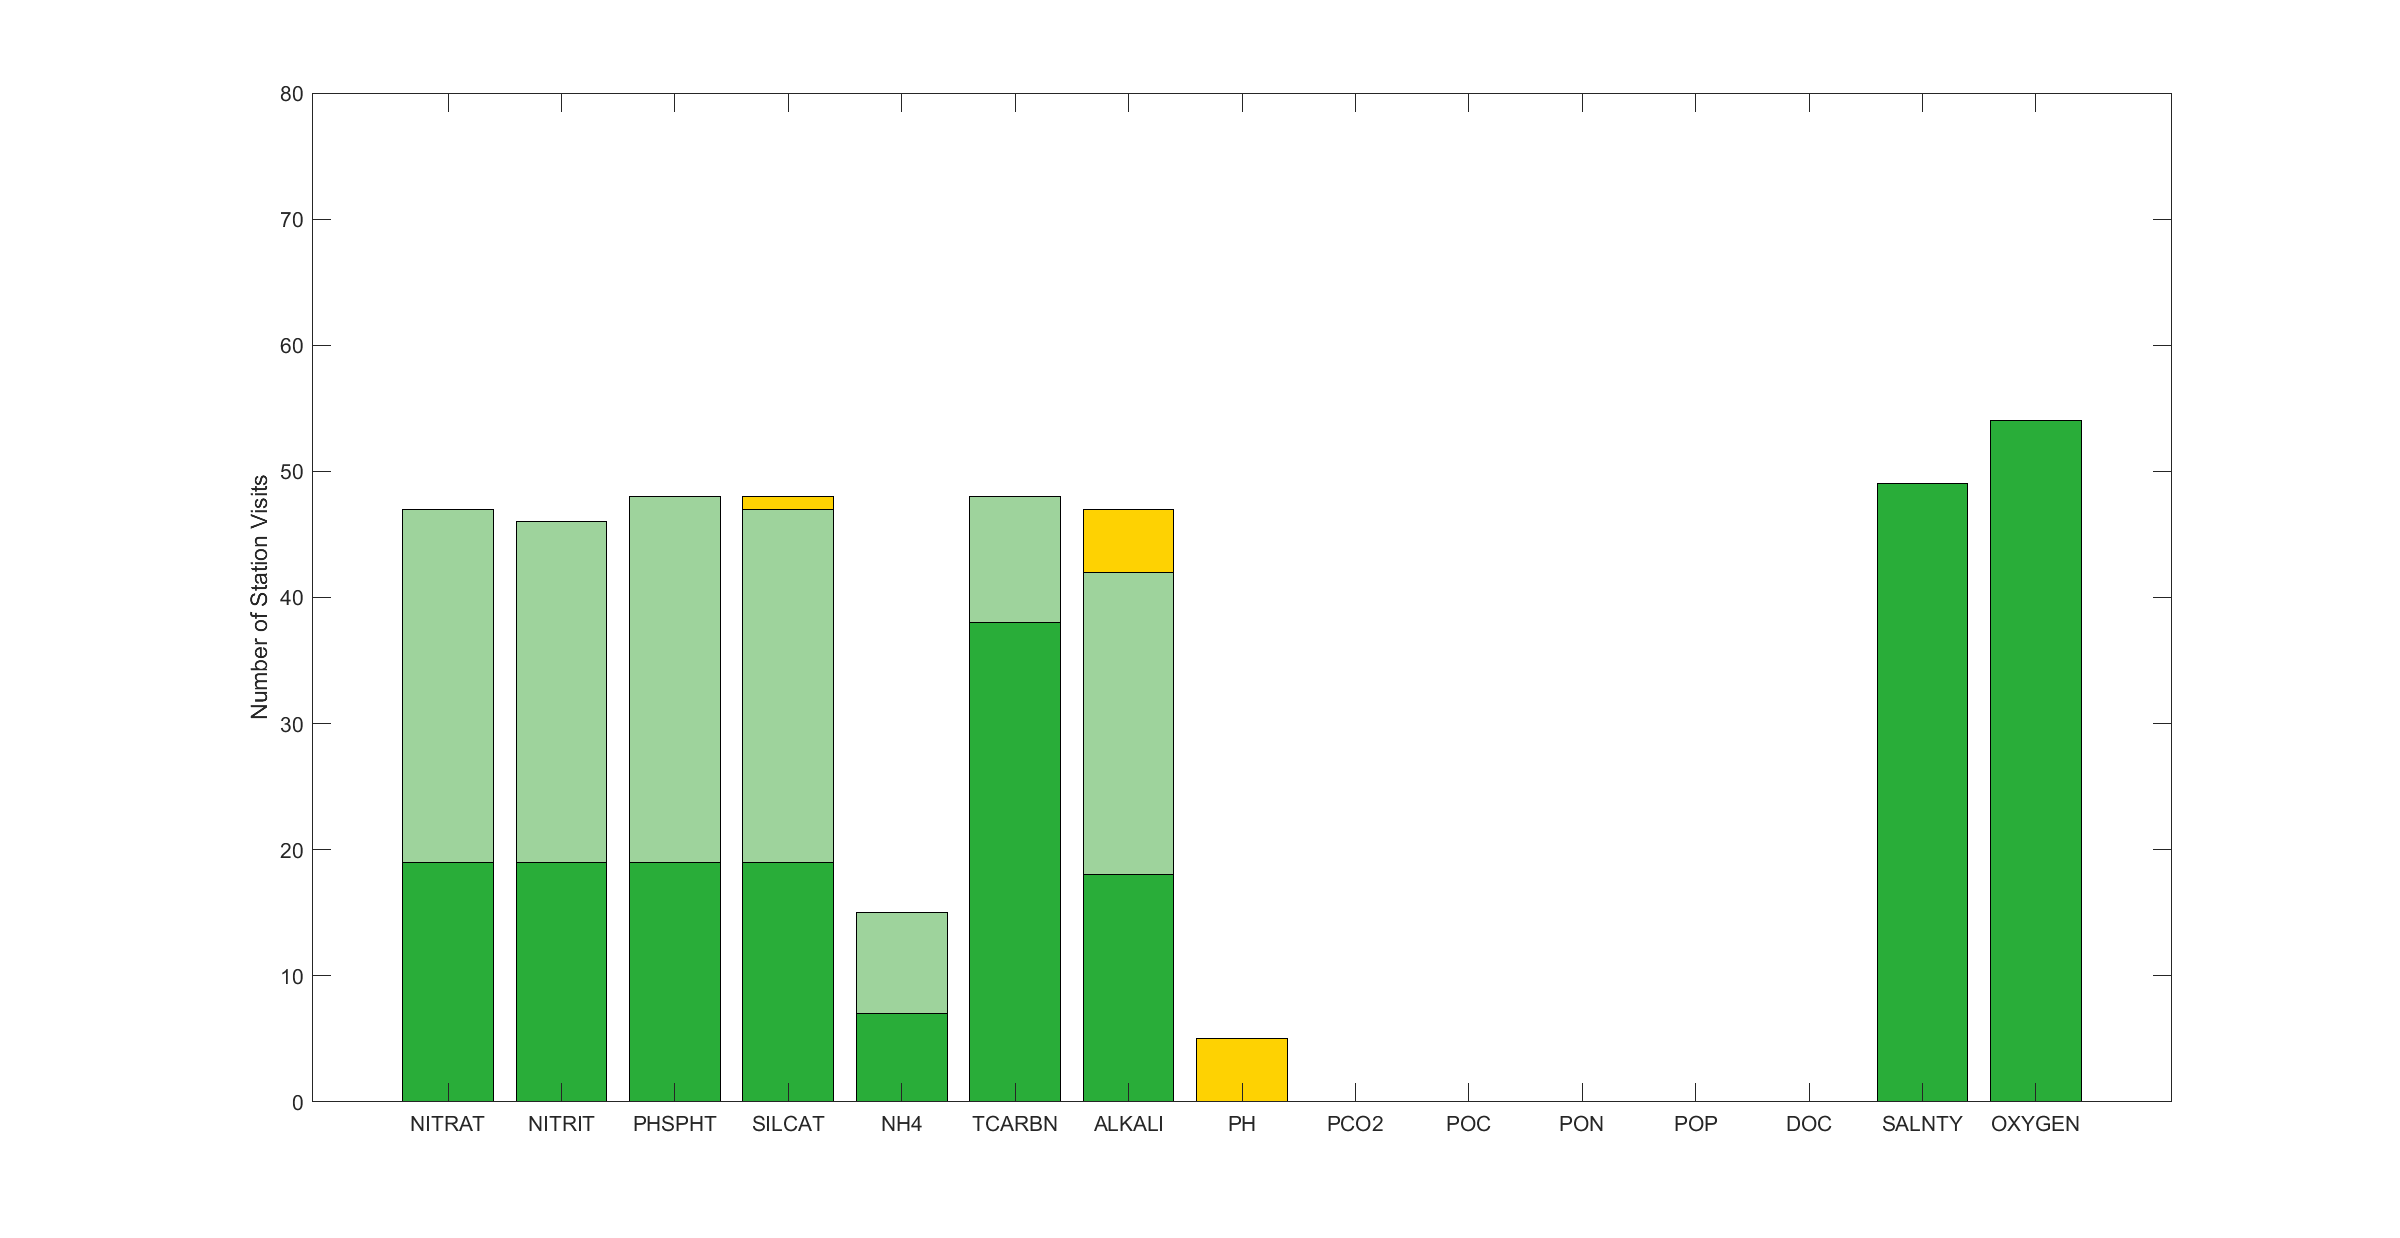
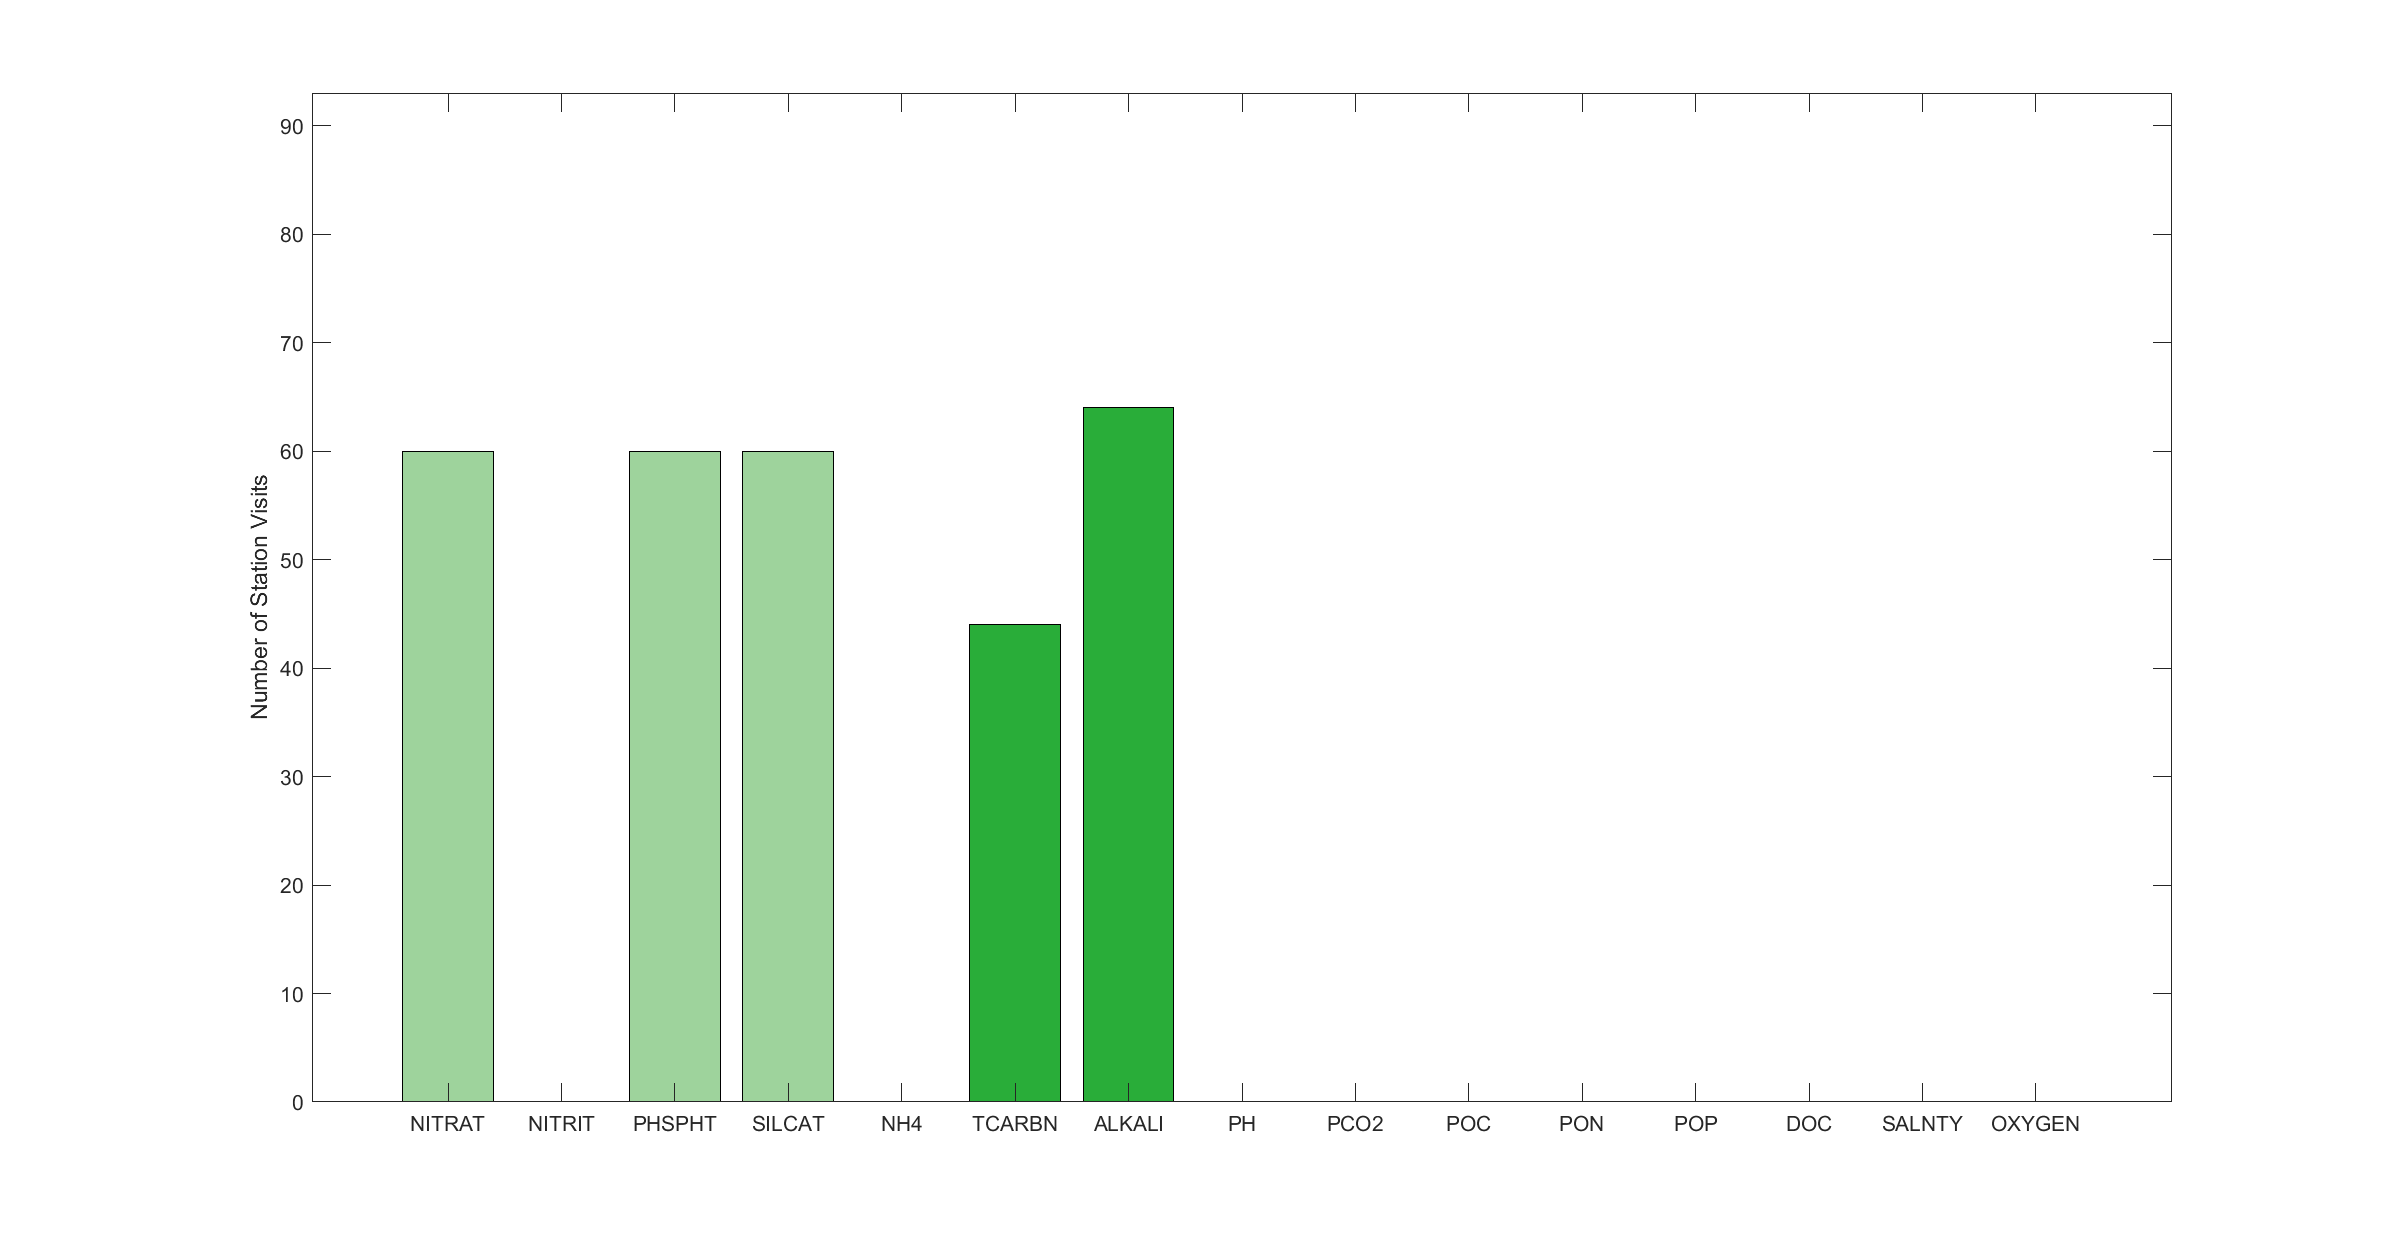
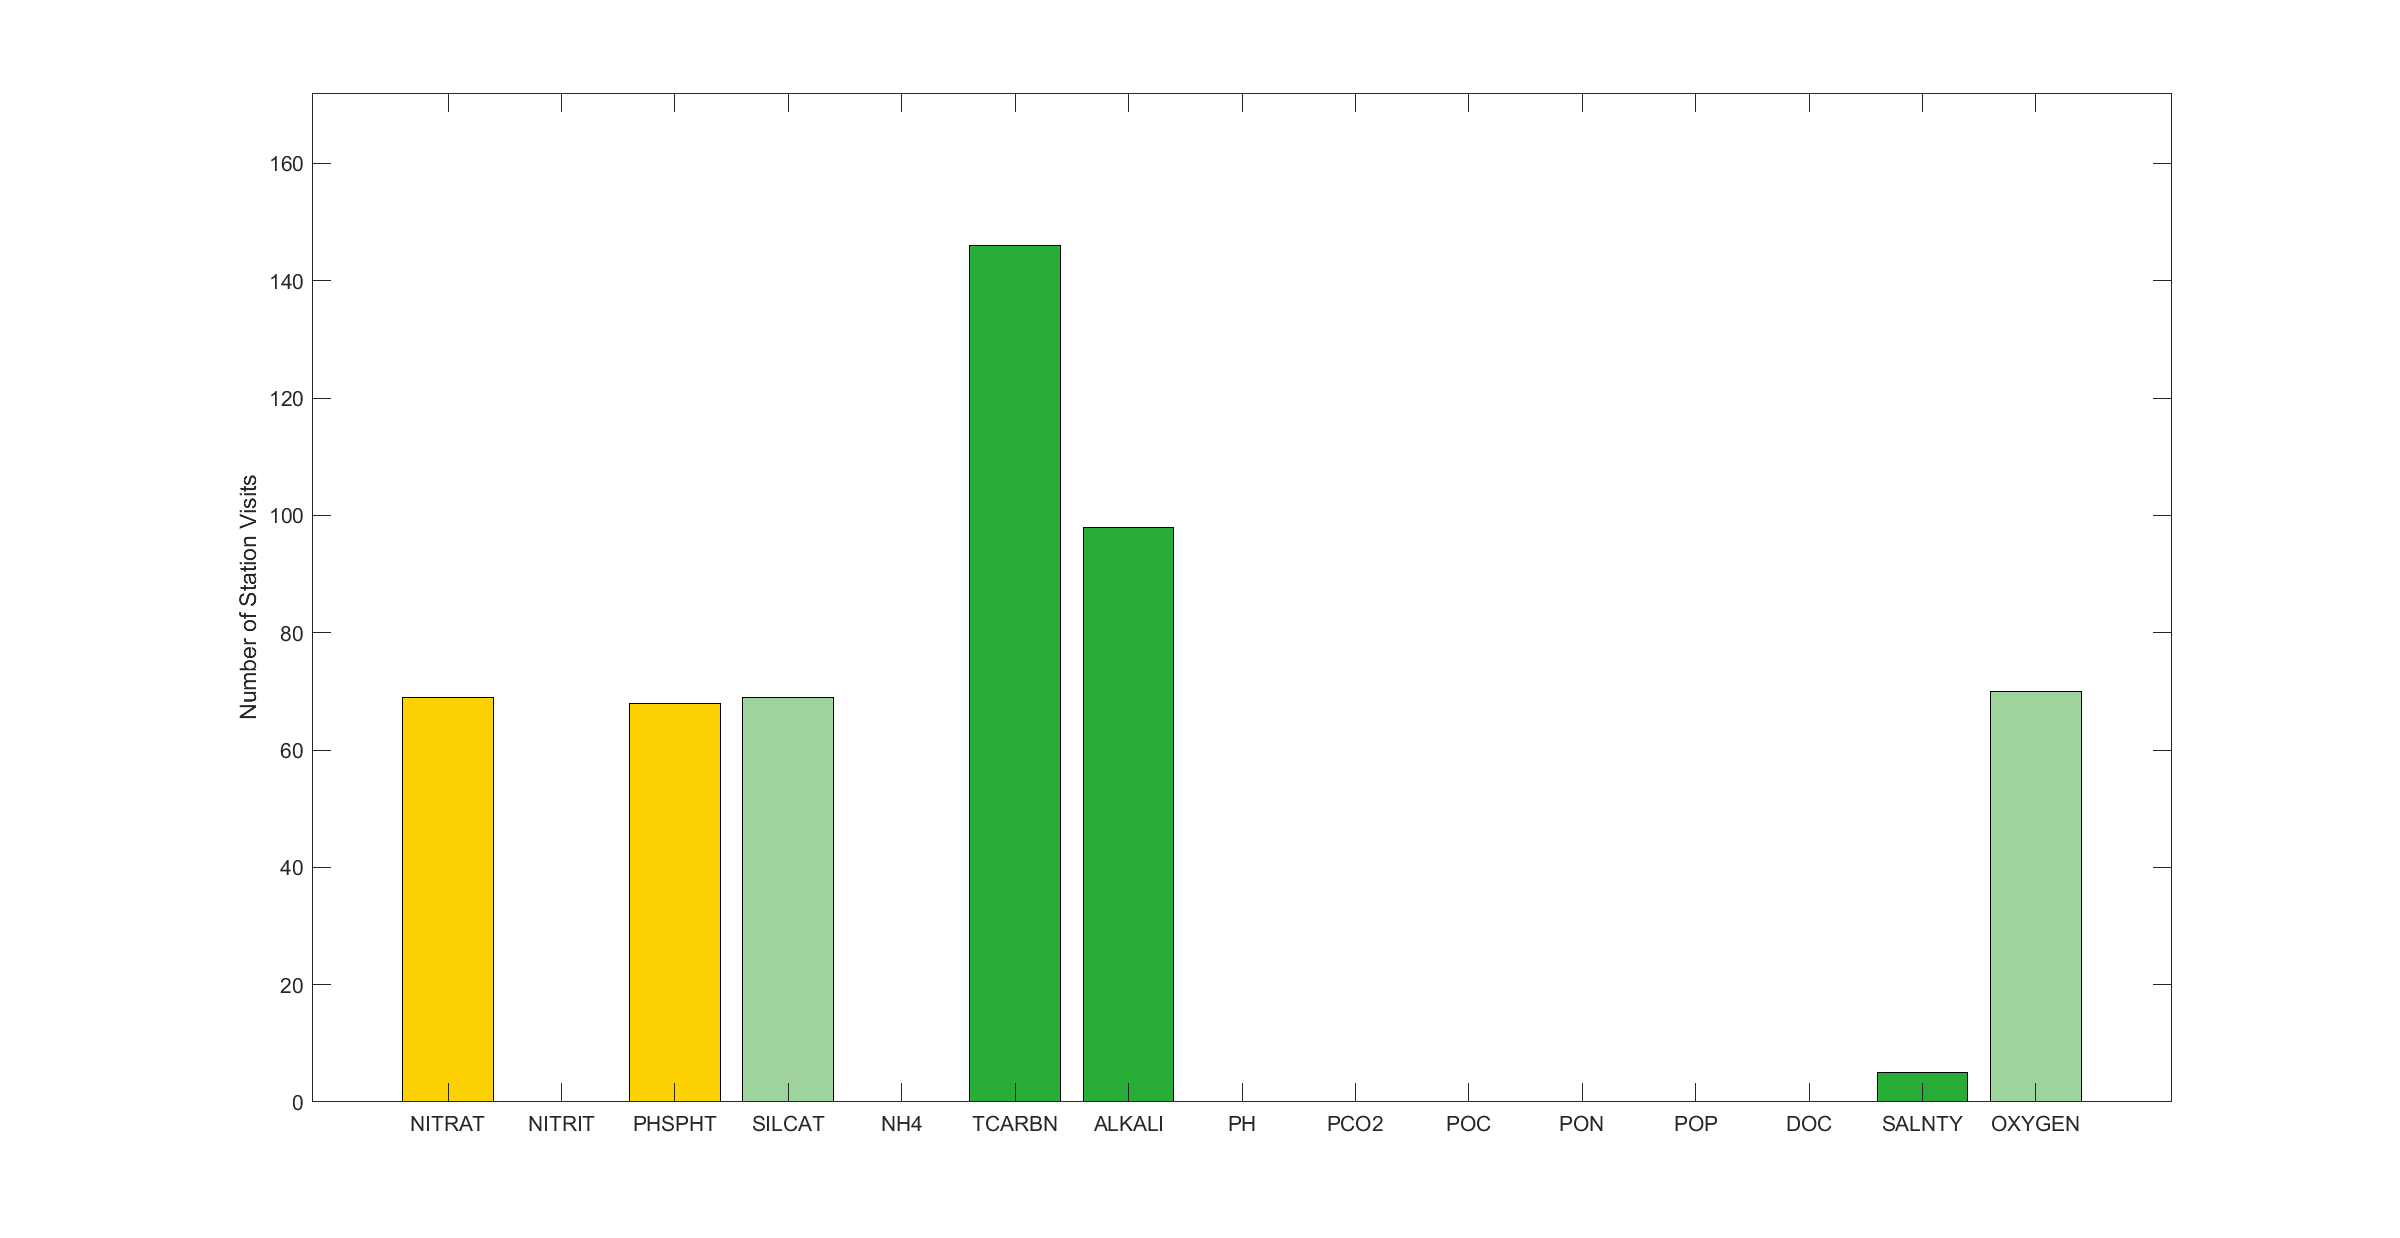
A qualitative assessment of how comparable data are within and across time-series is shown in the figures below. The colors indicate how methods for each variables compare to published Best Practices standard operating procedures, as evaluated using the information available with data sets.
CARIACO - Carbon Retention in a Colored Ocean
The CARIACO (CArbon Retention In A Colored Ocean) Ocean Time-Series project was established in the Cariaco Basin in November 1995 with support from the Venezuelan Fondo Nacional de Ciencia, Tecnologia e Investigacion (FONACIT) and the U.S. National Science Foundation (NSF). The Cariaco Basin is a semi-enclosed tectonic depression located on the continental shelf off northern Venezuela in the southern Caribbean Sea. It is composed of two ~1400m deep sub-basins that are connected to the Caribbean Sea by two ~140m deep channels. These channels allow for open exchange of near-surface water. The restricted circulation below the 140 m sill, coupled with highly productive surface waters due to seasonal wind-driven coastal upwelling (~450 gC m-2 yr-1 Muller-Karger et al., 2010), has led to sustained anoxia below ~250m. The goal of the project is to understand linkages between oceanographic processes and the production, remineralization and sinking flux of particulate matter in the Cariaco Basin, and how these change over time. It also aims at understanding climatic changes in the region, as well as in the Atlantic Ocean, and how variation in the processes are preserved in sediments accumulating in this anoxic basin. CARIACO conducts near-monthly cruises to the station (10 30 N; 64 40 W) to collect a core suite of biogeochemical and ecological samples. It also has [a] microbiology component which carries out specific bi-annual cruises, and a sediment trap mooring which collects particle fluxes bi-weekly at 5 depths from ~150m to ~1200m.
Muller-Karger, F. E., Varela, R., Thunell, R. C., Scranton, M. I., Taylor, G. T., Astor, Y., ... & Hu, C. (2010). The CARIACO oceanographic time series. Carbon and Nutrient Fluxes in Continental Margins: A Global Synthesis. JGOFS Continental.
Contact: Frank Muller Karger
IGMETS METABASE Explorer record
ODIS User Interface (coming ~2024)
CARIACO results of best practices assessment
CVOO - Cape Verde Ocean Observatory
CVOO stands for Cape Verde Ocean Observatory. It is part of the Cape Verde Observatory (17.6°N 24.3°W) which consists of operational atmosphere and ocean monitoring sites for various climate-relevant environmental parameters in the tropical Eastern North Atlantic Ocean about 400 nautical miles offshore of the western coast of Africa. The entire region, as many tropical areas, is data poor but plays a key role in air-sea interaction. The station has a bottom depth of 3600m and lies in the center of the Cape Verde Fontal Zone, resulting in large variations of the present oligotrophic water masses. The frontal zone separates most of the eastern tropical North Atlantic from the anticyclonic subtropical gyre system in the North Atlantic (Stramma et al., 2005). This further results in an ocean shadow zone and an oxygen-poor layer between 400m to 500m. Below the mixed layer, subtropical underwater from the subtropical gyre system, as well as North Atlantic Central Water and South Atlantic Central Water can be present (Tomczak 1981; Pastor et al., 2008).
Temperature, salinity, biological parameters, nutrients, dissolved carbon and oxygen are measured using the Cape Verdean research vessel Islandia that is equipped with state-of-the-art instruments to collect samples for marine parameters. An oceanographic long-term mooring is also part of the in-situ observations program, as well as novel observational platforms such as gliders or profiling floats that are used within the framework of various field studies at CVOO. Collected data is set into context of observations at the atmospheric site (CVAO) which measures meteorological parameters, greenhouse and short-lived gases, and aerosols. Linked data between both observatories provides highly valuable information about processes at the ocean-atmosphere interface. The combined observations aim at increasing data coverage in a key region for air-sea interaction. The irregular measurements at CVOO started in 2006 and are still ongoing and the project strives for more regular measurements in the future.
Contact: Björn Fiedler
IGMETS METABASE Explorer record
ODIS User Interface (coming ~2024)
CVOO results of best practices assessment
DYFAMED - Mediterranean Ocean Observing System for the Environment (MOOSE)
In the framework of the French MOOSE project (Mediterranean Ocean Observing System for the Environment), an eulerian time series so-called DYFAMED (Ligurian Sea) performs since 1991 a monthly multidisciplinary monitoring to observe: 1) the evolution of the water mass properties (LIW and WMDW), 2) the carbon export change and 3) the variability of the biological species relative to climate forcing (temperature, acidification).
In addition to monthly CTD profiles, a standalone mooring is located in the DYFAMED site with CTD and currents sensors (since 2009) and two sediment traps (Technicap PPS5) for collecting large particles and zooplankton every 15 days (48 samples per year).
Miquel, J.C., Martín, J., Gasser, B., Rodriguez-y-Baena, A., Toubal, T., Fowler, and S.W. 2011. Dynamics of particle flux and carbon export in the northwestern Mediterranean Sea: A two decade time-series study at the DYFAMED site. Progress In Oceanography, 73 91(4): 461-481
Contact: Laurent Coppola
IGMETS METABASE Explorer record
ODIS User Interface (coming ~2024)
DYFAMED results of best practices assessment
GIFT - Hydrographic and carbon system parameters in the Strait of Gibraltar
The GIFT time-series is an Eulerian observatory located along the longitudinal axis of the Strait of Gibraltar, the channel connecting the Mediterranean Sea and the Atlantic Ocean. The time series was established in 2005 with the aim to quantify the exchange of carbon between the two basins and assess the temporal evolution of biogeochemical fluxes. Over the years, observations at the GIFT have allowed to characterize the drivers for air-sea CO2 fluxes in the region (de la Paz et al., 2011), the exchange of both natural and anthropogenic carbon between the Mediterranean and the North Atlantic (Huertas et al., 2009; Flecha et al., 2012), the exchange of nutrients, methane, nitrous oxide and dissolved organic carbon (Huertas et al., 2012; de la Paz et al., 2015, Alvarez-Salgado et al., 2020) and the extent of ocean acidification and warming in major Atlantic and Mediterranean water masses (Flecha et al., 2015; 2019; García-Lafuente et al., 2021).
Monitoring at the GIFT is based on two pillars: a) Ship-based sampling for CTD casts (temperature, conductivity and pressure) and measurements of total alkalinity, pHT25, CH4, N2 O, dissolved oxygen, nutrients, chlorophyll and TOC/TON from surface water to the sea floor and b) moored sensors, as a long-term mooring line was deployed in 2011 at the westernmost sector of the Streait to record continuously temperature, conductivity, pH and pCO2 (SAMIs devices, Sunburst Sensors, LLC.) in the Mediterranean outflow.
The GIFT have been supported by the European projects CARBOOCEAN, CARBOCHANGE, SESAME, PERSEUS and COMFORT, the Spanish Ministry of Science through the grants CTM2005/01091-MAR and CTM2008-05680-C02-01 and the Junta de Andalucia through the TECADE project (PY20_00293).
Flecha, S., Pérez, F.F., Murata, A., Makaoui, A., and Huertas, I.E. 2019. Decadal acidification in Atlantic and Mediterranean water masses exchanging at the strait of Gibraltar. Scientific Reports, 9(1), 15533. DOI: 10.1038/s41598-019-52084-x
Contact: Emma Huertas
GIFT results of best practices assessment
Iceland Time-series and Irminger Time-series
In 1983 a study of the seasonal variability of carbon-nutrient chemistry was initiated off the Iceland shelf in two hydrographically different regions of the northern North Atlantic (Takahashi et al., 1985; Peng et al., 1987). One station was in the northern Irminger Sea (IRM-TS) with relatively warm and saline (S > 35) Modified North Atlantic Water derived from the North Atlantic Drift. This location may also be described as representing the subpolar gyre (Hat´ un et al., 2005b). The other station was in the Iceland Sea (IS-TS) where cold Arctic Intermediate Water, formed from Atlantic Water and low salinity Polar Water usually predominates but the Polar Water influence in the surface layers is variable (Stefansson, 1962; Hansen and Østerhus, 2000). Both stations are thus in regions important as sources for North Atlantic Deep Water (NADW). The original seasonal variability study was expanded in time and the sampling incorporated into the quarterly cruises of the repeat hydrography network of the Marine and Freshwater Research Institute (MFRI) in Iceland. Measurements include carbonate system parameters (dissolved inorganic carbon (DIC), alkalinity), as well as temperature, salinity, nutrients and oxygen. Surface layer measurements of chlorophyll-a concentrations and zooplankton biomass are done in spring. The time series observations have been carried out under the EC projects ESOP-2, TRACTOR, CARBOOCEAN and currently COMFORT.
Olafsson, J., Olafsdottir, S. R., Benoit-Cattin, A., and Takahashi, T. 2010. The Irminger Sea and the Iceland Sea time series measurements of sea water carbon and nutrient chemistry 1983–2008. Earth Syst. Sci. Data, 2, 99–104. DOI: 10.5194/essd-2-99-2010
Contact: Sólveig Rósa
NCEI Database records:
https://doi.org/10.25921/qhed-3h84
https://doi.org/10.3334/cdiac/otg.carina_icelandsea
https://doi.org/10.25921/vjmy-8h90
https://doi.org/10.3334/cdiac/otg.carina_irmingersea_v2
ODIS User Interface (coming ~2024)
Iceland Time-series results of best practices assessment
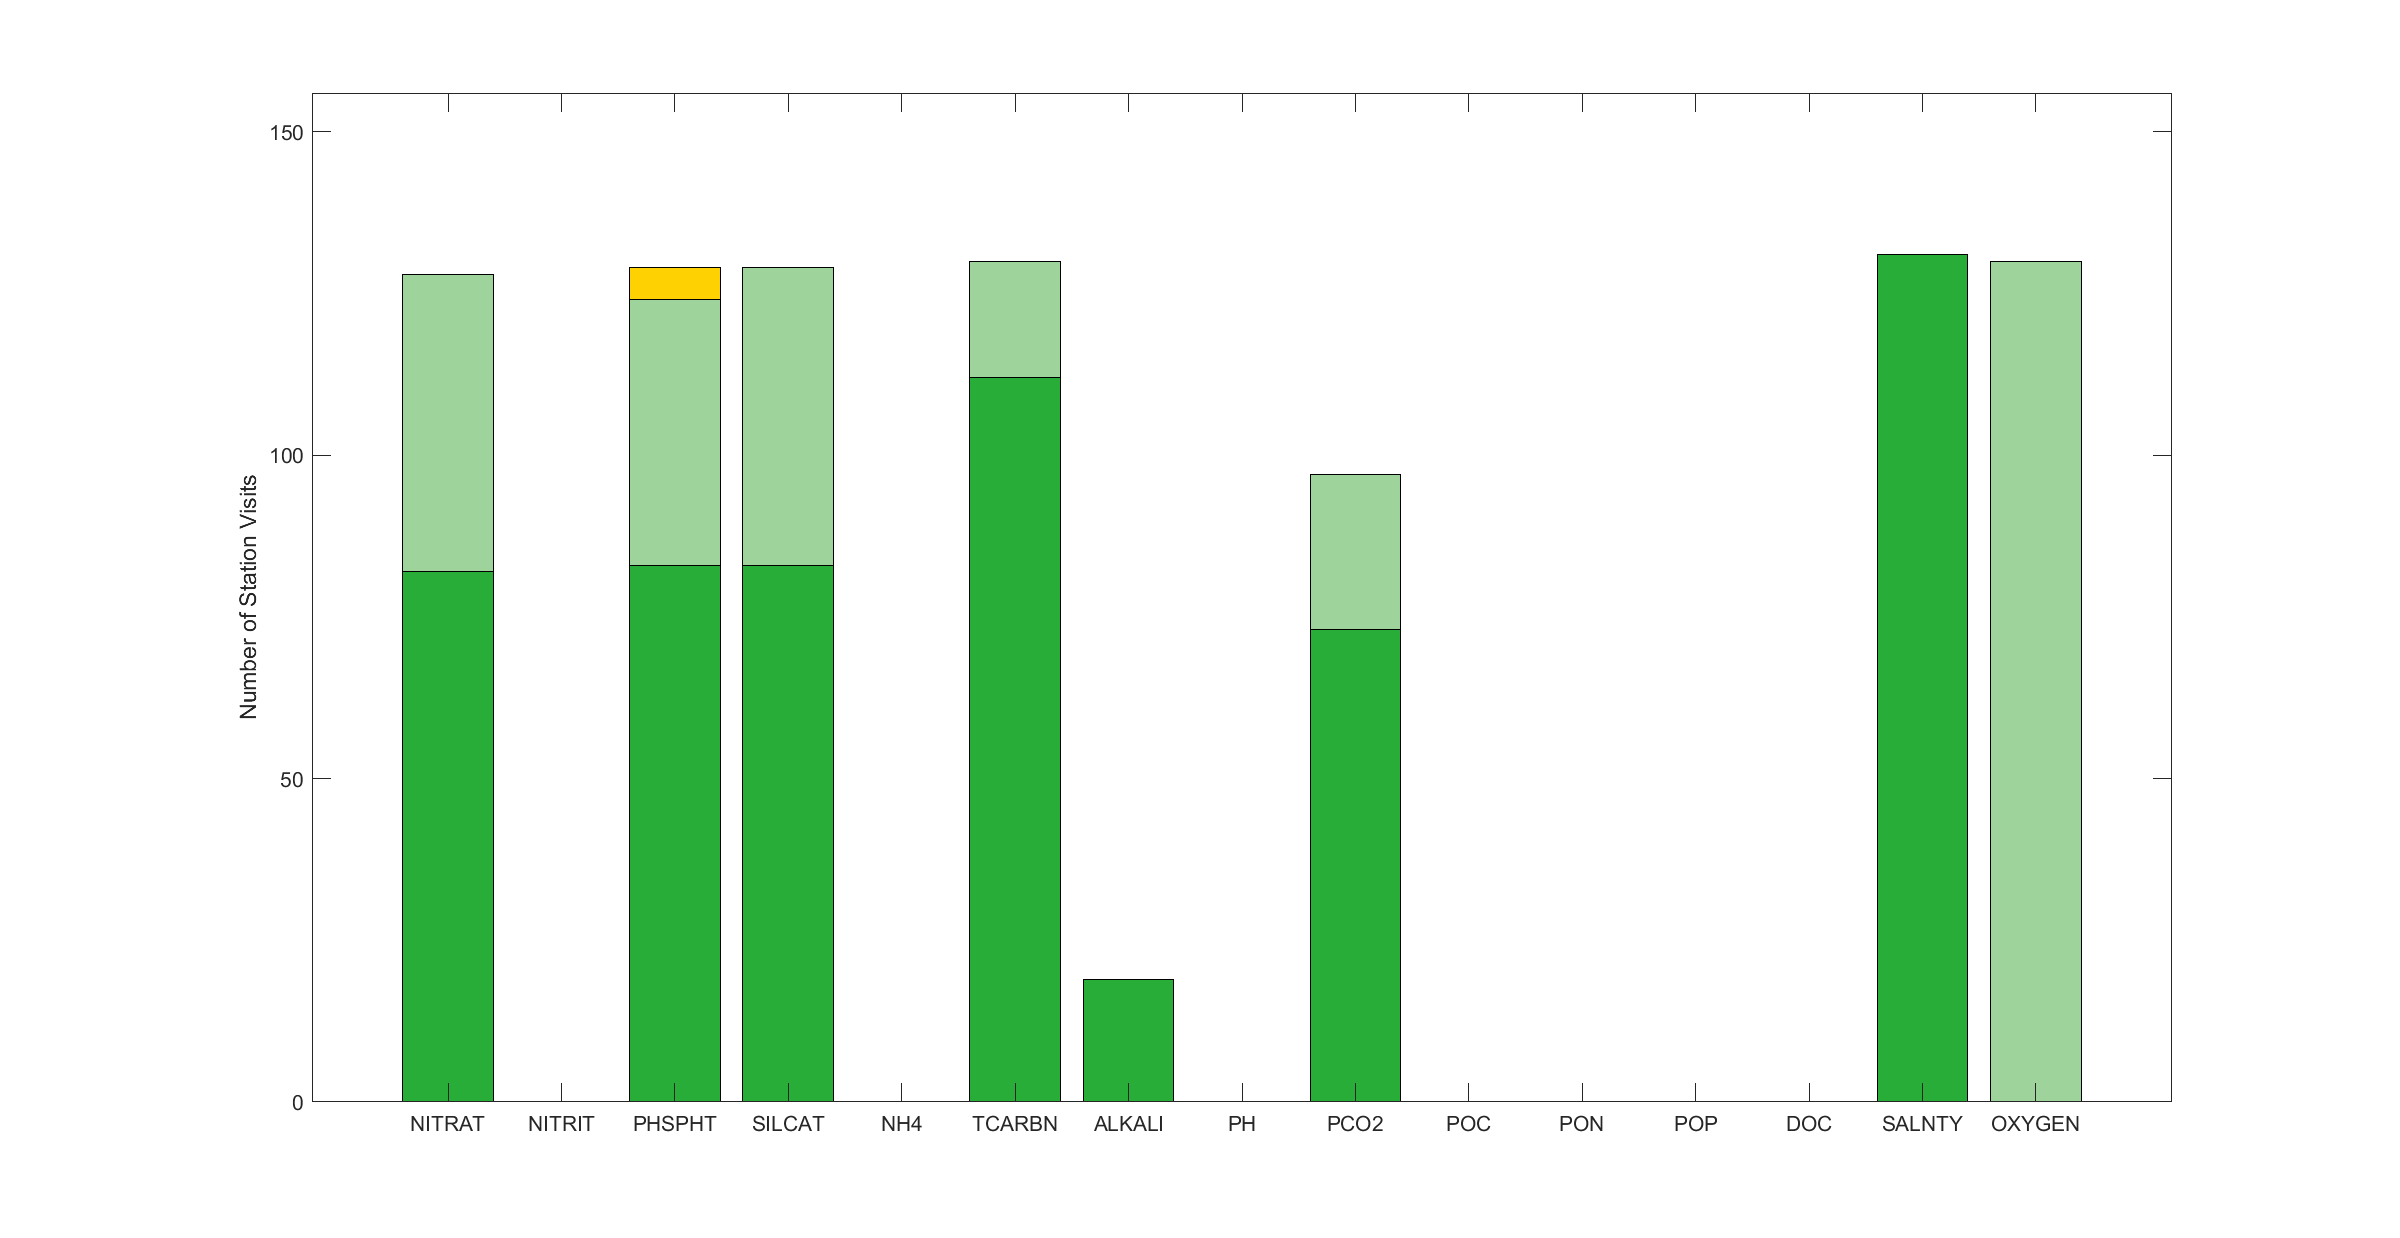
Irminger Time-series results of best practices assessment
K2
The K2 station is located approximately 400km northeast of Hokkaido Island, Japan, and in the subarctic western North Pacific lying offshore of the Oyashio current and just north of the Subpolar Front. Since 2001 near-monthly field observations are conducted to investigate the inorganic carbon system dynamics in response to variations in hydrography and biological processes. The overarching goal is to investigate the response of the biological pump to climate forcing in the western subarctic Pacific gyre. Measurements made, include carbonate system parameters, including dissolved inorganic carbon (DIC), alkalinity and the fugacity of carbon dioxide (fCO2) in surface waters, as well as temperature, salinity, nutrients and oxygen. The region is characterized by high primary productivity, abundant marine resources (FAO, 2016) and might be the first region of the ocean to become undersaturated with respect to CaCO3 in the winter (Orr et al., 2005). Seasonal cycles are present (e.g., Takahashi et al., 2006; Tsurushima et al., 2002; Wakita et al., 2013) with a highly productive biological pump from spring to fall and strong vertical mixing of deep waters, rich in dissolved inorganic carbon, in winter.
Wakita, M., Nagano, A., Fujiki, T., and Watanabe, S. 2017. Slow acidification of the winter mixed layer in the subarctic western North Pacific. Journal of Geophysical Research: Oceans, 122, 6923–6935. DOI: 10.1002/2017JC013002
Contact: Masahide Wakita
K2 Time-series results of best practices assessment
KNOT
The KNOT station is located at 44°N, 155°E, approximately 400 km northeast of Hokkaido Island, Japan in 4900 m of water, and is representative of the southwestern subarctic gyre lying offshore of the Oyashio current and just north of the Subpolar Front. KNOT field sampling was done from June 1998 to October 2000, after a previous (1988–1991) sediment trap experiment at the same location. Approximately monthly field observations are conducted to investigate the inorganic carbon system dynamics in response to variations in hydrography and biological processes, to investigate the response of the biological pump to climate forcing and to provide a data set from the western subarctic Pacific gyre for comparison to OSP in the eastern subarctic Pacific gyre. Measurements made include carbonate system parameters, including dissolved inorganic carbon (DIC), alkalinity and the fugacity of carbon dioxide (fCO2) in surface waters, as well as temperature, salinity, nutrients and oxygen. Surface layer measurements of biological activity, including chlorophyll-a concentrations and primary productivity, are also made on nearly every cruise, along with collections of phyto- and zoo-plankton. The region is characterized by high primary productivity, abundant marine resources (FAO, 2016) and might be the first region of the ocean to become undersaturated with respect to CaCO3 in the winter (Orr et al., 2005). Seasonal cycles are present (e.g., Takahashi et al., 2006; Tsurushima et al., 2002; Wakita et al., 2013) with a highly productive biological pump from spring to fall and strong vertical mixing of deep waters, rich in dissolved inorganic carbon, in winter.
Wakita, M., Nagano, A., Fujiki, T., and Watanabe, S. 2017. Slow acidification of the winter mixed layer in the subarctic western North Pacific. Journal of Geophysical Research: Oceans, 122, 6923–6935. DOI: 10.1002/2017JC013002
Contact: Masahide Wakita
KNOT Time-series results of best practices assessment
MOTS - Munida Microbial Observatory Time-series
The Munida Time Series is a surface transect extending 65 km off the south east coast of New Zealand, and includes neritic, modified subtropical and sub-antarctic surface waters (SASW). The time series was established in 1998 to study the role of these waters in the uptake of atmospheric carbon dioxide, and the seasonal, interannual and long-term changes of the carbonate chemistry. Cruises take place every two months and consist of surface measurements plus a depth station in SASW. All water masses are a sink for atmospheric carbon dioxide (Currie et al., 2011), the seasonal cycles of DIC are primarily driven by net community production (Brix et al, 2013; Jones et al. 2013) with modification by the annual cycle of sea surface temperature. Aspects of trace metal chemistry, nitrogen cycling and bacterial production have been studied on a shorter-term basis, embedded within the main programme.
Currie, K.I., Reid, M.R., and Hunter, K.A. 2011. Interannual variability of carbon dioxide draw-down by subantarctic surface water near New Zealand. Biogeochemistry 104:23–34. DOI: 10.1007/s10533-009-9355-3
Wakita, M., Nagano, A., Fujiki, T., and Watanabe, S. 2017. Slow acidification of the winter mixed layer in the subarctic western North Pacific. Journal of Geophysical Research: Oceans, 122, 6923–6935. DOI: 10.1002/2017JC013002
Contact: Kim Currie
ODIS User Interface (coming ~2024)
MOTS Time-series results of best practices assessment
OWSM - Ocean Weather Station Mike
The Ocean Weather Station Mike (OWSM) started in 1948 as one of 13 weather station in the North Atlantic, and the primary aim was to improve the weather forecasts to assist the increasing air traffic after the Second World War. Carbonate chemistry measurements started in 2001 with the aim of monitoring long-term changes of the biogeochemistry. OWSM is located at the western branch of the northwards flowing Norwegian Atlantic Water where the water depth is 2100 m. Between 2001 and 2009, the station was sampled monthly and since 2010, the sampling frequency has been 4-6 times per year. The site encompasses the cold Norwegian Sea Deep Water and the Arctic Intermediate Water in addition to the relatively warm and saline Atlantic Water. Occasionally during late summer, fresh Norwegian Coastal Water is meandering all the way out to OWSM influencing the surface water at the site. Seasonal variability is observed in the uppermont 200 m or so and long term trends of carbonate variables are now seen at all water depths. Over time, the surface water CO2 content at OWSM is increasing slightly stronger compared to the observed atmospheric CO2 increase at the site (Skjelvan et al., 2022).
A variety of other variables exist from the site, e.g. discrete dissolved oxygen from 1953-2009, nutrients since 1993, atmospheric flask CO2 between 1981 and 2009, and surface ocean and atmospheric pCO2 between 2006 and 2021.
Skjelvan, I., Falck, E., Rey, F., and Kringstad, S.B. 2008. Inorganic carbon time series at Ocean Weather Station M in the Norwegian Sea. Biogeosciences, 5, 549–560. DOI: 10.5194/bg-5-549-2008
Contact: Ingunn Skjelvan
ODIS User Interface (coming ~2024)
OWSM Time-series results of best practices assessment
RADCOR - RADIALES (Instituto Español de Oceanografía) Time-series Program
RADCOR stands for the A Coruña section within the time-series program RADIALES (Instituto Español de Oceanografía). The overarching RADIALES program started in 1989 aiming to obtain reliable baselines for long-term studies on climate change, and ecosystem dynamics in times of increasing anthropogenic disturbances in the northern and northwest Spanish coast (Valdés et al., 2021). The program consists on monthly multidisciplinary perpendicular sections covering the Cantabrian Sea and northwest coastal and neritic Spanish ocean. The RADCOR section started in 1990 and CO2 variables were incorporated since 2013 in three stations located off the northwest Iberian coast. Biological variables such as phyto-, micro- and zooplankton abundance and diversity along with primary production are also monitored.
The station that is located farthest offshore is E2CO (43.42°N 8.44°W) and the closest to the coast is E4CO (43.36°N 8.37°W). RADCOR locates on the northern edge of the Iberian Upwelling Region. Here the classical pattern of seasonal stratification of the water column in temperate regions is masked by upwelling events from May to September. These upwelling events provide nutrients to support both primary and secondary production in summer. Nevertheless, upwelling is highly variable in intensity and frequency, demonstrating substantial year-to-year variability, mostly affecting E2CO station (80 m) while the closest to shore E4CO (15m) is mostly affected by estuarine and benthic processes.
The RADIALES program started in 1989 aiming to obtain reliable baselines for long-term studies on climate change and ecosystem dynamics in times of increasing anthropogenic disturbances along the northern and northwestern Spanish coasts (Valdés et al., 2021). The program consists of monthly multidisciplinary perpendicular sections covering the Cantabrian Sea and northwest coastal and neritic Spanish ocean. The A Coruña (NW Galician coast) section (RADIALES A Coruña, RADCOR in brief) started in 1990 (Bode et al., 2020) and CO2 variables have been incorporated since 2013 in two stations, E2CO and E4CO. RADCOR is located on the northern edge of the Iberian Upwelling Region. Here, the classical pattern of seasonal stratification of the water column in temperate regions is masked by upwelling events from May to September. These upwelling events provide nutrients to support both primary and secondary production in summer. Nevertheless, upwelling is highly variable in intensity and frequency, demonstrating substantial interannual variability, mostly affecting the E2CO station (80 m), while the station closest to shore, E4CO (15 m), is more impacted by estuarine and benthic processes. The CO2 chemistry and ancillary data were partially published in Guallart et al. (2022) to assess the reliability of directly measuring with a spectrophotometric method seawater ion carbonate in time-series.
Acknowledgements: The RADIALES program is a structural program funded by Centro Nacional Instituto Español de Oceanografía (IEO-CSIC).
Contact Marta Alvarez: marta.alvarez@ieo.csic.es
Website RADIALES: https://www.seriestemporales-ieo.net/
Valdés, L., Bode, A., Latasa, M., Nogueira, E., Somavilla, R., Varela, M.M., González-Pola, C., and Casas, G. 2021. Three decades of continuous ocean observations in North Atlantic Spanish waters: The RADIALES time series project, context, achievements and challenges. Progress in Oceanography, Volume 198,2021, 102671. ISSN 0079-6611. DOI: 10.1016/j.pocean.2021.102671
Extra references:
Elisa F. Guallart*, Noelia M. Fajar, Maribel I. García-Ibáñez, Mónica Castaño-Carrera, Rocío Santiago-Doménech, Abed El Rahman Hassoun, Fiz F. Pérez, Regina A. Easley, and Marta Álvarez. Spectrophotometric Measurement of Carbonate Ion in Seawater over a Decade: Dealing with Inconsistencies. Environmental Science & Technology 2022 56 (12), 7381-7395.
Bode, Antonio; Álvarez, Marta; Castaño, Mónica; García, Luz; Louro, M Ángeles; Nieto-Cid, Mar; Ruiz-Villarreal, Manuel; Varela, Marta M (2020): Time series of hydrographic, chemical and primary production variables for a shelf station off A Coruña (NW Spain): 2017-2018. PANGAEA.
No NCEI data link (non existent)
ODIS User Interface (coming ~2024)
RADCOR Time-series results of best practices assessment
