SEDCORE 2000
SEDCORE 2000 is a comprehensive search software and was created to allow you to explore our sea floor samples collection and data related to the sample inventory.
Learn more about SEDCORE with the tutorial below.
*This platform is no longer supported and is only accessible to those with WHOI credentials via VPN.*
Tutorial
The SC2K Window
There are 3 main zones in the SC2K window:
- The horizontal tool bar across the top of the window.
For general information about the tools, visit the Help site. Special capabilities and functions of the tools will be described below. - The vertical array of fields or categories on the left side of the window.
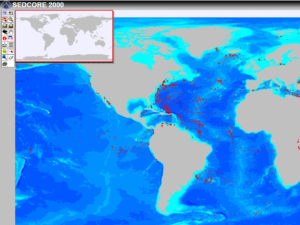
- The Map Window.
Read more
Manipulating any of the buttons on the toolbar, or varying the 'active' fields will change what you see in the map window.
The map window will initially display a 'geographic' projection of the world. Select the type of station data you wish to search or browse from the list of fields to the left of the map window. It is not necessary, but strongly recommended that you restrict your exploring to one major field at a time. This will expedite your search and of course your results will be field specific.
“FIELDS”
-
- CORES: This data subset includes all the sediment cores in the Woods Hole collection. You may select and sort them by a specific device type as your search session proceeds.
- DREDGES & GRABS: This suite includes samples collected by many different types of dredges and grab samplers. These are principally hard rock samples, and samples of coarse seabed lithologies, but may also include stations that contain some fine grained sediments.
- SUBMERSIBLES: All samples in the collection recovered by Alvin and other DSRV's.
- DREDGE ANALYSIS: In addition to station data about dredges and grabs this field contains digitized descriptive summaries of the major lithologies contained within the dredges and grabs. Most of the descriptive information will appear in abbreviated alpha-numeric code on the listing produced. However, where hypertexted [blue] these codes can be readily translated by clicking for pop-up screens of expanded information. Click on the icon for the SC2000 code/definition tables
 How you select and browse the samples in the device specific fields will depend on your search criteria. If your needs involve a specific region of the world ocean, you can use these Zoom and Pan tools to navigate to the area you require.
Once you have selected a field or category of samples you may search and identify the samples in that portion of the database in a variety of ways.
-
- The simplest way to see more information about a plotted symbol [note the types of symbols linked to each field or category of samples in the list on the left side of the main window.] which indicates the location of a sample is to select the IDENTIFY tool:

- The simplest way to see more information about a plotted symbol [note the types of symbols linked to each field or category of samples in the list on the left side of the main window.] which indicates the location of a sample is to select the IDENTIFY tool:
Click this item on the tool bar then click the symbol on the map that you'd like more information about. The sample will be highlighted on the map, and a new screen will follow showing a list of detailed station parameters. This list and all detailed lists produced by other search tools are printable for your records. The format of the list will be different for each category of samples. Any coded or abbreviated data in the fields can be translated by referring to the corresponding help file invoked by clicking: 
and then the definition table hypertext. If you are browsing cores in the collection, you may view or print the lithologic log and smear slide analysis if the IMAGE field at the bottom of the list reads YES. The core description images are in Adobe PDF format and clicking the hypertext will automatically invoke the Acrobat reader necessary for viewing the file if the reader is installed on your computer. You can download a free version of the Adobe Acrobat reader or return to the lab home page and locate the Adobe Icon.
-
- If you would like to view details of samples in a region defined by a circle around a particular spot on the globe go to the tool bar and select the CIRCLE tool:

- If you would like to view details of samples in a region defined by a circle around a particular spot on the globe go to the tool bar and select the CIRCLE tool:
Return to the map and click on the desired spot or symbol. A box will pop up requesting that you enter the radius you require in Nautical Miles. [Note: If you enter a very large radius, the generation of the sample details list may take a little while. Please be patient.] The samples that fall in your specified circle will be highlighted on the map and the detailed list will follow on a new page. Clicking on any data shown in hypertext [blue] on the list will produce further information. If you click on the Cruise number, a plot of all the samples taken on that particular leg of an expedition will be displayed. Click the PHY [Physiographic Province] digit to see a list for code translation. If you're searching the Dredge Analysis category where sample descriptions are summarized [6 columns of data], clicking the Alpha or Numeric code will produce a translation aid that will also identify the column heading code.
-
- The SELECT tool:

- The SELECT tool:
produces exactly the same lists and formats as the circle tool but operates in a different manner. Once you have clicked the select tool icon on the toolbar, you can inscribe a square or rectangular box on the map that contains the samples you wish to identify. To make the box, click once on the map to select a corner then drag the mouse to shape your box and click again.
-
- The most capable of all the search tools is the QUERY BUILDER:

- The most capable of all the search tools is the QUERY BUILDER:
With this tool you can search by specific "fields" within a category and then by "values" in that field that you either select from the list or specify. For instance you can create a simple query to find all gravity cores in the entire collection. However if you were interested in gravity cores that were taken in water depths greater than 3500 meters, you can simply add this qualifying parameter to your initial formula and create a slightly more complex 'recipe'. The current version of query builder that we have online has a little bug in it that we hope will be fixed [by ESRI] very soon. It's a syntax problem and we know how everyone loves computer sensitivity to SYNTAX! The problem occurs only if you're trying to build a complex query by 'double-clicking' values in the lists presented. If you follow the simple rules below building a proper query should be easy.
-
- Click on the hammer to pop up the Query a Layer window.
- Select a sample type. This will produce a list of fields which you can use to create your query.
- If you have a simple query like "all cores taken from the Atlantis II" you can compose this by choosing cores as your sample type then double clicking SHIP, double clicking = , click Get Values, double click AII from the Values list below then click OK. The results window will pop up [again this may not be instantaneous] and the samples that meet your criteria will be highlighted on the map. As before you can get more elaborate information by clicking on hypertexted values on the 'results' list. Note that the proper SYNTAX for the query formula is:
([FIELD] LOGICAL CONDITION VALUE)
Examples:
([Device] = "GGC")
The presence and spacing of the round and square brackets is critical for proper formula building.
-
- If you need to compose a more complex query formula, you'll have to type into the box manually. The bug mentioned above creates a slight format glitch if you try to double click entire complex formulas. Composing a compound query is not difficult. Just follow the examples below:
SAMPLE TYPE - CORES
-
- This would select all cores with a Primary sediment type of Calc Ooze in water depths greater than 3000 meters.
-
- This formula would find all samples taken with a piston corer located in Abyssal plains around the globe. Note that the values for physiographic province and all other coded fields can be found in the
-
- which can be reached by clicking:
One final suggestion: when changing fields on the Map, take one step at a time for best results. For instance, if you want to change from cores to dredge analysis, turn off the core plots by clicking the box, let the map refresh, then turn on the dredge data. This will keep the mapserver happy and help insure a better exploration experience for you. Your comments and suggestions are welcome