Great Barnstable Marsh Field Results
We’ve been working hard in the lab to process the cores that we collected in Great Barnstable Marsh, MA. Here are some initial field results!
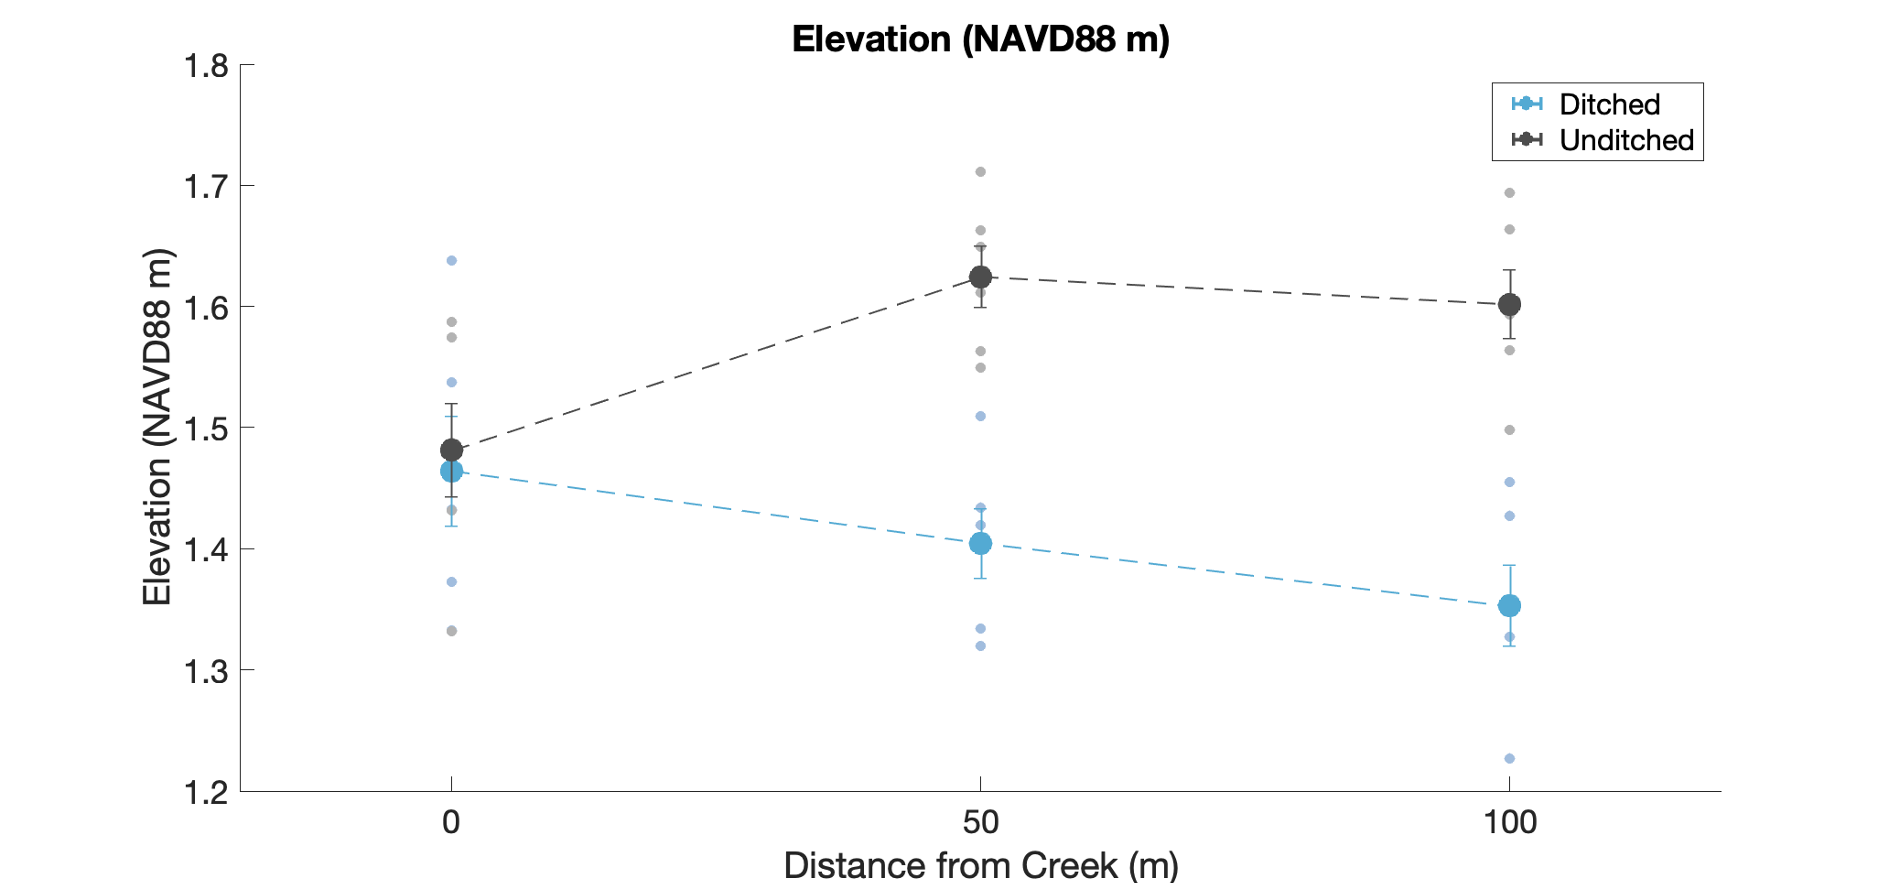
Figure 1: Measured elevation (North American Vertical Datum of 1988) using a Real Time Kinematic unit for the ditched and unditched marsh at 0 to 100m away from the creek. Moving away from the tidal creek, the unditched vegetated marsh platform resides at a higher elevation than the ditched marsh.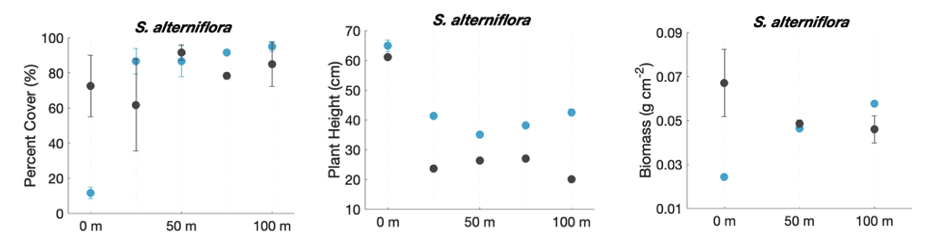
Figure 2: Short form Spartina alterniflora dominated both the ditched and unditched marsh. We characterized percent cover (%), plant height (cm), and plant biomass (g cm-2).
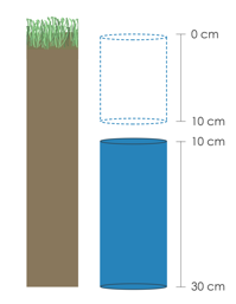
Figure 4: We collected 30 cm short cores and analyzed the surface (0-10cm) and deep (10-30cm) horizon for bulk soil and elemental properties. The following figures will display mean values with associated standard errors for the surface (open circle) and deep (closed circle) horizon for the ditched (blue) and unditched (black) marsh.
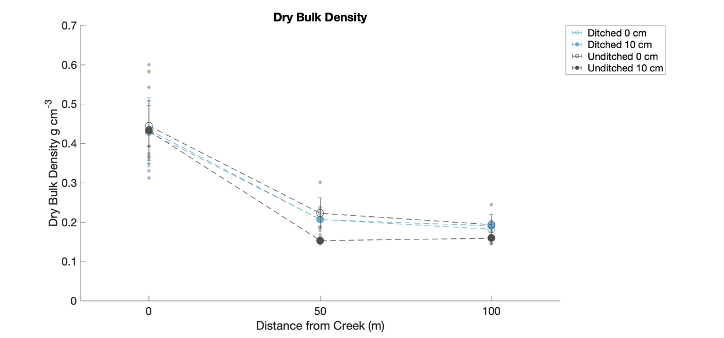
Figure 5: We measured dry bulk density for the surface and deep horizon of the ditched and unditched marsh. Dry bulk density values largely overlapped except slightly lower values in the deeper horizon (solid black circle) of the unditched marsh.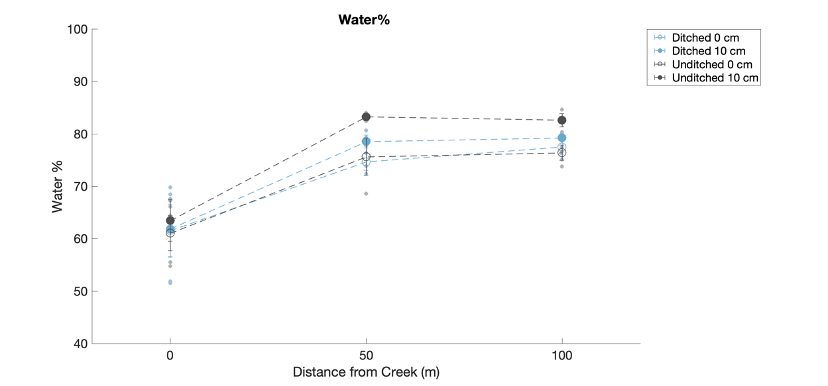
Figure 6: We observed similar water contents closest to the creek but moving away from the creek bank edge, the deeper (solid black) unditched marsh horizon had higher water contents.
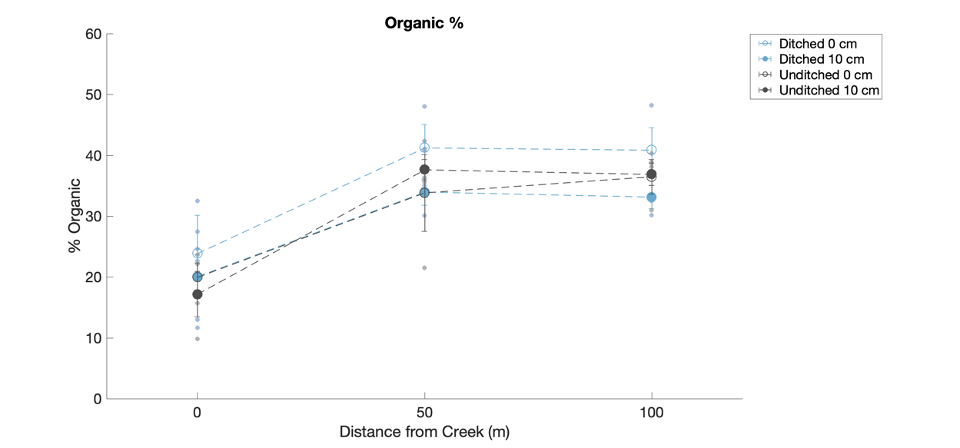
Figure 5: Percent organic matter was measured using the loss on ignition technique and was similar across horizons within the ditched and unditched marsh. Values slightly increased moving towards the marsh interior.