Analysis and Interpretations
Phase 1 (August 2004)
Also in this section
Theta distribution along the VFZ
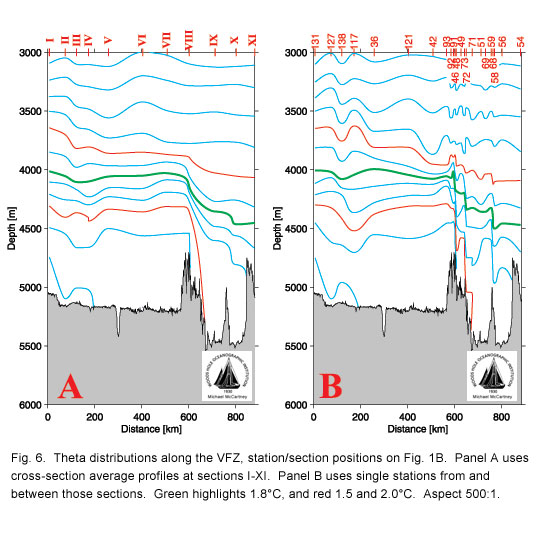
Fig. 6 shows the along-VFZ distribution of theta in two forms. In panel A each "station" represents the across-channel average of a three to five station cross-section, I - XI on Fig. 1B. The use of a cross-sectional averages better isolates the overall downstream evolution of the theta field in the VFZ by suppressing the across-channel tilts of isotherms that represent the geostrophic signature of the along-channel flow. In panel B individual stations are used: a central station from each of the cross-sections I - XI, and all the isolated stations near the VFZ axis that were made between the cross-sections. The details they add were used to guide the contouring of the lower zonal resolution panel A. The bathymetry plotted is the VFZ axis bathymetry following the deepest pathway along the channel and across the sills (the exception to that is the depression at 350 km, a subsidence caused by the interaction of MAR rift valley in the north wall and the VFZ [Sleep, 1969; Van Andel et al., 1971]).
The section reveals an interesting image of channel flow through a silled passage. There are four regimes in this data. The most noticeable, the " Primary Sill Regime" spans stations VII - IX, and is a classic image of flow spilling over a sill: isotherms colder than 1.9°C descending sharply eastward, 2.0°C less sharply, and little structure for warmer isotherms. The three sills identified by Vangriesheim [1980] in the primary sill area are near section VIII. Coldest AABW is about 1.33°C west of the sill (section VII), 1.39°C over the sill (section VIII), and 1.52°C east of the sill (section IX). The turbulent mixing of the water spilling over the sill warms the coldest water by about 0.19°C.
The eastward descent of isotherms is an appreciable pressure signal. Using the vertical profiles of σ4500, Fig. 3, we apply the hydraulic formula from Whitehead [1998] to estimate the volume flux through the VFZ with more refined parameters than those used for his estimate of 3.3 Sv. We use the version of the formula appropriate to this low latitude, where the passage is narrower than the Rossby radius, and upstream density profiles within the Inlet Regime as recommended by Helfrich and Pratt [2003]. The resulting transport estimate is 2.23 Sv (based on 900 m height of density "bifurcation" above sill, sill width ~ 8 km, and ∆ρ ≈ ∆σ4500 = 0.04kg/m3). This is a fortuitously good match with the transport we find at the primary array (see below), for the transport in the Whitehead formula is linearly dependent on sill width, and there are many assumptions and simplifications used to derive the formula.
The "Secondary Sill Regime" is 150 km east of the primary sill regime, between sections IX and X (between stations 58 and 59 in panel B of Figure 6). The width of the VFZ narrows due to a southward intrusion of a north wall corrugation (Fig. 1B), and the VFZ floor shoals from near 5400 m to a sill near 4970 m. This sill and constriction was previously unknown. Across this sill a further warming of 0.06°C takes place. It too has the classic image of flow spilling over a sill.
The "Exit Sill Regime" between stations X and XI was identified in 1983, and was the location of an estimate of the VFZ transport exiting northeast into the Gambia Basin [McCartney et al., 1991]. We did little hydrography this far to the east, but our multibeam data indicates two exit sills in the north wall in the 4700 - 4800 depth range estimated in that earlier paper (near 38°45' and 39°W on Fig. 1B). An additional warming of 0.08°C occurs across these exit sills.
The "Inlet Regime" between sections II and V is different in character from the others. A warm-ing of 0.06°C occurs, with the data showing a descent of colder isotherms from section I to IV, where the warming occurs, and an assent back to nearly the entry isotherm depths from section IV to V. We inter-pret this structure in a later discussion.
Estimating the transport through the VFZ and its vertical structure
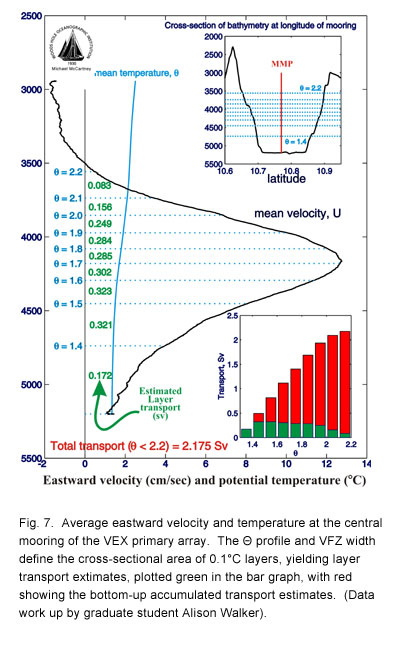
Fig. 7 illustrates our first attempt to quantify the net transport through the VFZ and its vertical structure estimate using the 437 profiles of velocity and CTD data from the single MMP recovered during the first recovery attempt. At the primary array the VFZ axis is almost exactly aligned east-west, so we have used coordinates with east as down-channel and north as cross-channel. The average profile shows a maximum speed near 4150 m, with a T at that level of 1.7°C. Above that speed maximum, a transition from eastward to westward flow is found near 3500 m (~ 2.2°C). The speed maximum is about 500 m above the sill depths in the Primary Sill Regime. Below the speed maximum, speed diminishes, but remains eastward all the way to the deepest observation.
Transport in T classes is constructed using areas defined by the MMP-measured average T pro-file, and the cross-section bathymetry, and ignoring the across-channel T surface slopes. The total trans-port below the measured zero velocity is 2.18 Sv, close to the synoptic estimate Fischer et al. [1996] made 84 km east of the VEX array site and close to the McCartney et al. [1991] estimated 2.3 to 2.7 Sv colder than 2.3°C at the eastern exit. While the maximum speed falls near 1.7°C, there is considerable transport in the colder classes, about 0.82 Sv colder than 1.6°C. There also is considerable flow of warmer waters, with about 0.77 Sv warmer than 1.8°C in classes characterized as NADW in the Guiana Basin.
Flow acceleration through the primary sill regime
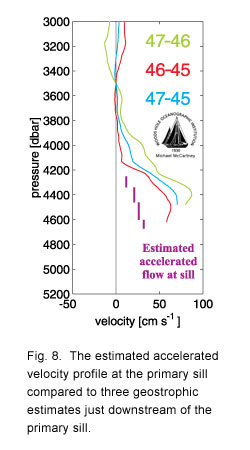
In Fig. 4, the deployment and the time-mean T cross-sections at the moored array are shown with the bathymetry 184 km down-channel near the primary sill area (across at station 92) superimposed in Fig. 4A. The transport of colder water at the array has to "squeeze" through a greatly diminished area above the primary sill. To determine an upper bound on the acceleration required, we assume that there is no mixing at all, and that the transports in T classes estimated at the primary array cross-section from the MMP profile are conserved at the sill cross-section. We use the station 92 T profile to define the cross-sectional areas of the 0.1°C T classes at the sill. Fig. 8 shows the resulting prediction of layer average speeds at the primary sill. Speeds in the colder classes accelerate considerably. At warmer classes there is little or no squeezing of the flow cross-sectional area, and no acceleration.
The vertical structure of the flow is thus likely to markedly change between the moored array lo-cation and the sill: from a downstream speed profile with a maximum well above the sea floor, to a bot-tom intensified speed profile over the sill. To "test" this we used the three stations that formed the aver-age section VIII (47-46-45, north to south) to form three station pairs and computed their geostrophic ve-locity profiles using 3500 db as a level of no motion (about 2.2°C, the T of the MMP zero speed level). The resulting three velocity profiles are included on Fig. 8 and indicate 60 - 80 cm/sec near bottom speeds, roughly twice our estimate. This may reflect our using too large a flow area at the sill cross-section (in particular, the southern passage has a significant sill whose depth is indicated by the black bar in Fig. 4), by the temporal variability (comparing instantaneous geostrophic estimates to a velocity de-rived from time mean flow), or represent an overestimate from using a pure geostrophic calculation. Combining the 45-47 pair's eastward geostrophic estimate with the west - east station pair 46-48 at this same site gives an estimated geostrophic velocity vector of 103 cm/sec @ 43° south of east. This empha-sizes the likely ageostrophic character of the cross-channel flow component, since the actual flow direc-tion is constrained to be eastward by the nearby VFZ walls. Using the reduced gravity and height above the sill that we used (p. 7) for estimating the hydraulically controlled transport of 2.23 Sv, we estimate a Froude number of 0.6 from the acceleration estimate, and 0.9 to 1.3 for the range of geostrophic esti-mates. These are close to the 1.0 of critical control, given the uncertainties of representing the real stratification as a simple reduced gravity system.
Flow in the Inlet Regime
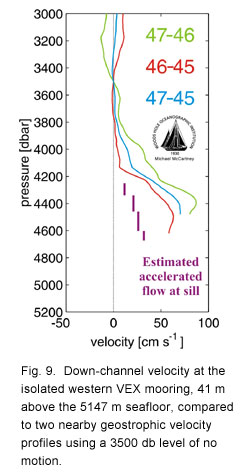
Sections II - IV cross the inflow of the coldest waters and have shear distributions indicative of bottom-intensified flow relative to a shallower reference level. The isolated western VEX mooring with the failed MMP was placed along section IV. Referring to Fig. 1B, note the elongated ridge in the middle of the VFZ, whose crest is less than 4000 m. This feature substantially reduces the cross-sectional area available for flow of colder waters. The near bottom VACM there recorded a two-year average velocity of 25.9 cm/sec, parallel to the very steep south wall of the VFZ at that longitude. In Fig. 9 we compare data from this VACM with two geostrophic velocity profiles from station pairs at section IV, computed relative to the 3500 db level of no motion measured at the VEX primary array central MMP mooring. Clearly there is an acceleration through this part of the Inlet regime, for these speeds are much larger than measured at the corresponding depths at the VEX primary array. The station pair 118-117 brackets the mooring site and is within the narrow deep passage next to the VFZ south wall (the other pair has a 4150 m mid-channel ridge rising between them). Using 118-117, separated 5 km, gives estimated eastward transports of 2.5 Sv beneath 3500 db, 1.8 Sv colder than 1.8°C. The other pair, separated 11 km, straddles a mid-channel ridge cresting at 4150 m. Its transport computes as 4.2 Sv beneath 3500 db, 3.5 Sv colder than 1.8°C, with no correction for topographic blocking and disruption of the baroclinic pressure gradient.
It appears that the eastward descents of cold isotherms from section I to section IV, and their ascents from section IV to section V represent the interplay of kinetic and potential energy in the Bernoulli equation. The cold flow accelerates as it converges from the Guiana Basin into the constricted cross-sectional area of the Inlet regime. That area appears to be most constricted for the colder waters at station IV due to the presence of a mid-VFZ ridge (Fig. 1B), and there the isotherms reach maximum depth, a reduction in potential energy in response to the kinetic energy growth. Between sections IV and V, where the channel greatly widens, the flow decelerates, the kinetic energy drops, and the isotherms ascend. In the deep levels of the VEX primary array at section VI, the deep speeds are only 2-4 cm/sec, so the kinetic energy is less than 2% of that at the western mooring. The ascent of isotherms does not return them to their entry depths, however, perhaps indicative of mixing and dissipation in the Inlet Regime, reflected in the 0.06°C rise of coldest observed T, altering the Bernoulli head.
The descent of waters from the Guiana Basin into the VFZ
West of the VFZ the Guiana Basin deepens northward from a minimum depth of about 4420 m near the equator, but does not have axial maximum depths exceeding 5000 m until about 11°N. That area is west of 50°W, well west of the VFZ entrance. The section just outside the entrance, Fig. 2, shows maximum depths near 4900 m. Section I, extending westward from the western tip of the south wall (Fig. 1B for location) crosses a meandering pathway that connects to section II, the first meridional section across the mouth of the VFZ. The maximum depths at sections I & II are 5060 and 5150 m, respectively. Thus the flow of the coldest waters into the VFZ represents a descent from depths somewhat less than 5000 m to depths near 5200 m inside the VFZ, rather than a rising up of waters from a deep basin across an entry sill. The only obstacles to this inflow are the abyssal hills visible west of section I on Fig. 1B, representing outcrops of the VFZ south wall which otherwise is buried in the sediments.
Inflow pathways
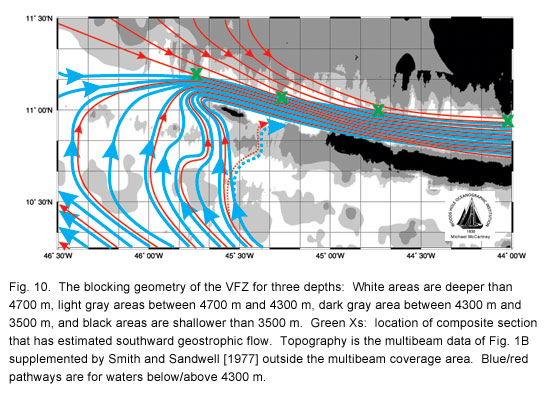
The Inlet Regime may involve two rather different pathways, Fig.10. A direct inflow from the southwest of AABW that is flowing northwestward (e.g., Fig. 2) in the Guiana Basin seems clear, and is "the only" available pathway for the colder waters. Some of the warmer waters flowing eastward in the VFZ, at and above the measured speed maximum, may have immediate origin north of the VFZ as well as along the southwest pathways. These two converging inflows turn eastward together giving a superimposed flow of bottom water and deep water. Evidence for this is given in the following.
Topography is a major constraint on the entry pathway for the colder waters in the VFZ. Fig. 10 shows progressive shading of the topography in the entrance to illustrate the depth dependence of the in-flow constraints. Within the western VFZ, 4700 m confines the coldest waters, < 1.4°C (see Figs. 4&6). Fig. 10 shows two principal entry paths exceeding 4700 m. Each of these has a channel in the sediments, possibly erosional (see Fig. 1B). One is "straight in" from the west to section II. The second is near 45°40'W to the west of the western terminus of the VFZ south wall, and is crossed by section I. The channel through section I meanders west around the tip of the 4700 m south wall contour to section II. We indicate some additional pathways between these two entry paths on Fig. 10 suggested by the sedi-ment channels between outcrops of peaks on the otherwise submerged beneath the sediment south wall. The 4300 m depth confines waters colder than about 1.5-1.6°C within the VFZ. The entry pathways are less constrained by bathymetric details at 4300 m, except for the large scale structure apparent in Fig 10: the north wall extends further west at this level compared to the terminus of the south wall near 45°15'W. This constrains inflow below 4300 to also be from the south and west. A gap between the south wall and a sedimentary rise at 45°30'W allows for a possible "short-cut" (dashed lines in Fig. 10) of the deep me-ander channel. The depth range 4300 - 3500 m, Fig. 10 defines a considerably broader area from which water, typically between 1.6°C and 2.2°C, could converge into the Inlet Regime than at the colder levels. In addition to the same inflow pathways from the south and west, the western terminus of the VFZ north wall has shifted east opening the VFZ to inflow from the north.
We find evidence for the southward flow of warmer waters into the VFZ from a composite sec-tion (not shown) comprised of the northernmost stations from sections II - V (eastward from here the north wall is a full obstacle to meridional flow below 3500 m), the green Xs on Fig 10. Isotherms 2.0° - 2.4°C slope downwards to the east; representing southward geostrophic flow relative to an overlying ref-erence level. If we use the MMP-measured zero velocity surface 3500 db for this station group, a south-ward flow of 1.4 Sv is estimated into the VFZ Inlet Regime above the north wall in the T range 1.8 - 2.2°C. It is clear that this northern pathway may represent a significant contributor to eastward flow through the VFZ. We also find evidence for this southward flow along the western MAR flank in the geostrophic flow for a hydrographic section 260 km northwest of the VFZ entrance. If it reflects a branch retroflecting from the northwest flow of deep and bottom water to return south to the VFZ, it does so on a large scale.
The dual pathways are reminiscent of recent numerical simulations by our WHOI colleagues Helfrich and Pratt [2003] of reduced gravity flow through a channel supplied from a large basin. A source flow was supplied to a boundary of a bowl-shaped basin that then drained through a silled passage. Roughly 70% of the source flow follows the bathymetry with the basin edge on the right (like the Guiana Basin AABW following the MAR flank). But only a fraction of that turns directly into the silled passage, the rest overshoots the entrance, retroflects towards the boundary and turns south to enter the passage from the north, along the left wall. Thus while 70 % of the flow into the passage approaches from the south, 80% of the inflow is along entry paths from the north. Helfrich and Pratt did an alternate run with a broad slope region outside the entrance. This spreads the f/h contours and reveals that the northward flow past the entrance gradually crosses f/h contours to converge into a dissipative boundary current [see Pratt, 1997, for a discussion of the boundary layer] flowing southward and turning into the passage along the left wall, similar to lab results reported by Whitehead and Salzig [2001].
Determining the meridional structure of flow
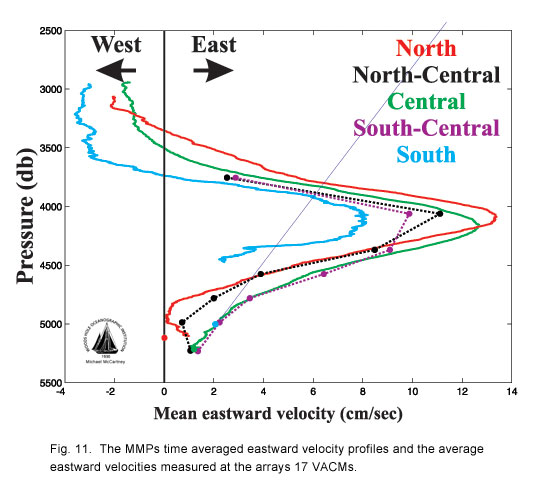
The time average temperature cross-section from the MMP CTD measurements is shown in Fig. 4B. The shear distribution it implies is consistent with the overall measured velocity structure. Fig. 11 shows the measured depth structure of downstream speed for each of the 5 moorings of the primary array - three profiles continuous in depth from the MMPs, and two comprised of 7 discrete VACM data points each. The southern MMP velocity profile has been truncated below 4400 m due to the small number of deeper-reaching profiles for that instrument. Also note that the VACM vertical spacings do not well resolve the velocity maximum. With those caveats, the salient structural features are: 1) Maximum eastward flow speeds are higher in the northern VFZ than in the south. 2) Below the speed maximum, near bottom speeds are stronger in the south than in the north. 3) Above the speed maximum, there is warmer water moving east in the north (< 2.29°C) than in the south (2.05°C), because isotachs slope upwards to the north while warmer isotherms slope downwards. 4) All three MMPs show the shallow reversal to westward flow, and that reversal occurs deeper in the south, with a stronger westward speed than in the north (where, because of sampling, Fig. 5, the record length is the greatest).
