Atlantic Insight
Woods Hole is located on the elbow of Cape Cod, Massachusetts, which juts out into the Atlantic Ocean. Roughly a quarter of studies published using Argo data focus on the Atlantic, the second largest ocean basin on the planet.
Tropical cyclone heat potential
Argo data collection aids research into extreme weather events, like tropical cyclones, in the Atlantic. The more recent expansion into the Gulf of Mexico in particular has facilitated this work. Scientists can now more accurately calculate monthly tropical cyclone heat potential, a measure of how much energy, stored in the upper ocean, is available to sustain and strengthen these storms. A better understanding of tropical cyclone heat potential can help researchers predict the behavior of the tropical storms and hurricanes that can do so much damage to the East Coast of the US.
The animation to the left shows tropical cyclone heat potential, in kJ/m2, in the Atlantic Ocean starting in January 2004. A distinct annual cycle is visible, with heat potential peaking along the US East Coast in late summer each year.
North Atlantic Oscillation
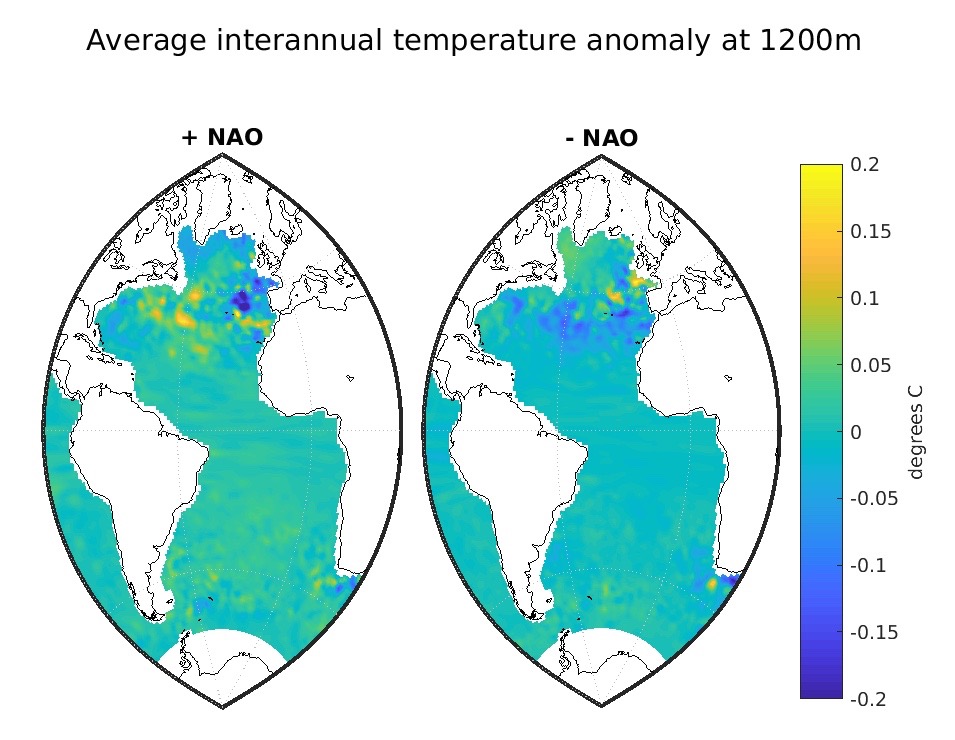
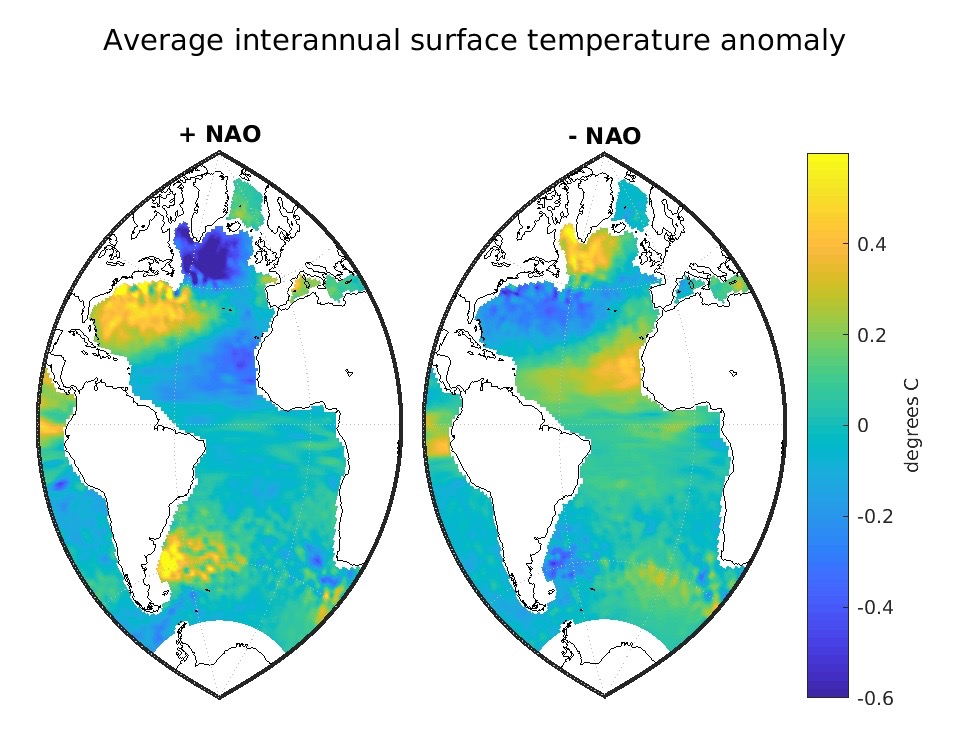
The North Atlantic Oscillation (NAO) is an atmospheric fluctuation in the North Atlantic. The NAO index, which indicates the strength of the oscillation, is calculated from the difference in atmospheric pressure between subpolar Reykjavik, Iceland, and a location on the subtropical southern Iberian Peninsula (typically Azores, Portugal). A positive phase of the NAO is characterized by lower-than-normal pressures in the subpolar region and higher-than-normal pressures in the subtropical region. In a negative phase, the pattern is reversed. Changes in NAO index affect the ocean as well as atmospheric phenomena, which can be clearly seen in the Argo dataset. Below are global plots of temperature (in degrees Celsius) anomalies at the sea surface and 1200 meters deep, averaged over positive and negative NAO phases since 2004.
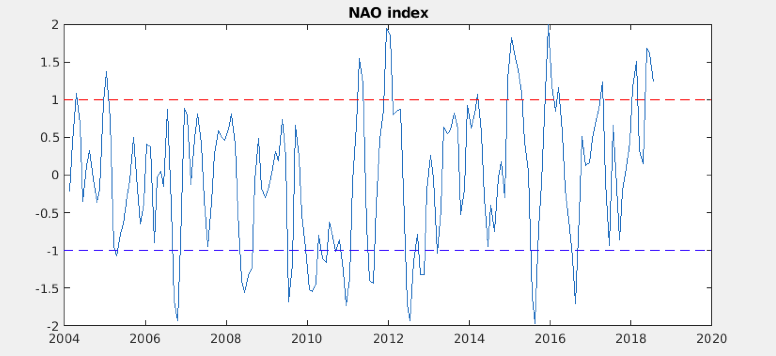
Value of the NAO index over time. The red and blue lines show the cutoffs for the positive and negative phases, respectively, used to create the averages above. Source: https://www.ncdc.noaa.gov/teleconnections/nao/
Labrador Sea deep convection
The Labrador Sea is part of the North Atlantic Ocean, located between the coast of Labrador, Canada, and the southwestern edge of Greenland. Wintertime sinking of cold, salty, dense water in the Labrador Sea is an important driver of the Atlantic Meridional Overturning Circulation (AMOC). The AMOC is a large-scale circulation that transports heat northward in the Atlantic Ocean and is a major factor in the climate system. The deep wintertime mixing in this region is also a crucial player in oxygenating the global ocean. The cold oxygen rich ‘Labrador Sea Water’ flows as a deep western boundary current under the Gulf Stream to bring oxygen to the rest of the deep Atlantic and beyond.
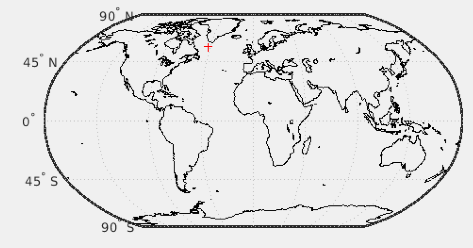
The red mark in the Labrador Sea, part of the North Atlantic, shows the location of the deep convection plotted in the figures to the left.
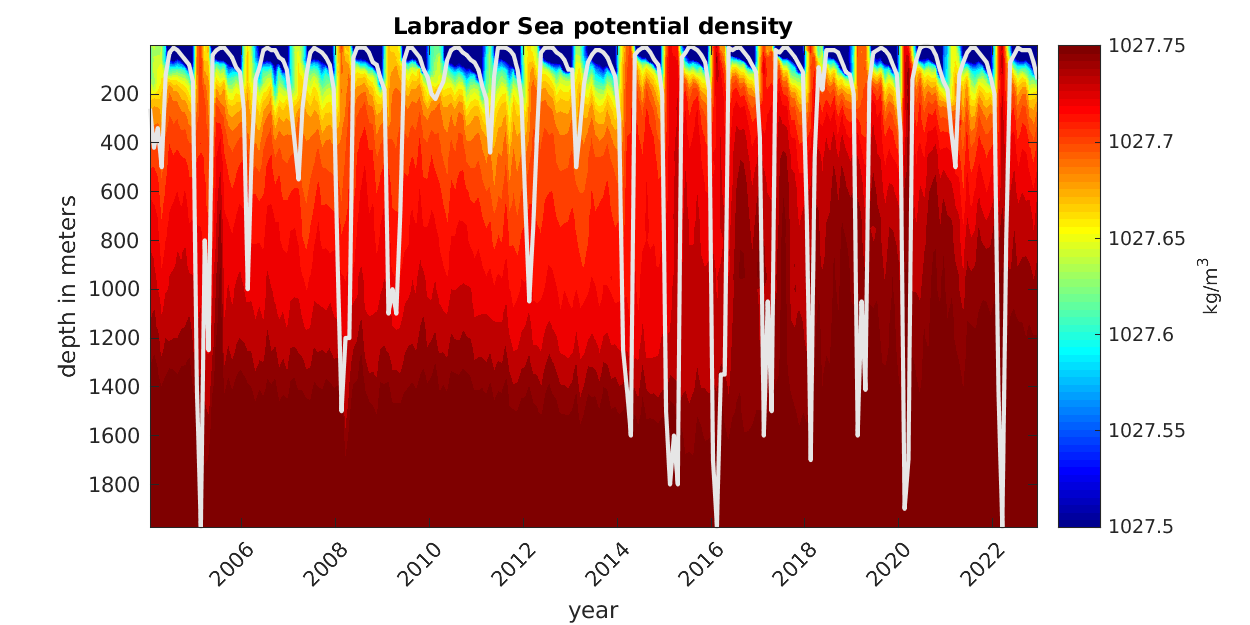
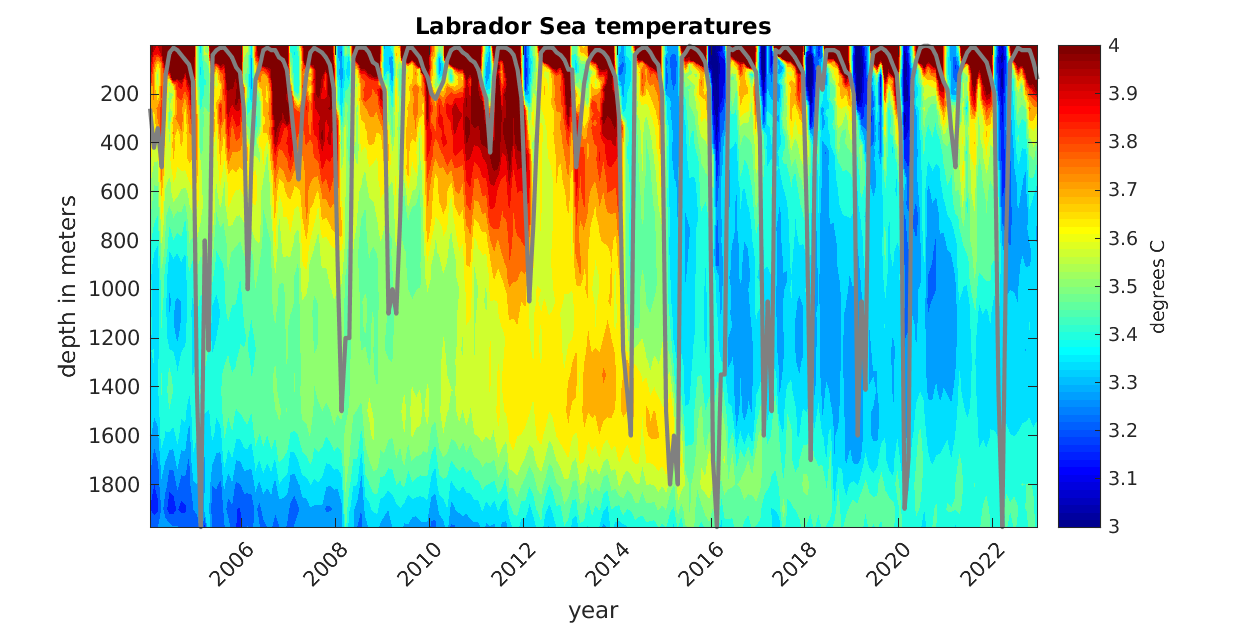
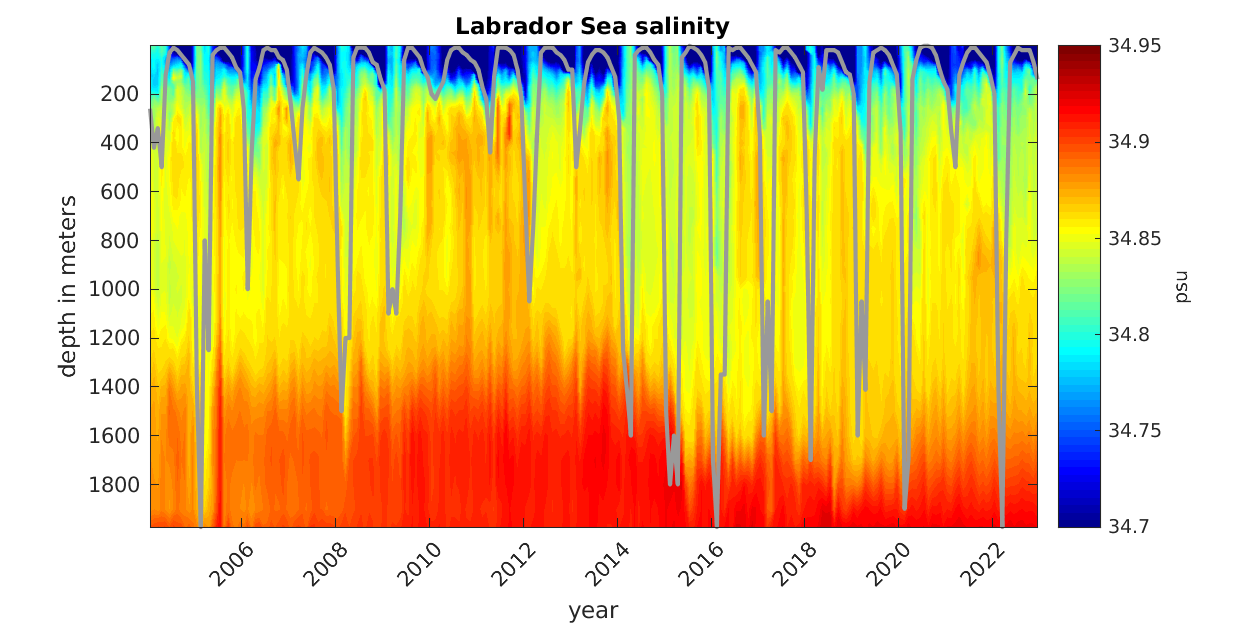
In the plots at left, Argo data show the yearly cycle of deep convection in a representative latitude and longitude in the Labrador Sea starting in 2004. The depth of convection is calculated as the depth of water that has a potential density (the density of seawater if it were under the same pressure as the sea surface) no more than 0.06 kg/m3 different from that of the surface. The depth of this mixing is superimposed as a gray line on each plot.
Distinct year-to-year changes in Labrador Sea deep convection are clear in the Argo dataset. Between 2005 and 2008, and between 2010 and 2014, deep convection weakened significantly. 2014 saw a re-intensification of convection deeper than ~1700 meters.