Applications - Cameca IMS 1280
U-Pb, Th-Pb chronology of zircon and monazite
The U, Th−Pb method is based on the radioactive decay of U and Th to stable isotopes of Pb and is certainly the most powerful tool of geochronology. In particular, U occurs naturally as radioactive isotopes 234U, 235U and 238U and Th is primarily radioactive 232Th. Lead has three naturally occurring radiogenic isotopes, 206Pb, 207Pb, 208Pb and one non-radiogenic isotope 204Pb. The reason for using this method is simply because there are two parent U isotopes decaying to daughter isotopes of Pb (238U decays to 206Pb, 235U to 207Pb and 232Th to 208Pb) and two isotopes of U (235U and 238U) decay to Pb with very different half lives (e.g. Faure and Mensing, 2004).
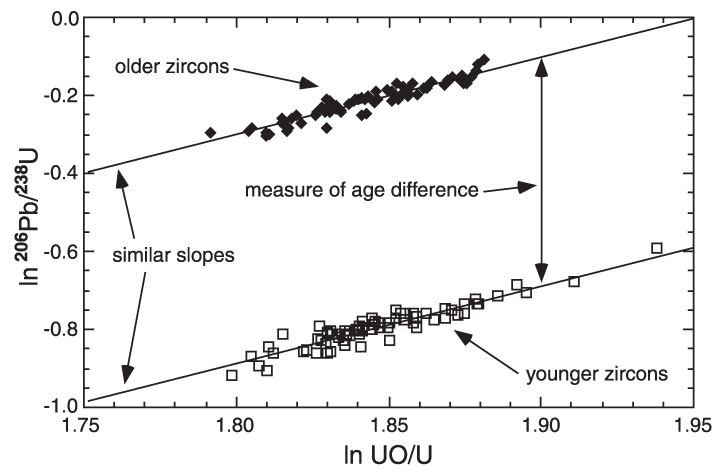
The mineral zircon (ZrSiO4) is particularly suitable for age dating because (a) it is usually enriched in U, (Th) and radiogenic Pb, as compared to other coexisting silicates, (b) it is the most abundant accessory mineral in most igneous and metamorphic rocks, and (c) zircon is extraordinarily resistant to subsequent geological events. A distinctive feature of zircon is its quality to readily incorporate U (and Th) but not Pb. Thus, at the time of crystallization virtually no Pb is incorporated into the zircon structure but with time left Pb accumulates in zircon due to radioactive decay. Based on measured concentrations of U and Pb and determining the isotopic composition of Pb, the age of the zircon can be calculated. The 238U-206Pb radioactive decay scheme is usually employed for dating of comparatively young zircons (younger than ca. 1000 Ma) because relatively small amounts of 207Pb are accumulated during this time due to 235U decay that prevent precise 207Pb/206Pb dating (Black et al., 2003 in references therein). The idea of this method is that zircons of different ages appear as sub-parallel linear trends of the same slope in coordinates of 254UO/238U - 206Pb/238U, and their vertical offset provides a direct measure of the age difference, which can be calculated based on the age of known standard (Fig. 1). Read More
Analytical conditions:
- Primary O-/O2- beam of ca. 20-30 um in diameter at 12.5 kV accelerating voltage and 10-30 nA of beam current;
- Secondary ions are collected at 10 kV of accelerating voltage;
- 30 or 150 um field of view, M/ΔM ~ 6000 to separate 206Pb and 207Pb from 178HfSi and 179HfSi, respectively, and 208Pb from 172HfO2 and 180HfSi peaks;
- Energy slit is centered and opened to 40-60 V (i.e., ±20-30 V);
- O2 flooding is recommended to enhance Pb ion yield;
- The following masses are usually analyzed: 204Pb, 206Pb, 207Pb, 208Pb, 238U, 238UO.
References:
[1] Black LP, Kamo SL, Allen CM, Aleinikoff JN, Davis DW, Korsch RJ, Foudoulis C (2003) TEMORA 1: a new zircon standard for Phanerozoic U−Pb geochronology. Chem Geol 200: 155-170; [2] Faure G and Mensing TM (2004) Isotopes: principles and applications. 3rd ed., John Wiley & Sons, Inc., Hoboken, New Jersey.
High-MPR analysis of Ti contents in zircon and quartz for geothermometry
Titanium concentration in zircon [Ti]zircon is a geochemical tracer with great potential to constrain zircon crystallization temperature. The original [Ti]zircon thermometer was developed using the NENIMF 3f and has been calibrated against experimentally produced zircons for high (1025–1450°C) temperatures, and natural zircons with estimated crystallization temperatures of ~580°C to ~1170°C (Watson et al., 2006).
The method originally used the energy filtering-based approach. This approach is not however free from significant technical and analytical difficulties. First, at low Ti concentrations, it is unclear whether all molecular ion interferences are adequately eliminated even with a high-voltage energy offset (HVEO) of 100 eV. Second, counting statistics at such analytical conditions is very poor at Ti concentration levels of ~1 ppm. For instance, at a typical beam setting to ensure spatial resolution of 10−20 µm and HVEO = 100 eV, the intensity of 30Si+ = ~1E+5 count per second (cps), while the intensity of 49Ti+ is only ~1 – 2 cps, giving 49Ti+/30Si+ a ratio of ~1.5E−5.
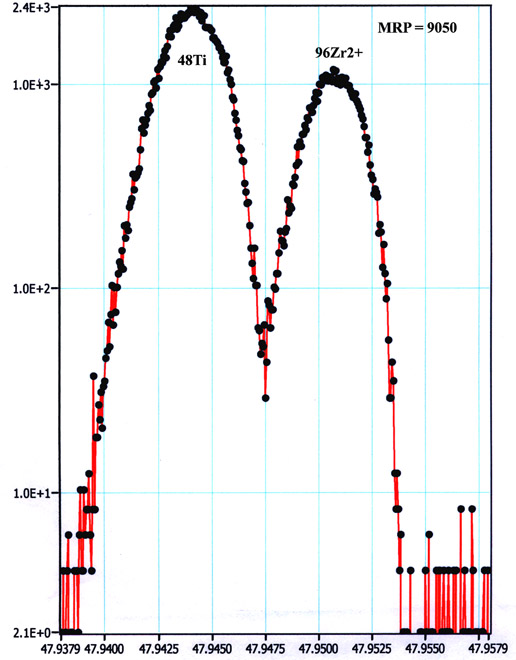
An alternative approach was developed using the 1280, taking advantage of its much higher mass resolution and improved transmission. With a mass resolving power (MRP) of 8,000-9,000, 96Zr2+, as well as 96Mo2+ and 96Ru2+ interferences on the 48Ti+ peak are satisfactorily resolved (Fig. 2). Note, that at such MRP, the transmission of 1280 is still 20-30% compared to that at minimum MPR of ~2,500, while the transmission of small-format IMS 3f instrument is nearly 1%. The only remaining interference, 48Ca+, can be quantitatively determined by measuring 40Ca in zircon, and was in fact found to be negligible for all natural zircons examined thus far. A clear advantage of this approach is a better precision with better data throughput (~10-15 min/spot) relative to the 3f-based method. Read More
Analytical conditions:
- The O-/O2- primary beam of ca. 10-30 um in diameter at 12.5 kV accelerating voltage and 5-20 nA of beam current;
- Secondary ions are collected at 10 kV of accelerating voltage;
- 150 um field of view (30 um could also be applied);
- M/ΔM ~ 8500 to resolve 96Zr2+ interference on 48Ti+ peak;Energy slit is centered and opened to 40-60 V.
References:
[1] Watson E, Wark D, Thomas J (2006) Crystallization thermometers for zircon and rutile. Contrib Mineral Petrol 151: 413-43
Boron isotopes in silicate glasses
The light lithophile element boron is a very powerful tracer for crustal recycling into the Earth’s mantle and shallow-level interaction of mantle-derived magmas with crustal rocks because (1) surface reservoirs are enriched in boron, from a few ppm in the lower continental crust to ~10 ppm B in the upper crust, and up to ~100 ppm B in the altered oceanic crust and marine sediments, as compared to the Earth mantle (0.05-0.25 ppm B) and (2) boron isotopes, 10B and 11B, can significantly fractionate in surface geochemical processes (d11B ranges from ~30‰ in terrigenous sediments through -10 to +10‰ in different igneous rocks to +40‰ in marine sediments and seawater) (e.g., Leeman and Sisson, 1996). Read More
SIMS is one of the most widely used analytical techniques for B isotope analyses, especially if boron isotopic composition has to be determined in small objects, such as mineral crystals, mineral hosted melt inclusions, and relicts of fresh volcanic glass, etc. (e.g., Hervig, 1996; Chaussidon et al., 1997). The availability of the appropriate reference materials represents a central issue in analytical technique development and application. Reference NIST SRM 610, 612, 614 synthetic glasses are widely used by the geochemical community for 11B/10B calibration. However, an analytical artifact related to the differences in instrumental mass fractionation between NIST SRM glasses the natural glasses was reported by Rosner et al. (2008), who showed an average +3.4‰ difference.
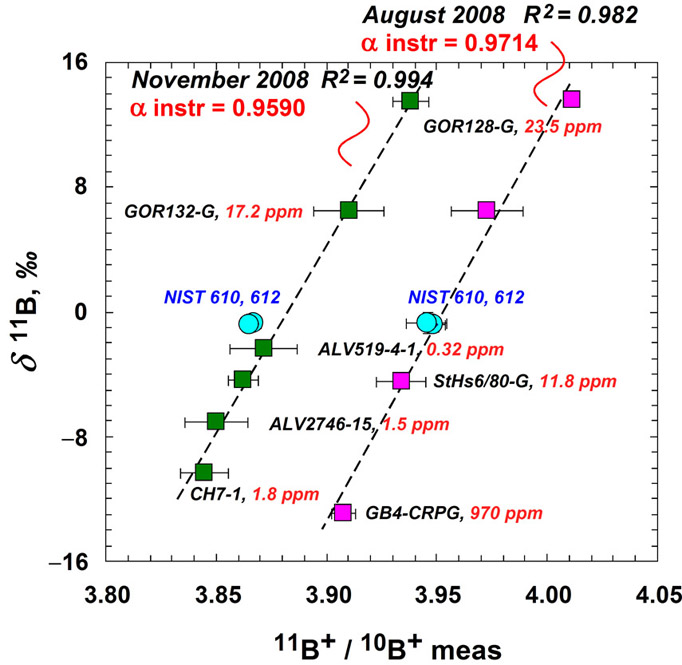
We carried out detailed tests with the NENIMF IMS 1280 instrument, because numerous factors related to instrument settings (e.g., setting of the primary and secondary ion optics, aging of the electron multiplier) may significantly affect IMF, which, in turn, create inter-laboratory differences. We used the same NIST SRM glasses (i.e. 610 and 612), as well as a set of natural glasses including certified andesitic StHs6/80-G glass (11.6 ppm B, d11B = -4.4‰), CRPG-CNRS internal reference GB4 glass resembling granodiorite (970 ppm B, d11B = -12.9‰; Chaussidon and Jambon, 1994) and five basaltic reference glasses, GOR128-G (22.7 ppm B, d11B = +13.5‰), GOR132-G (15.6 ppm B, d11B = +6.5‰), ALV2390-5 (2.6 ppm B, d11B = -3.3‰), ALV2746-15 (1.5 ppm B, d11B = -7.1‰), ALV519-4-1 (0.32 ppm B, d11B = -2.4‰) (Jochum et al., 2000; Rosner, personal communication, 2002; Shaw and Leroux, personal communication, 2007).
We observed the average +3.3‰ offset of the NIST SRM glasses from the working curve based on natural glasses at ainst = 0.959 but only 0.7‰ difference was found at ainst = 0.971, as shown in Fig. 3. It is essential to note that the analyses reported by Rosner et al. (2008) were acquired at an ainst that was often lower than our values cited above (from 0.9197 to 0.9675). Given that there is no instrumental fractionation of isotopes when ionization yield is 100% (i.e., a = 1), measured a is a function of “apparent ion yield” i.e. when the transmission of the instrument is optimized, ainst is the highest, and no effects described by Rosner et al. (2008) should be observed.
Analytical conditions:
- The O-/O2- primary beam of ca. 10-30 um in diameter at 13.5 kV accelerating voltage and 1-15 nA of beam current;
- Secondary ions are collected at 10 kV of accelerating voltage;
150 um field of view; - M/ΔM ~1500 to resolve 9Be1H+ interference on 10B+ peak and 10B1H+ interference on 11B+ peak;
- Energy slit is centered and opened to 40-60 V.
References:
[1] Chaussidon M, Jambon A (1994) Boron content and isotopic composition of oceanic basalts: geochemical and cosmochemical implications. Earth Planet Sci Lett 121: 277-291; [2] Chaussidon M, Robert F, Mangin D, Hanon P, Rose E (1997) Analytical procedures for the measurement of boron isotope compositions by ion microprobe in meteorites and mantle rocks. J Geostand Geoanal 21: 7-17; [3] Hervig RL (1996) Analyses of geological materials for boron by secondary ion mass spectrometry. In: Grew ES, Anovitz LM (eds) Boron: Mineralogy, Petrology and Geochemistry. Reviews in Mineralogy, Mineral Soc Am, Washington, DC, 33: 790-803; [4] Jochum KP, Dingwell DB, Rocholl A, et al. (2000) The preparation and preliminary characterization of eight geological MPI-DING reference glasses for in-situ microanalysis. J Geostand Geoanalys 24: 87-133; [5] Leeman WP, Sisson VB (1996) Geochemistry of boron and its implications for crustal and mantle processes. In: Grew ES, Anovitz LM (eds) Boron: Mineralogy, Petrology and Geochemistry. Reviews in Mineralogy, Mineral Soc Am, Washington, DC, 33: 645-707; [6] Rosner M, Wiedenbeck M, Ludwig T (2008) Composition-induced variations in SIMS instrumental mass fractionation during boron isotope ratio measurements of silicate glasses. Geostand Geoanal Res 32: 27-3.
Volatile components (H2O, CO2, F, S, Cl) in silicate glasses
Concentrations of volatile components (CO2, H2O, F, S, Cl) and their isotopic compositions (except for monoisotopic F) in silicate glasses and particularly glass inclusions in phenocrysts, are of great interest to geochemists, because pre-eruptive volatile contents can be obtained through analysis of glass (melt) inclusions, and because (1) their abundances in the mantle and their behavior in mantle melting, (2) their behavior in global recycling process, (3) their mantle to surface fluxes, (4) co-variations of volatiles and lithophile elements in subduction zone magma genesis, and (5) the role of these volatile components during explosive eruptive behavior are among outstanding questions in geochemistry today. A great advantage of using SIMS techniques is its ability to provide spatial resolution required for analysis of small, several to several tens micron sized objects (i.e., glass and crystal inclusions in phenocrysts, unique samples of natural experiments). Read More
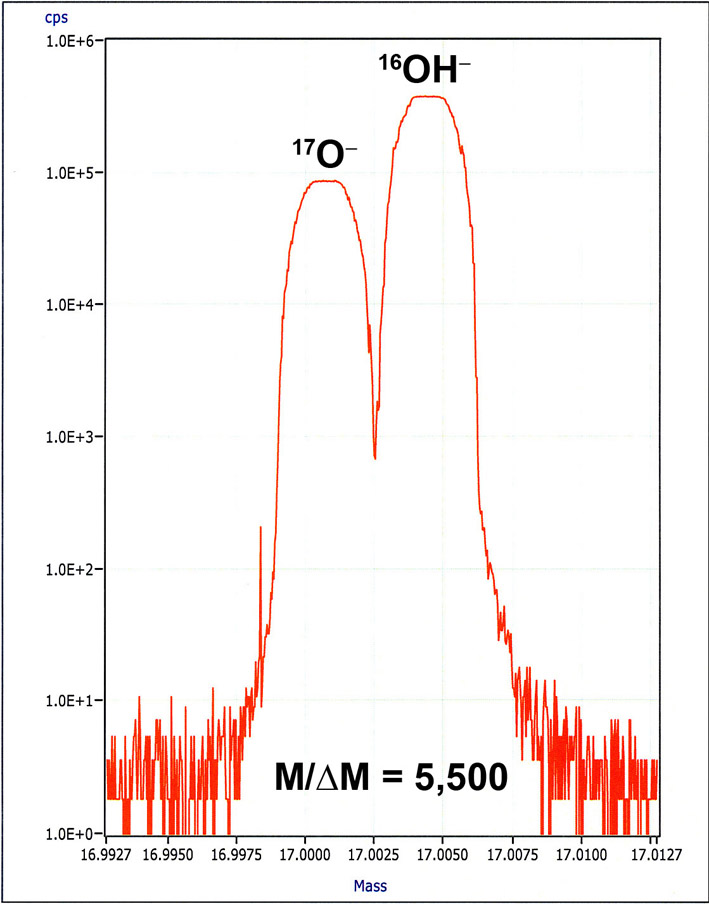
Development of this technique is motivated by our own scientific interest, by the fact that, despite rapidly increasing interest of the community, NO US multi-user facility presently offers this platform, and because SIMS analysis of single-side-polished grain mounts allows analysis of smaller melt inclusions than FTIR analysis of mounts requiring a polish of two sides of melt inclusion-bearing phenocrysts, the analytical protocol for determining concentrations of CO2, H2O, F, S, Cl was developed following the approach taken by Hauri et al. (2002), using the Cs+ primary ion beam. The only difference is that 16O1H is measured for H2O, instead of 1H, because the 1H ion trajectory in the secondary ion optics is very different from other higher-mass ions and it is more convenient to measure the OH- ion. An MRP = 5,500 is routinely used for separation of 17O from 16O1H. At such MRP, all commonly occurring molecular ion interferences are completely separated: 29Si1H from 30Si, 16O2 and 31P1H from 32S, 18O1H from 19F, 34S1H and 19F16O from 35Cl. Natural and synthetic reference glasses with known concentrations of volatile components (H2O and CO2 were analyzed by FTIR and manometry techniques, while F, Cl and S concentrations were analyzed by EPMA and/or SIMS) are used to determine working curves. Polished pieces of the reference glasses were mounted in an indium substrate to reduce carbon dioxide and hydrogen background. A typical set of working curve equations is: CO2 (wt%) = 142557*(12C/30Si) – 28.282
H2O (wt%) = 0.412*(16O1H/30Si) – 0.0092
F (ppm) = 423*(19F/30Si)– 30
S (ppm) = 635*(32S/30Si)
Cl (ppm) = 647*(35Cl/30Si)
These equations were determined by using an off-line double-error linear regression MATLAB script (Sohn and Menke, 2002). Note that three of the working curves go through the origin, even though the regression was performed without forcing them to go through the origin. Precisions of slopes in one session typically vary from ±4% (2s) for H2O to ±11% for CO2. Reproducibility of slopes over the 2.5-year period is remarkably good; ranging from ±11% (2s) for F, S, and Cl, ±16% for H2O, and ±20% CO2 for seven sessions. Measurements of a synthetic forsterite crystal devoid of any volatile components, using the same instrument settings as routine volatile analysis reveal that the background for H2O is of the order of 50–80 ppm, and that for CO2 around 5–9 ppm with sample chamber vacuum at 4E-9 torr. Assuming that the background signals originate from hydrogen and CO2 adsorbed on the sample surface, these backgrounds could easily be reduced by pre-sputtering analysis areas with a higher-current ion beam. Analysis of extremely low abundances of these volatile components in nominally anhydrous minerals, for instance, must be made with significantly different instrument settings from those for the routine analysis of volatile components in glasses. Backgrounds for F (4.5 ppm), S (0.5 ppm), and Cl (1.1 ppm) determined with the synthetic forsterite are also low. Rose-Koga et al. (2008) made cross calibration of NENIMF results with electron probe for F, S, and Cl, and found general agreement between the two techniques for all three elements for concentrations above 100 ppm, but discrepancies increase with decreasing concentrations as detection limits of the electron probe are approached. Cross calibration with FTIR for H2O and CO2 also becomes important particularly for high concentrations because detector saturation with FTIR makes accurate determination difficult for >2% H2O. Our glasses with high H2O and CO2 concentrations (up to 1.25% CO2 and 4.11% H2O) have been certified by manometry (Dr. T. Venemmann, University of Lausanne). The working curves given here are for glasses of basaltic – andesitic compositions. Those for high-silica glasses are separately determined. The working curve for H2O, for instance, is found to have a significantly different slope (1.789, cf. 0.412 for basalts, see above), showing important matrix effects.
Analytical conditions:
- The Cs+ primary beam of ~10 um in diameter at 10 kV accelerating voltage and 1-2 nA of beam current;
- Secondary ions are collected at 10 kV of accelerating voltage;
- 150 um field of view;M/ΔM ~5000 to resolve 17O- interference on 16O1H- peak;
- Energy slit is centered and opened to 40-60 V.
References:
[1] Hauri E, Wang J, Dixon JE, King PL, Mandeville C, Newman S (2002) SIMS analysis of volatiles in silicate glasses - 1. Calibration, matrix effects and comparisons with FTIR. Chem Geol 183: 99-114; [2] Sohn RA, Menke W (2002) Application of maximum liklihood and bootstrap methods to nonlinear curve-fit problems in geochemistry. Geochem Geophys Geosyst 3: doi:10.1029/2001GC000253; [3] Rose-Koga EF, Shimizu N, Devidal J, Koga KT, Le Voyer M (2008) Investigation of F, S, and Cl standards by ion probe and electron probe. Eos Trans. AGU, 89, Fall Mtg. Suppl., V31B-214.
Sulfur and chlorine isotopes in silicate glasses
A combination of concentration and isotopic composition for any element is a much more powerful geochemical tracer than either alone, and we have made efforts to develop SIMS techniques for analyses of isotopes of volatile elements. Analytical platforms developed thus far and will contribute to improving quantitative understanding of mechanisms and the magnitude of natural isotopic fractionation, particularly, in relation to abundances of other volatile and lithophile elements. In this effort, establishment of standard materials (natural and experimental) and determination of instrumental mass fractionation are critical to our research goals and our mission as a multi-user facility. Read More
The Cl isotope technique was developed some years ago (Layne et al., 2004; Godon et al., 2004). Development of silicate glass standards is, however, still incomplete, and hinders broad applications of the technique. Work in this area is ongoing, in collaboration with J. Webster (AMNH).
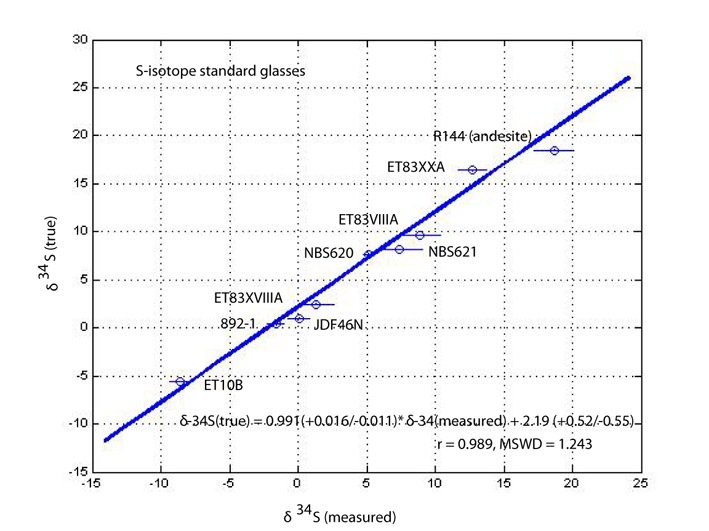
The S isotope technique, on the other hand, is much more advanced because of the collaborative effort made recently by Shimizu and C. Mandeville (AMNH). Figure 5 illustrates a working curve for S isotopic analysis of silicate glasses with major element compositions ranging from basalts through andesites to high-silica compositions. The results show that all data points fall on a single line with a slope of unity within error, demonstrating that significant matrix effects do not exist, and that the instrumental mass fractionation factor (a = (34S/32S)measured/(34S/32S)true) is, on average, 0.998. Replicate analyses of individual standard glasses reveal that 34S/32S ratios in glasses can be determined with an external precision of ±0.5 ‰ (2s standard error) for S concentrations >600 ppm with a beam of Cs+ ions with a current ranging from 1 to 2 nA and at MRP=5,000. The calibration curve shifts from session to session as a varies with surface conditions as well as with slightly different instrument settings. For instance, for one of the standard glasses of basaltic composition (JDF46N), a = 0.9983 for the session in which Fig. 5 was obtained, whereas a = 0.9967 for another session. However, the establishment of a calibration as shown in the figure makes it possible to determine S isotopic compositions in large numbers of natural and experimental silicate glasses of ranges of major element compositions with relative ease. This makes it possible to determine fundamental parameters required for geochemical interpretation of S isotopic compositions of natural glasses, including mass fractionation factors between sulfides and silicate melts, sulfate and silicate melts, and S-bearing gas phase(s) and silicate melts as a function of oxygen fugacity. The ongoing Mandeville-Shimizu-Kelley project attempts to constrain these fundamental parameters and apply the SIMS techniques to a wide range of geochemical questions.
Analytical conditions:
- The Cs+ primary beam of ~10 um in diameter at 10 kV accelerating voltage and 1-2 nA of beam current;
- Secondary ions are collected at 10 kV of accelerating voltage;
- 150 um field of view;M/ΔM ~3500 to resolve 31PH- interference on 32S- peak;
- Energy slit is centered and opened to 40-60 V.
References:
[1] Layne GD, Godon A, Webster JD, Bach W (2004) Secondary ion mass spectrometry for the determination of d37Cl, Part I. Ion microprobe analysis of glasses and fluids. Chem Geol 207: 277-289; [2] Godon A, Webster JD, Layne GD, Pineau F (2004) Secondary ion mass spectrometry for the determination of d37Cl, part II. Intercalibarion of SIMS and IRMS for aluminosilicate glasses. Chem Geol 207: 291-30.
Sr/Ca and Ba/Ca of marine carbonates
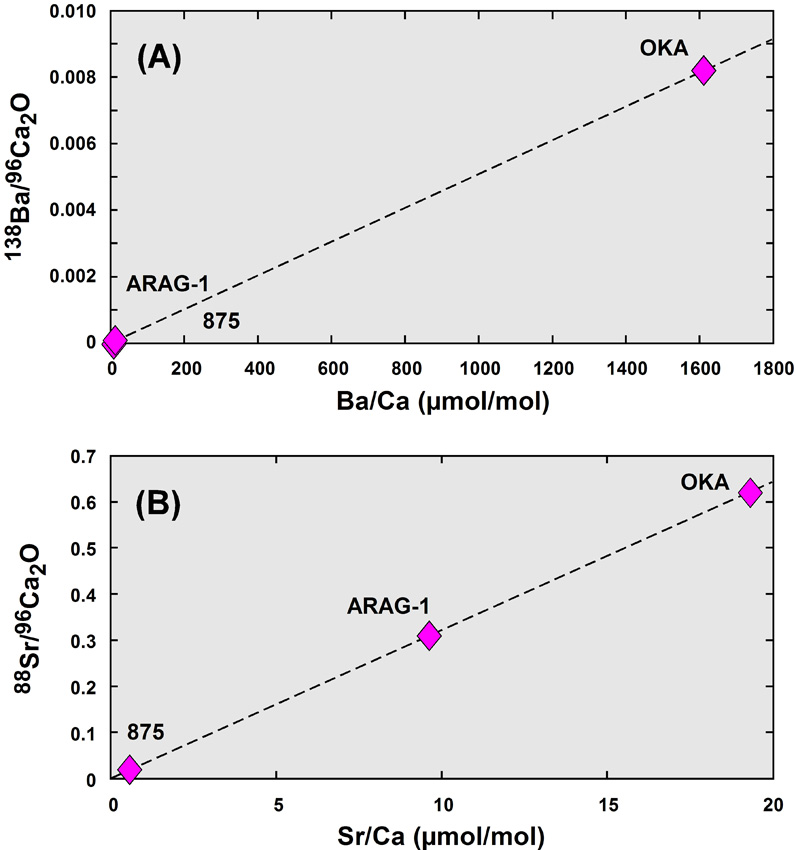
Traditionally, analysis of marine carbonates for paleoceanographic proxies was made with the 3f, but experimental approaches promoted recently by the WHOI group (e.g., Cohen et al., 2006; Gaetani and Cohen, 2006) now require spatial resolution and precision of data that can be achievable only with the 1280. This protocol was developed with a beam of O- ions with a current of 1.0–1.5 nA focused into a spot of 7 mm in diameter and at MRP = 7,000. In the experiments, 84Sr and 86Sr spikes were used as a time marker for crystal growth of aragonite, and high MRP was required. Even at the MRP used, separation of 84Sr from 40Ca44Ca and 42Ca2 was not complete and 84Sr peak position had to be calculated, based on 86Sr and 88Sr peak positions. Nevertheless, Sr/Ca and Ba/Ca ratios were determined satisfactorily with required spatial resolution and precision. Figure 6 illustrates working curves obtained for these elemental ratios, using three carbonate standards. In order to minimize the effect of hysteresis, Ca intensity was measured at mass 96, using 40Ca40Ca16O. The success of this method is derived from (1) greater secondary ion yields with the 1280 relative to the 3f, based on its higher secondary ion acceleration potential (10 kV vs. 4.5 kV), which results in a difference of about a factor of 2, and (2) greater secondary ion yields with the 1280, based on its higher beam density due to the Duo-lens (another factor of 2, at least). This method will be expanded to include Mg/Ca and U/Ca to meet increasing demands of the ocean science community. Read More
Analytical conditions:
- The O- primary beam of ~5-10 um in diameter at 10 kV accelerating voltage and 1-2 nA of beam current;
- Secondary ions are collected at 10 kV of accelerating voltage;
- 150 um field of view;M/ΔM ~7000;Energy slit is centered and opened to 40-60 V.
References:
[1] Cohen AL, Gaetani GA Lunalv T, Corliss BH George RY (2006) Compositional variability in the cold-water coral Lophelia pertusa is driven by temperature and efficiency of aragonite precipitation. Geochem. Geophys. Geosyst.: 7, Q12004, doi:10.1029/2006GC001354; [2] Gaetani GA, Cohen AL (2006) Element partitioning during precipitation of aragonite from seawater: a framework for understanding paleoproxies. Geochim Cosmochim Acta 70: 4617-463.
B/Ca ratios and B isotope analysis of carbonates
It is very well known that (1) boron isotopes fractionate between B(OH)4- and B(OH)3 species in aqueous solutions (Kakihana et al., 1977), and (2) boron speciation in seawater is a function of pH (e.g., Spivack and Edmond, 1987) and, thus, B isotopic composition could be a good proxy for pH of seawater (e.g., Hemming and Hanson, 1992). Similarly to B isotopes, B/Ca ratio in marine carbonates has been proposed as a tracer of seawater pH because the higher is pH, the more B is present as borate with negative charge and this B form substitutes for carbonate ion in CaCO3 (Sanyal et al., 1996, 1997; Yu et al., 2007). Read More
Analytical Conditions:
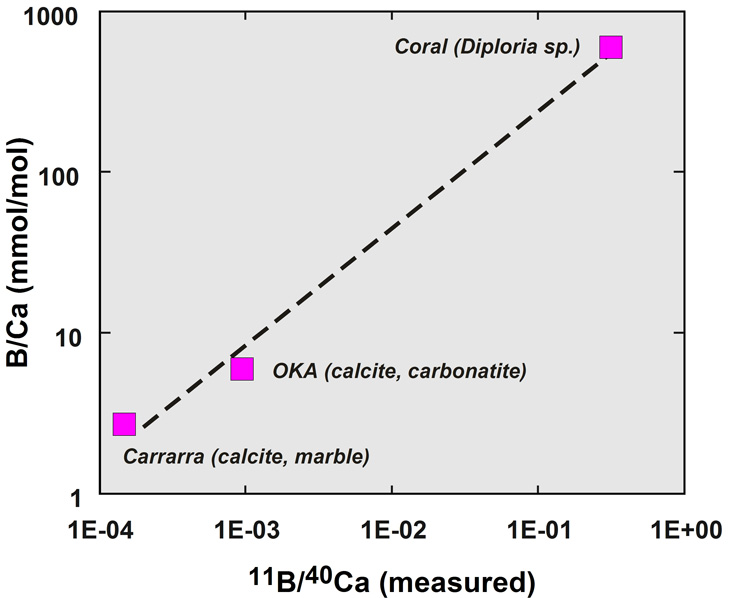
Analysis of B in carbonates is rather complicated because carbonates are poor ionizers under oxygen bombardment. It was found that secondary ion yield of B- upon Cs+ ion bombardment is considerably better: 18 cps/ppm/nA, compared with ~4 cps/ppm/nA with the O- beam. This has made it possible to obtain 11B intensity of 104 cps in corals with ~60 ppm B with a ~10-nA Cs+ beam with a spatial resolution of about 10 mm and with a precision for d11B of ±1‰. The enhanced ion yield has also made it possible to determine B concentrations less than 1 ppm (or B/Ca ratios less than 9 mmol/mol) in coccoliths. Figure 7 illustrates a provisional working curve for B/Ca in carbonates determined by this method and is being used for an examination of the potential for B/Ca as a proxy for seawater pH using cultured coccoliths (Stoll et al., 2008).
Routinely, we use the following analytical conditions:
- Primary Cs- beam of 2-10 nA;
- Secondary optics setup: 10 kV of secondary ion extraction potential, 150 um field of view;
- M/ΔM ~2500 at nearly completely opened entrance and exit slits;
- Energy window is centered and opened to 50 V (i.e., ±25 V).
References:
[1] Kakihana H, Kotaka M, Satoh S, Nomura M, Okamoto M (1977) Fundamental studies on the ion exchange separation on boron isotopes. Bull Chem Soc Jpn 50, 158-163; [2] Sanyal A, Hemming NG, Broeker WS, Lea DW, Spero HJ, Hanson GN (1996) Oceanic pH control on the boron isotopic composition of foraminifera: evidence from culture experiments. Paleoceanography 11, 513-517; [3] Sanyal A, Hemming NG, Broeker WS, Hanson GN (1997) Changes in pH in the eastern equatorial Pacific across stage 5-6 based on boron isotopes in foraminifera. Glob Biogeochem Cycles 11, 125-134; [4] Spivack AJ, Edmond JM (1987) Boron isotopic exchange between seawater and the oceanic crust. Geochim Cosmochim Acta 51, 1033-1043; [5] Yu J Elderfield H, Honisch B (2007) B/Ca in planktonic foraminifera as a proxy for surface seawater pH. Paleoceanogr. 22: PA2202, doi: 10.1029/2006PA00134.
