Skip to content

Speciation of dissolved organic phosphorus in seawater

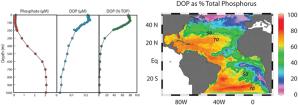
All living organisms require phosphorus (P) to synthesize DNA, RNA, ATP, and a host of other essential organic compounds.  Marine P is supplied by continental weathering, and in many areas of the remote ocean, far removed from land (e.g. North Pacific Subtropical Gyre, the Sargasso Sea) and other semi-enclosed seas nearly surrounded by land (e.g. Mediterranean Sea), marine productivity is limited by the amount of phosphorus present in seawater. Phosphate ion (PO43- ) is the most biologically available form of phosphorus.  Rapid biological uptake of phosphate strips P from the sunlit euphotic zone, often driving phosphate concentrations down to low nM levels.  After death, phytoplankton sink into the deep ocean, where regeneration processes allow phosphate values to rebound below 200m (Figure 1). Although marine primary production removes phosphate from the upper ocean, it also releases organic phosphorus into the water column. Even in P limited mid ocean gyres, dissolved organic phosphorous (DOP) accumulates to concentrations in excess of 100-300 nM (Figure 2). Biological uptake reduces DOP concentrations to near zero levels in the deep ocean, resulting in depth profiles of phosphate and DOP that are mirror images of each other (Figure 2).

There is growing evidence that DOP supports a significant amount of the annual primary production in highly stratified, phosphate depleted waters. As the planet warms and stratification in ocean gyres strengthens, phosphorous limitation may become even more acute, and microbes that can access the large stock of DOP sequestered in the upper ocean will have a significant competitive advantage. However, we know little about the chemical composition, origin, and fate of DOP in the ocean. The goal of our project is to identify key DOP constituents and use them experimentally as tracers of DOP cycling. We are actively developing new analytical methods to do this, including high pressure liquid chromatography coupled to inductively coupled and electrospray ionization mass spectrometry (HPLC-ICP-MS and HPLC-ESI-MS respectively) (Figure 3). Using these techniques we have identified major DOP constituents in laboratory cultures (Figure 4) and are beginning to describe the distribution of DOP in seawater (Figure 5).
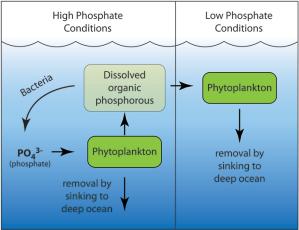
Conceptual model of dissolved organic phosphorous (DOP) cycling in the ocean.
Figure 1. Conceptual model of dissolved organic phosphorous (DOP) cycling in the ocean. Under conditions of high phosphate concentration (left) phytoplankton utilize phosphate to grow. A fraction of the phosphorous assimilated by phytoplankton is released back to seawater as DOP of unknown composition. Bacteria hydrolyze this organic phosphorous back to phosphate, but under low phosphate conditions (right) other marine phytoplankton may utilize DOP to obtain the phosphorous they need for growth.
Distribution of phosphate (left panel, red circles), DOP (middle panel, blue circles) and DOP as per of total dissolved phosphorous (right panel, green circles) with depth at Station ALOHA off Hawaii.
Figure 2A. Distribution of phosphate (left panel, red circles), DOP (middle panel, blue circles) and DOP as per of total dissolved phosphorous (right panel, green circles) with depth at Station ALOHA off Hawaii. Phosphate concentrations are low in surface waters due to biological uptake, and high in the deep ocean due to regeneration of sinking plankton. 2B DOP concentration expressed as percent total dissolved phosphorous in the Atlantic Ocean from Torre-Valdes et al. 2009. At mid ocean sites, DOP represents most phosphorous in seawater.
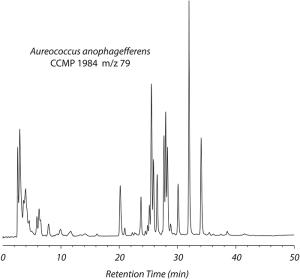
HPLC trace of DOP in spent culture media from the brown tide algae Aureococcus anophagefferens.
Figure 3. HPLC trace of DOP in spent culture media from the brown tide algae Aureococcus anophagefferens. Phosphorous compounds are detected by electrospray ionization mass spectrometry by monitoring for diagnostic fragment ions. A. anaophagefferens releases a complex suite of DOP compounds to its culture medium.
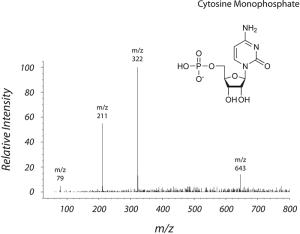
Mass spectrum of the peak at 27.7 minutes from HPLC-MS analysis of A. anaophagefferens culture medium.
Figure 4. Mass spectrum of the peak at 27.7 minutes from HPLC-MS analysis of A. anaophagefferens culture medium. High resolution MS and an analysis of major fragments allowed us to identify this peak as cytosine monophosphate. Using this approach we were able to identify most of the major DOP compounds in the sample.
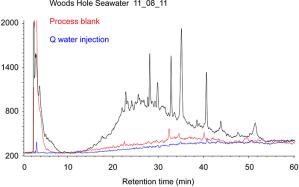
HPLC-MS of DOP in Woods Hole Seawater.
Figure 5. HPLC-MS of DOP in Woods Hole Seawater. Our analyses show a very complex mixture of DOP compounds, with a wide distribution of molecular ions from compounds we have not yet identified. Theses are some of the compounds that are available of microbes under low phosphate conditions. If we are able to identify these compounds, we should be able to find their sources and experimentally follow their uptake by marine microbes.