Elemental, isotopic, spectral and chromatographic data for HMWDOM
On this page: Sampling protocols | Elemental and isotopic analysis | Nuclear magnetic resonance spectroscopy | Proton NMR | Carbon-13 NMR | Phosphorous-31 NMR | Heteronuclear Single Quantum Coherence (HSQC) Spectroscopy | Size Exclusion Chromatography |
Sampling protocols
Ultrafiltration
Large-volume seawater samples were drawn from the 20m intake pipe at the Natural Energy Laboratory in Kona, Hawaii (19.727oW, 156.063oN) in February 2013. The samples were filtered to remove bacteria and small particles using a cleaned (10% HCl) Suporflow dual-stage (0.8 and 0.2 microns) Gelman polyether sulfone (PES) cartridge filter (Chisolm-Pall) fitted to an Advanta stainless-steel housing. The high molecular weight dissolved organic matter fraction (HMWDOM) was collected using two spiral wound ultrafiltration systems consisting of a stainless-steel centripetal pump and membrane housings and a fluorinated high-density polyethylene reservoir. Each system was plumbed with Teflon tubing and PVDF valves, and fitted with two ultrafiltration membranes (Osmonics GE-H4040C; Separation Engineering) that nominally retain organic matter with a relative molecular weight >1 kDa (> 99% rejection of vitamin B12 ). Membranes were cleaned using isopropanol, detergent (0.01% micro), HCl (0.01 M), and NaOH (0.01 M); stored in sodium azide (0.55 mM); and rinsed with water immediately before use. Approximately 32,241 liters of seawater were concentrated over a period of 14 days. Each day, samples (~1150 L per system) were concentrated to 20 L, filtered through a 0.2 micron PES cartridge filter (Propor demi-cap) into a fluorinated HDPE carboy and stored in a -20oC freezer. The sample was cooled, but did not freeze during storage. The following day, this concentrate was combined with the new day’s concentrate, reduced in volume to 20L, and again stored at -20oC. This process was repeated daily. At the end of the sampling period, the pooled samples were frozen, and returned to Woods Hole for further processing. Dissolved organic carbon measurements showed 22% of TOC was recovered in the concentrate. In Woods Hole, samples were thawed, filtered through a 0.2 micron PES filter, then filtered again through a stirred cell system fitted with a 30 kD cellulose fiber (ultracell) filter to remove viruses. Samples were desalted by a smaller ultrafiltration system fitted with Osmonics GE-E4010 filters. Twenty liters of sample was concentrated to 2L, to which 2L of ultra-pure water was added. The diluted sample was again reduced in volume to 2L, and the process repeated a total of 12 times, until the no visible precipitate was observed with the addition of sample to 10 mg/mL silver nitrate. Desalted samples were lyophilized to a fluffy white powder.
Related Files
» Sampling_protocol_180324.docx
Elemental and isotopic analysis
Elemental and Isotopic characterization
Samples (typically 4-8 mg) were weighed into tin capsules (9 x 10 mm; Costech), which were carefully folded and submitted for analysis to the University of California, Davis, Stable Isotope Facility (http://stableisotopefacility.ucdavis.edu/). A description of the instruments and handling protocols can be found at: (http://stableisotopefacility.ucdavis.edu/13cand15n.html ). Each sample was run in triplicate with numerous sample blanks (folded tin capsules with no sample inside) interspersed throughout the analysis. In all cases, carbon and nitrogen in blanks were below the limit of detection. The freeze-dried samples were 30% by weight carbon with C/N of 13.1, d13C = -21.68‰, and d15N = 6.88‰.
Related Files
» Elemental_and_isotopic_characterization_180365.docx
Nuclear magnetic resonance spectroscopy
Related Files
» Nuclear_magnetic_Resonance_Spectroscopy_180345.docx

Proton NMR
Proton nuclear magnetic resonance spectroscopy: 1H NMR was performed on a Bruker AVANCE instrument at 400.13 MHz in D2O solvent with solvent suppression (zgpr). Chemical shifts were referenced to water at 4.8 ppm. Spectra (Figure 1) are similar to prior spectra collected on HMWDOM with major peaks at 5.21 ppm (O-C-O), 3.75 ppm (68%; H-C-OH), 2.77 ppm (2%; C-N-CH3), 2.04 ppm (11%; OOC-CH3), and 1.29 ppm (20%; O-C-CH3).
Related Files
» Figure_1_1HNMR_180264.jpg

Carbon-13 NMR
Carbon-13 NMR spectra were collected with broad-band decoupling at 100.61 MHz in D2O and a 200 Hz line broadening. Spectra (Figure 2) were similar to prior solid state spectra collected on HMWDOM with major peaks at 174.8 ppm (8%; O=C-N), 101.6 ppm (8%; O-C-O), 70.8 and 61.5 ppm (71%; H-C-OH; H-C-NH; C-O-CH3), 22.7 ppm (NOCCH3), and 16.7 ppm (O-C-CH3). Peaks at 22.7 ppm and 16.7 ppm contributed 12% of total carbon.
Related Files
» Figure_2_13CNMR_NELHA_2013_labeled_180244.jpg

Phosphorous-31 NMR
Phosphorus-31 NMR spectra were collected with broad-band decoupling at 161.98 MHz in D2O. Spectra (Figure 3) were similar to prior solid-state spectra collected on HMWDOM referenced to phosphate at 0 ppm with major peaks at 27.8 and 23.7 ppm (23% total area; C-P (phosphonate), 0 ppm (64%; C-O-P (phosphate and phosphate esters), and -10.2 ppm (14%; O-P-O-P (pyrophosphate))
Related Files
» Figure_3_phosphorus_labeled_180284.jpg

Heteronuclear Single Quantum Coherence (HSQC) Spectroscopy
Heteronuclear Single Quantum Coherence (HSQC) spectroscopy. 13C/1H heteronuclear correlation spectra (Figure 4 and 5) show strong cross peaks for fucose (15. 96 x 1.98 ppm) and rhamnose (17.23 x 1.25 ppm), N-acetyl amino sugars (H-C-N(O)C-CH3; 22.76 x 2.04 ppm and , H-C-N(O)C-CH3; 56.0 x 3.40 ppm and 58.4 x 3.36 ppm), and O-methyl sugars (C-O-CH3; 60-63 x3.47- 3.74 ppm).
Related Files
» Figure_4&5_HSQC_180265.jpg
Size Exclusion Chromatography
Related Files
» Chromatographic_Characterization_180364.docx

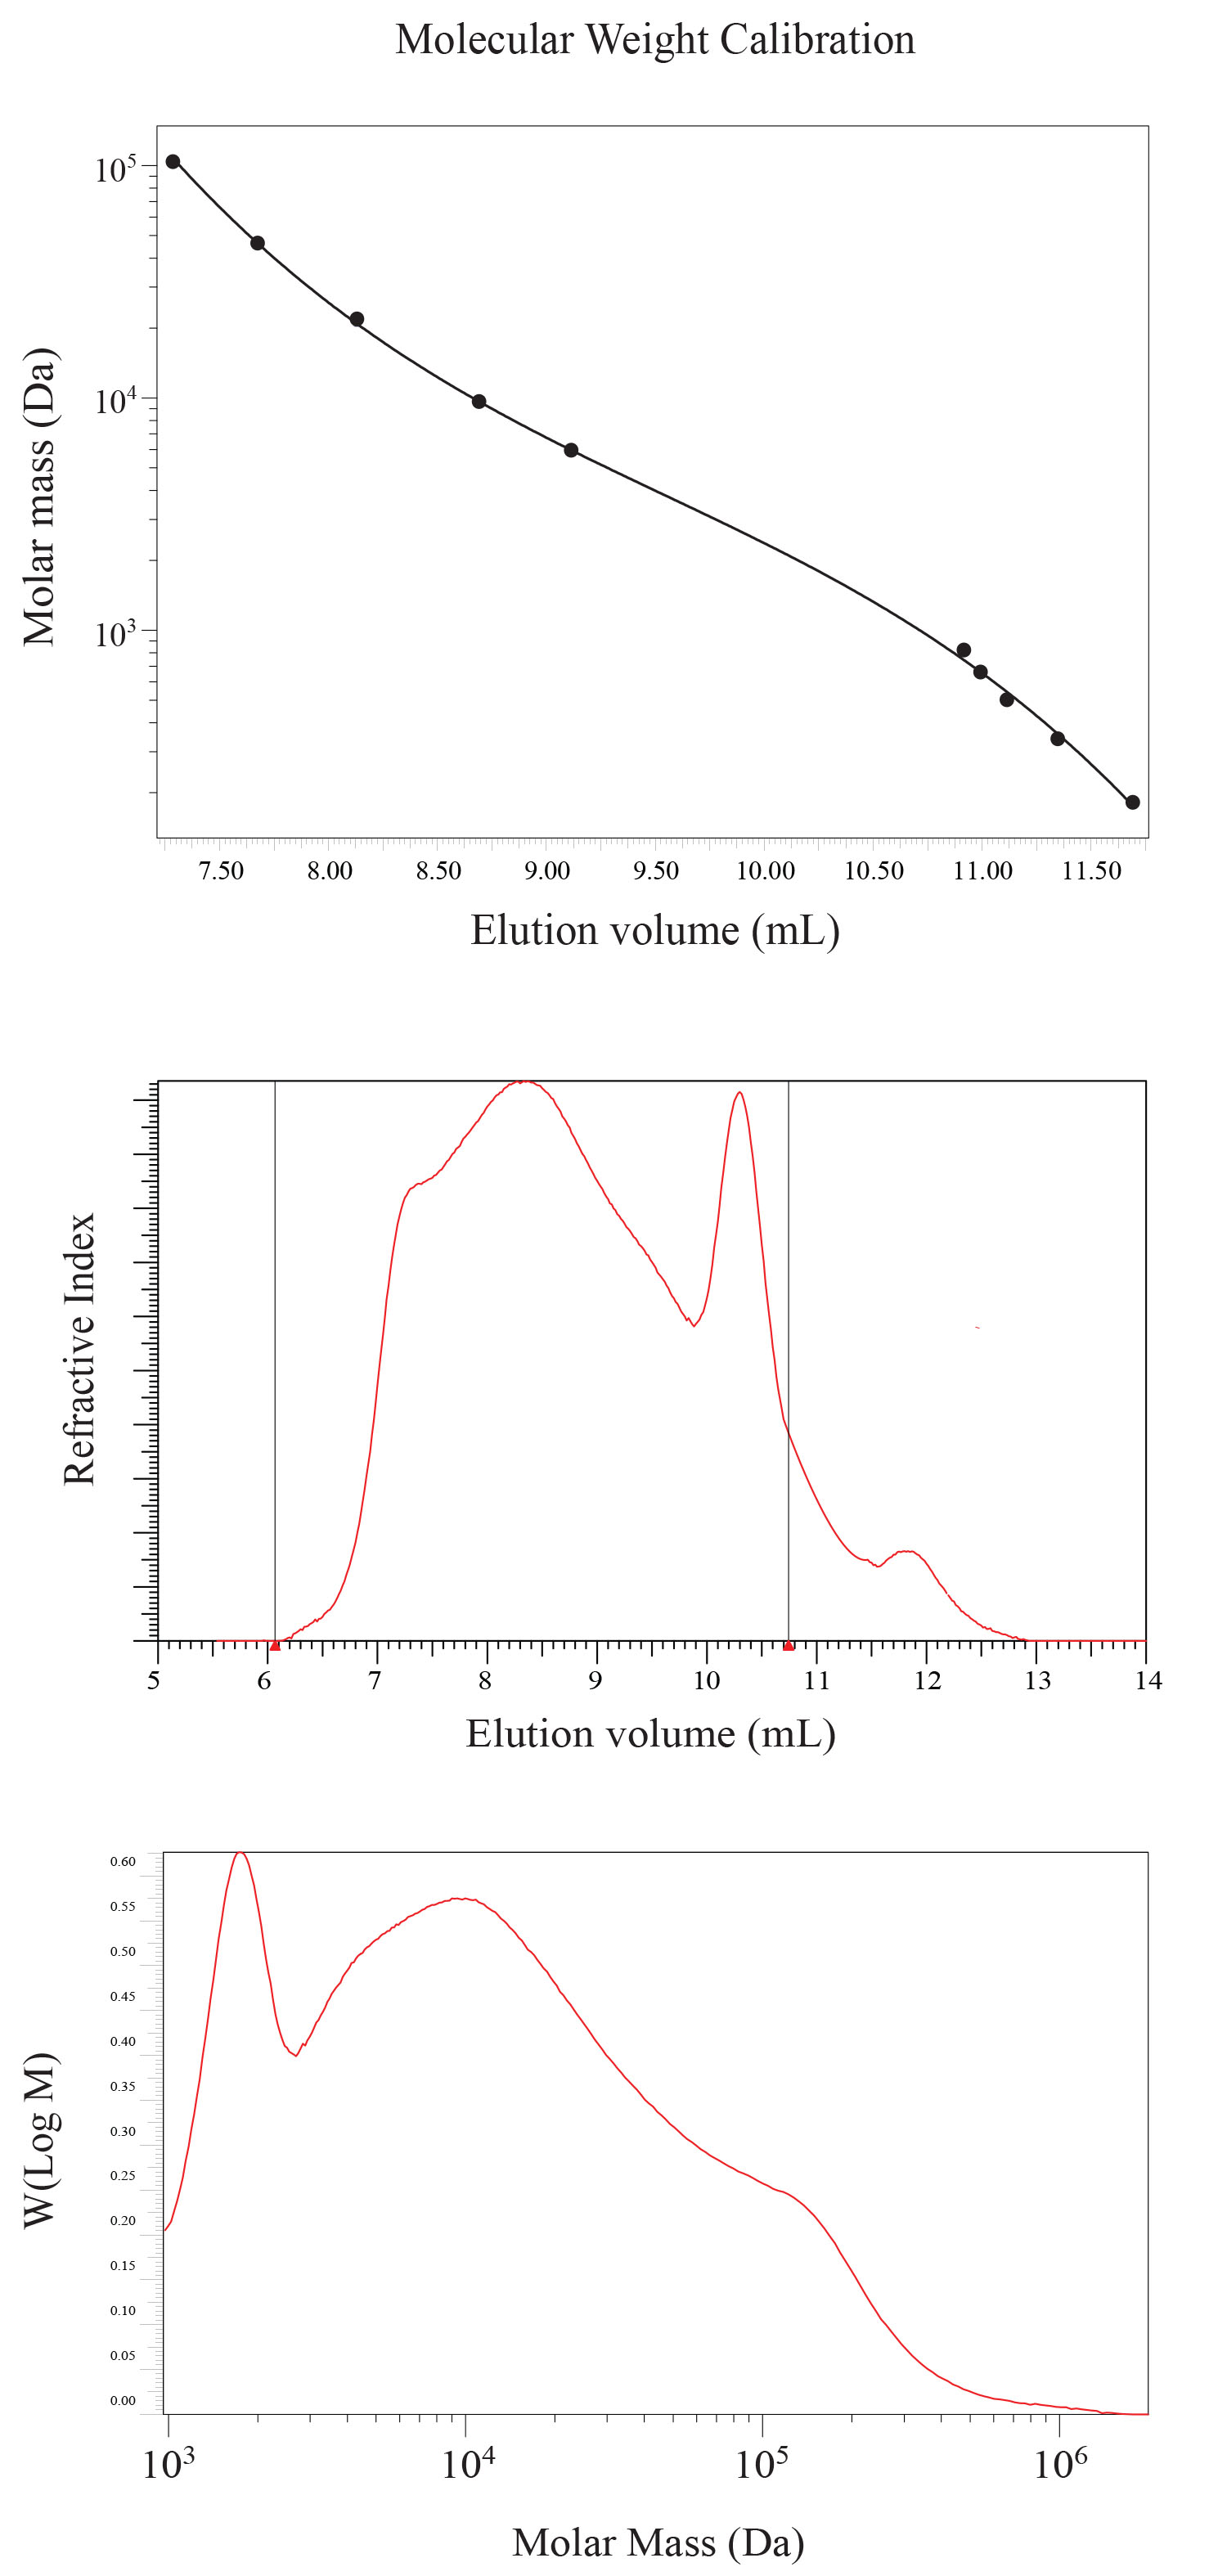
The molecular weight distribution of HMWDOM was determined by size exclusion chromatography (SEC) using two 8 mm x 300 mm NOVEMA Max 100 Å 10 micron columns (polymer standards services, Amherst, MA, USA) connected in series with an 8x50 mm guard column. The SEC columns were calibrated with pullulan standards ranging in molecular weight from 342 Da (DP-2) to 708000 Da (DP-4370) eluted in ultra pure water and detected by refractive index (Figure 6, top panel). To minimize interaction with the SEC column, HMWDOM was eluted in 0.1M NaCl in 0.1% trifluoroacetic acid (Figure 6, middle panel), and the results transformed into the molar mass distribution (Figure 6, bottom panel). Size exclusion chromatography shows a well-defined peak in molecular mass at ~2000 Da, and a broad distribution of molecular weights up to 1 x 10⁵ Da, the upper weight range of the column. Different molecular weight fractions were collected and characterized by proton NMR. Each fraction showed the same NMR spectra, suggesting aggregation is significant. SEC calibration data supplied by Derek Lohman at PSS.
Related Files
» Figure_6_SEC_180304.jpg