Skip to content

Metabolic profiling and bioactive organic compounds in laboratory pure cultures and seawater

Microbial ecosystems across large expanses of the global ocean are characterized by specific classes of marine phytoplankton. For example, diatoms are often abundant in high nutrient coastal waters, while cyanobacteria often dominate the nutrient-poor oligotrophic gyres. Bacteria live in association with these communities, consuming the dissolved organic carbon, nitrogen, and phosphorus that are by-products of marine primary production. In return, bacteria supply phytoplankton with essential organic nutrients such as vitamins and organically bound trace metals. Numerous studies have shown a loose symbiosis between microbial photoauto- and heterotrophs that is mediated in part by an exchange of dissolved organic matter. But of the tens to hundreds of thousands of organic compounds dissolved in each drop of seawater, what are the compounds that matter most to marine microbes?

To answer this question, we are characterizing dissolved organic matter in a number of model marine photoautotrophs with sequenced genomes. With support from the Gordon and Betty Moore Foundation, and from the NSF-CMORE Science and Technology Center, we grow bacteria-free, pure cultures of marine algae and cyanobacteria (Fig. 1), recover the DOM (Figs. 2, 3), and perform detailed chemical analyses by combined high pressure liquid chromatography-mass spectrometry (HPLC-MS; Fig. 4). HPLC separates the complex mix of DOM released by model microbes by their relative polarity (retention time), while MS separates constituents by their mass. The combination of retention time and mass define a “feature” which is either a pure organic compound or simple mixture of closely related compounds (Fig. 5).  We can compare features between cultures to discover unique or common compounds that can be targeted for further chemical analyses or used experimentally to screen for biological activity (Fig. 6). In a recent experiment we screened DOM from Prochlorococcus against a suite of bacteria that were isolated from Hawaii. We find only specific bacteria grow in response to Prochlorococcus DOM, and we are now searching through our database of Prochlorococcus isolates to identify specifically which compounds stimulate uptake. In parallel, we are analyzing the bacterial transcriptome to better understand what pathways the bacteria use to metabolize DOM.
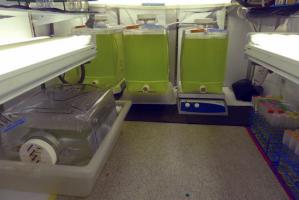
Clones of Prochlorococcus isolated by Penny Chishlom’s lab
Figure 1. Pure cultures of the abundant marine cyanobacteria Prochlorococcus. Clones of Prochlorococcus isolated by Penny Chishlom’s lab at MIT are grown under carefully controlled conditions and harvested for metabolic profiling of the cell material and dissolved organic matter.
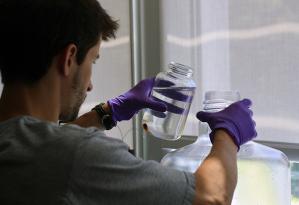
Joint Program student Jamie Becker prepares to separate cells from media of the diatom Phaeodactylm tricornutum.
Figure 2. Joint Program student Jamie Becker prepares to separate cells from media of the diatom Phaeodactylm tricornutum. We use a large volume centrifuge to separate the cells from the media, then do a final filtration step to remove any remaining cells before processing the sample.
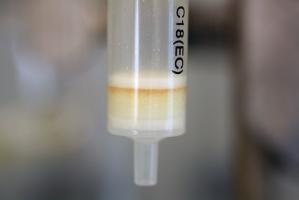
Solid phase extraction of the P. tricornutum spent media.
Figure 3. Solid phase extraction of the P. tricornutum spent media. The culture filtrate is passed through a short column packed with hydrophobic resin that extracts organic compounds from seawater. This photo shows the column after we have passage of the diatom culture filtrate.
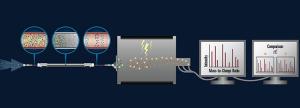
HPLC-MS. The sample consists of a complex mixture of metabolites released by the target photoautotroph into the culture medium.
Figure 4. HPLC-MS. The sample consists of a complex mixture of metabolites released by the target photoautotroph into the culture medium. Sample concentrates are added to the top of the HPLC column (left), and the different components move down the column at different speeds, such that pure compounds of simplified mixtures of compounds exit the column at different times. As they exit the column they are drawn into the mass spectrometer (center) where they are ionized and characterized by mass. The data is then processed to yield a list of “features” that can be queried for biological activity and differences between cultures.
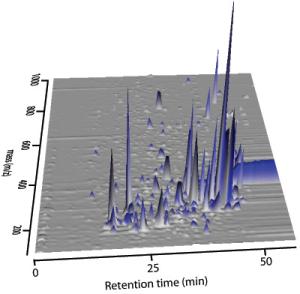
A typical HPLC-MS plot of data, showing chromatographic retention time on the horizontal axis, mass going back into the page, and intensity on the vertical axis
Figure 5. A typical HPLC-MS plot of data, showing chromatographic retention time on the horizontal axis, mass going back into the page, and intensity on the vertical axis. Each peak represents a “feature,” a combination of mass plus retention time.
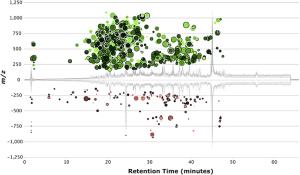
Metabolomic datasets
Figure 6. Metabolomic datasets are exceedingly complex, particularly when comparing results between samples, and we are interested in new ways to visual these complex datasets. Cloud plot of MIT9313 DOM and Pro99 medium, 802 “features” depicted with p-value ≤0.01 and fold change ≥4. Total ion currents for samples are shown in the background. Each circle indicates a “feature” with a unique m/z and retention time combination (displayed on the Y- and X-axis respectively). Features with increased intensity in the MIT9313 culture sample are shown on the top in green, while features with greater intensity in the Pro99 medium control are shown on the bottom in red. The area of each feature circle is proportional to the log fold change (i.e. larger area corresponds to greater fold change) and the color of each feature is proportional to the statistical significance of this change (Welch’s t test, unequal variances), where brighter features are more significant (i.e. lower p-value) than darker features (i.e. higher p-value). Features outlined in black indicate putative identifications exist in the METLIN database.