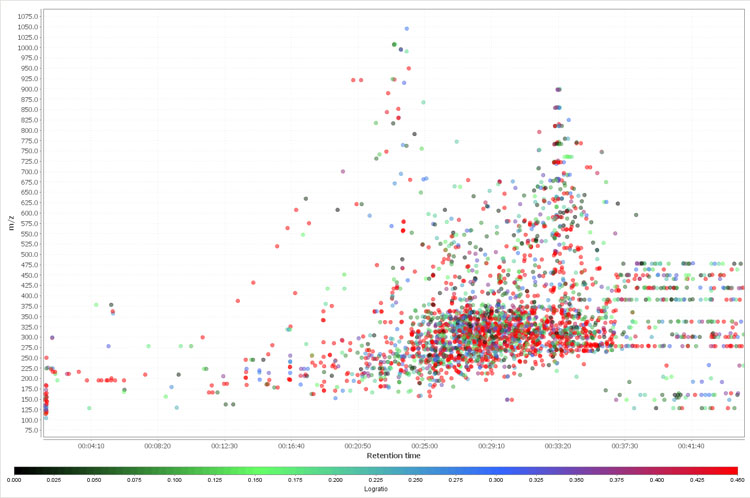
Analysis: All Species Comparison
Log-Ratio Comparison
This plot shows a comparison of the range of intensities for each retention-time / mass pair for all species studied thusfar. Points shown in red have greatest range of intensities as the species are compared, that is, they are occurs much more in some species than in other species. Points shows in black or green are generally present to about the same extent in all species.
