Tech Report 99-12 Data Processing
Ice-Ocean Environmental Buoy Program: Archived Data Processing and Graphical Results from April 1992 through November 1998
by Richard Krishfield, Susumu Honjo (Woods Hole Oceanographic Institution, Woods Hole, Massachusetts 02543), Takatoshi Takizawa, Kiyoshi Hatakeyama (Japan Marine Science and Technology Center, Yokosuka, JAPAN)
Acknowledgments
The authors would like to thank the Office of Naval Research (ONR; Code 322 High Latitude Programs) who has been the sponsor of the program, and the Japan Marine Science and Technology Center (JAMSTEC), partner of the program, for their support to the Ice-Ocean Environmental Buoy (IOEB) program, especially Dr. T. Curtin (ONR), and Dr. M. Hishida (JAMSTEC), and are grateful to Dr. D. Conlon (ONR) for encouragement to complete this report. We are deeply indebted to Dr. Terry Tucker of the US Cold Regions Research and Engineering Laboratory (CRREL) for his assistance and support . Valuable advice during the development of the processing scheme in this report was provided by Dr. A. Pleuddemann and K. Doherty (WHOI). Furthermore, R. Goldsmith and T. Danforth (WHOI) provided valuable programming experience. And we thank K. Brown for assistance with this documentation.
The success of this JAMSTEC/WHOI joint program would not have been possible without the extraordinary assistance of a number of people. Field support by John Kemp, Jeff Lord, and Lawrence Costello (WHOI) and Bill Bosworth (CRREL) is gratefully acknowledged, as well as Yoshi Sasaki, Koji Shimada, Toru Nakamura, Takashi Kikuchi, and Nob Koyama (JAMSTEC) for their support. This program could not have been completed without the support of the Space and Naval Warfare Command (SPAWAR) of the U.S. Navy who provided the AREA 92, 94, 96 and 97 ice camps, which were ably supplied by Polar Associates (especially Manor Buck and Ted Gooch), the 109th Air National Guard, and the pilots and engineers of Kenn Borek Air. In particular, we sincerely appreciate the execution of logistics by Imants Virsnieks, and we thank the Danish outpost in Nord, Greenland and the Mould Bay Weather station of Atmospheric Environment Service (AES), Canada for allowing their use as bases of operations. Support was also provided by the ONR LEADs Experiment (LEADEX) camp in 1992 and by the Surface Heat Budget of the Arctic Ocean Experiment (SHEBA). For these operations, the expert assistance of Andy Heiberg and others from the Polar Science Center, University of Washington, is acknowledged. We would also like to extend our appreciation to the officers and crew of the Sverdrup II, CCGIB Des Grosilliers and CCGIB Louis St. Laurent, for their support of IOEB field operations. We would like to give special mention to Dave Nasogaluak of Canadian Helicopters whos exceptional efforts expedited our field program, but regrettably died shortly after completing his work with us.
Table of Contents
Acknowledgments
Table of Contents
List of Figures and Tables
Abstract
I. Introduction
II. Description of IOEBs
III. Archived Data Processing
A. Data Acquisition
B. Computer configuration
C. Processing routines
1. Extract and sort data
2. Process location timeseries
3. Process data timeseries
4. Adjust data for drift
5. Screen data for bad points
D. Plotting routines
E. Output data availability
IV. Graphical Results
A. 1992 Transpolar Drift IOEB (T92)
B. 1992 Beaufort Gyre IOEB-1 (B92)
C. 1996 Beaufort Gyre IOEB-1 (B96)
D. 1997 Beaufort Gyre IOEB-1 (B97)
E. 1994 Transpolar Drift IOEB-2 (T94)
F. 1997 SHEBA IOEB-2 (S97)
References
List of Figures and Tables
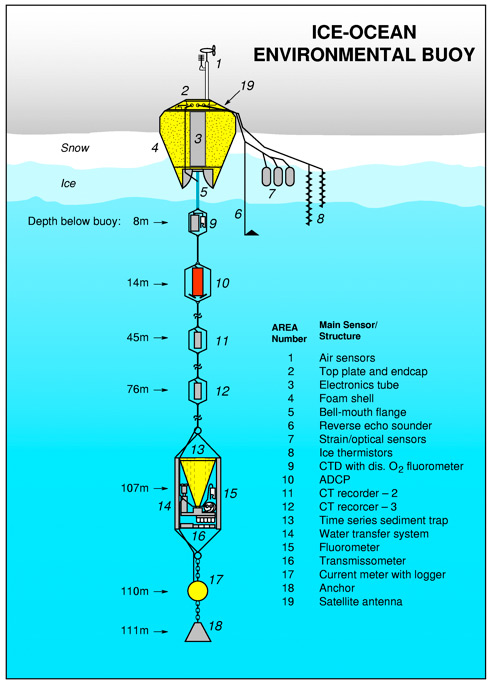
Figure 1: IOEB Schematic
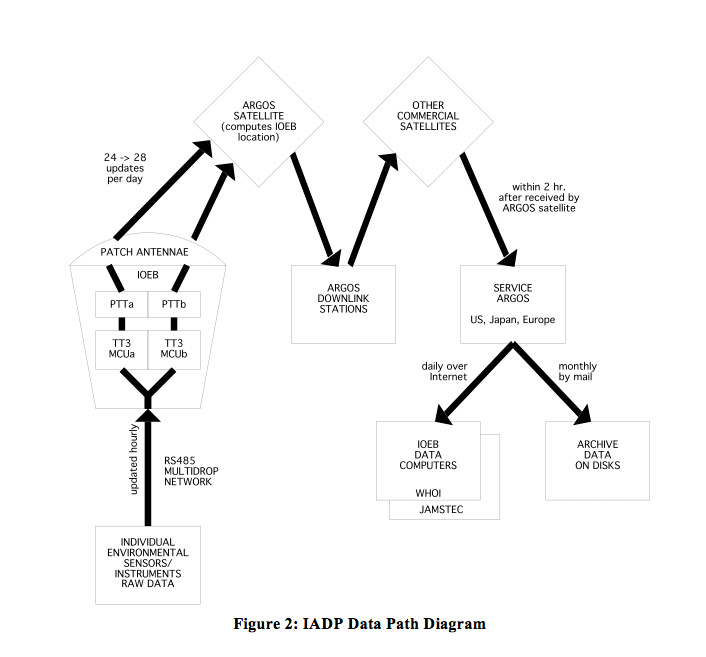
Figure 2: IADP Data Path Diagram
Figure 3: IADP Block Diagram
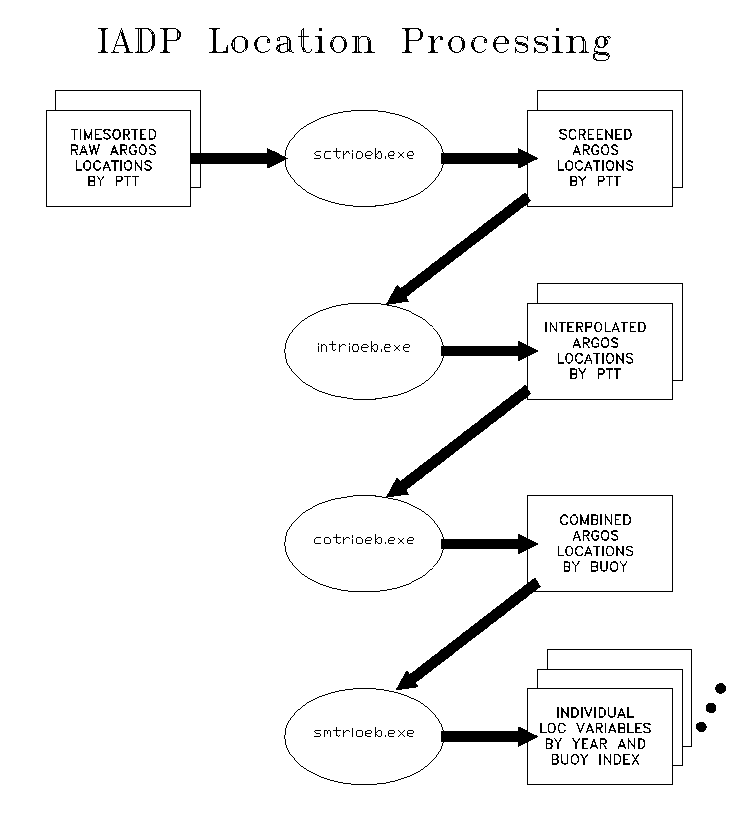
Figure 4: IADP Location Processing Diagram
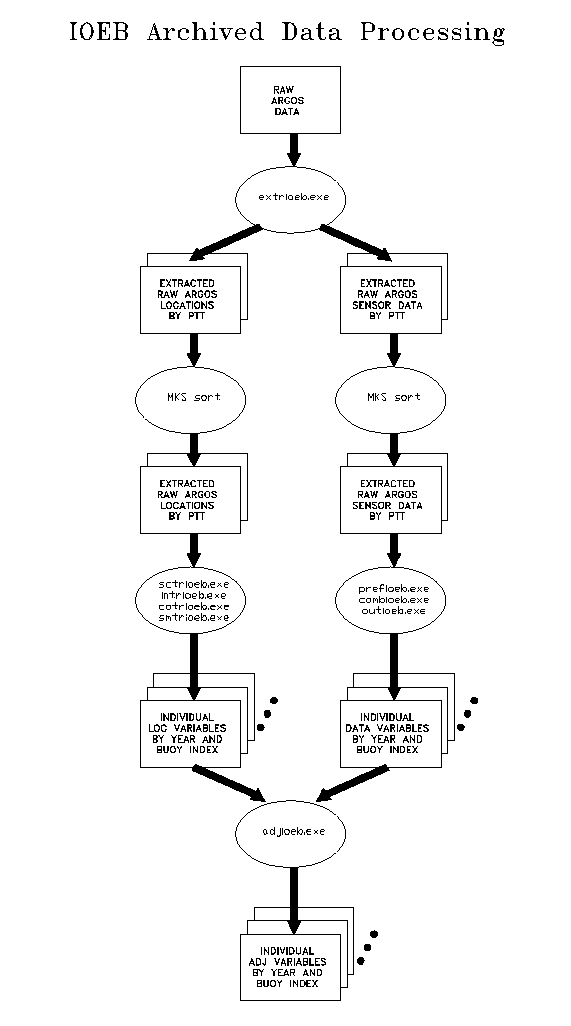
Figure 5: IADP Sensor Data Processing Diagram
Table 1: IADP Output Filename Format
Table 2: Table of IOEBs
Table 3: Table of IADP Telemetered Data
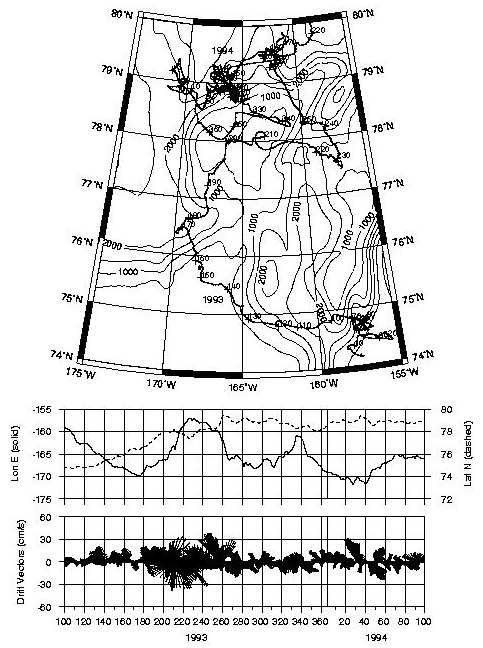
Figure 6: Drift tracks for all IOEBs from April 1992 through November 1998
Figure 7: T92 IOEB locations, drift vectors and current vectors at 110m below the ocean surface in 1992
Figure 8: T92 IOEB ice temperature profiles and upper ocean temperatures and salinities in 1992
Figure 9: B92 IOEB-1 total drift track from 1992 to 1996
Figure 10: B92IOEB-1 locations, drift vectors and wind vectors from 1992 to 1996
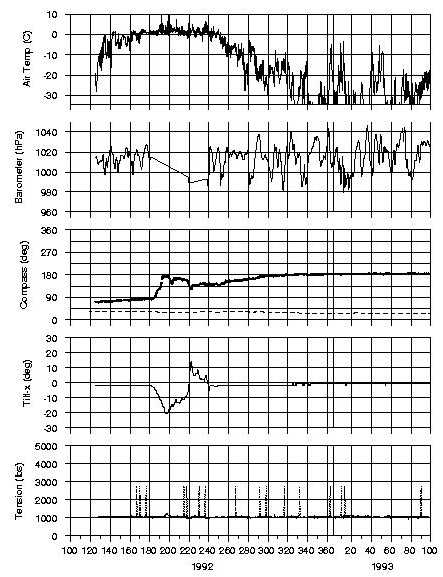
Figure 11: B92 IOEB-1 meteorological data from 1992 to 1996
Figure 12: B92 IOEB-1 ice temperature contours and upper ocean temperatures and salinities in 1992
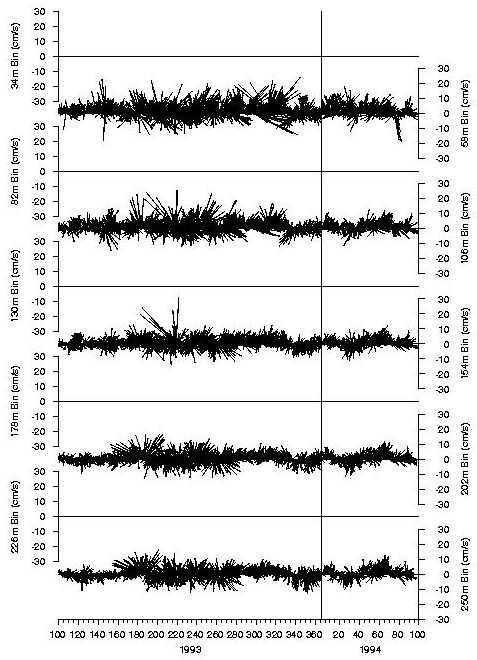
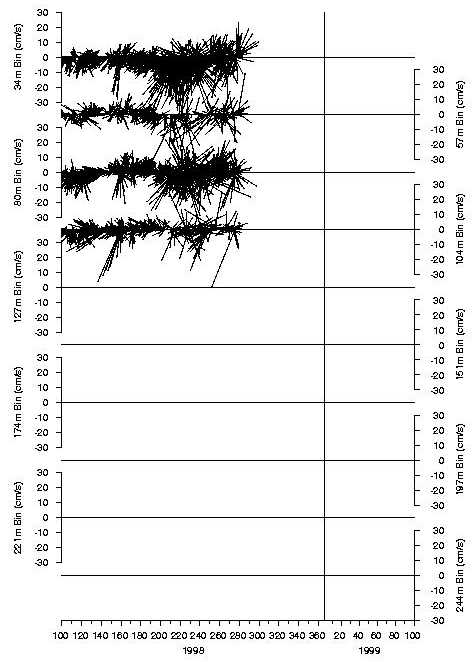
Figure 13: B92 IOEB-1 ADCP current vectors from 1992 to 1994
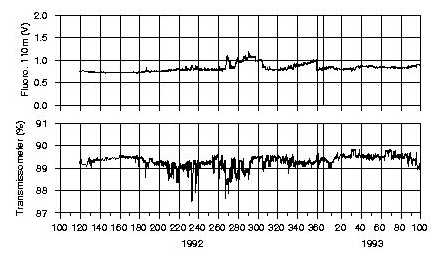
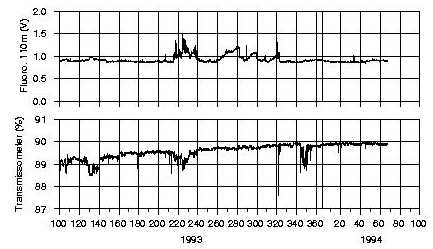
Figure 14: B92 IOEB-1 fluorometry and transmissometry from 1992 to 1994
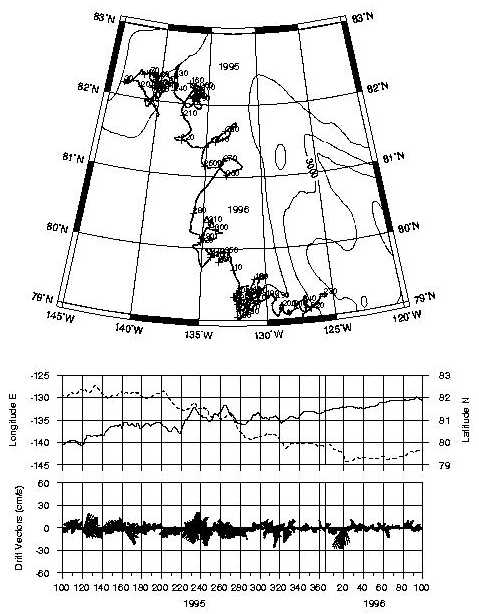
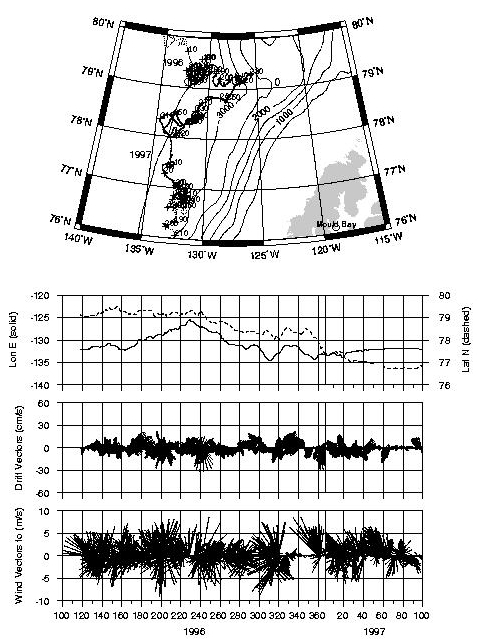
Figure 15: B96 IOEB-1 locations, drift vectors and wind vectors from 1996 to 1997
Figure 16: B96 IOEB-1 meteorological data from 1996 to 1997
Figure 17: B96 IOEB-1 ice temperature contours and upper ocean temperatures and salinities from 1996 to 1997
Figure 18: B96 IOEB-1 dissolved oxygen, fluorometry and transmissometry from 1996 to 1997
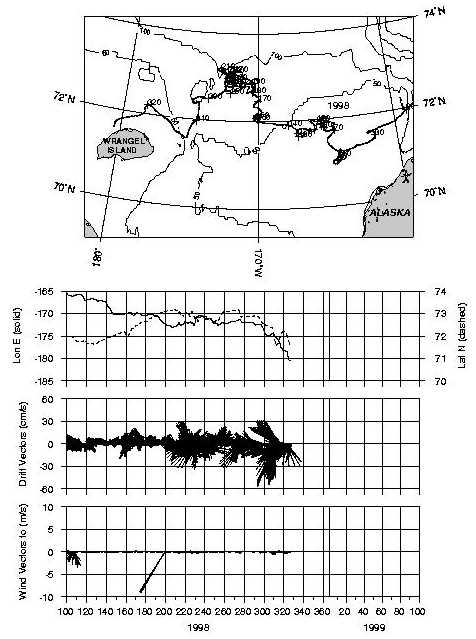
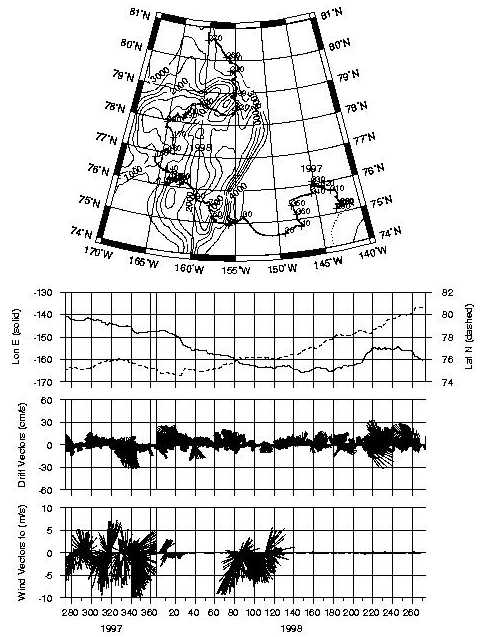
Figure 19: B97 IOEB-1 locations, drift vectors and wind vectors from 1997 to 1998
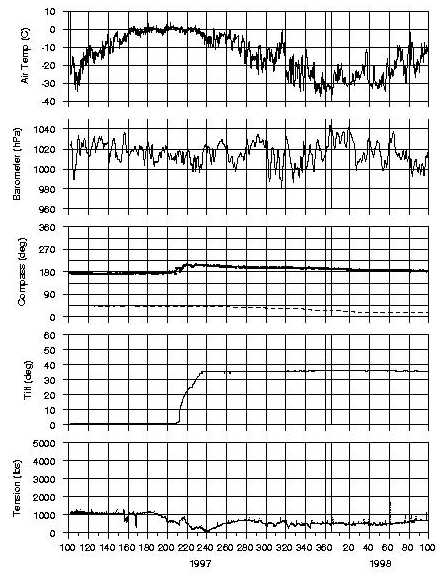
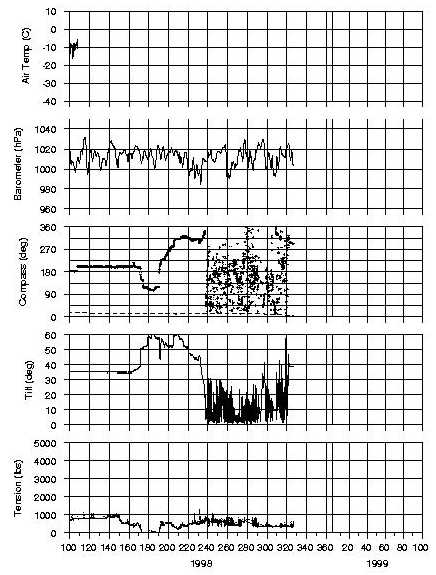
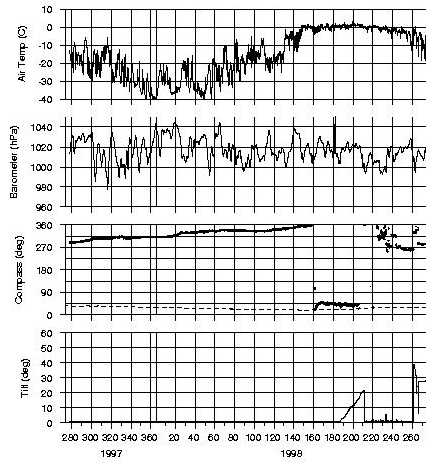
Figure 20: B97 IOEB-1 meteorological data from 1997 to 1998
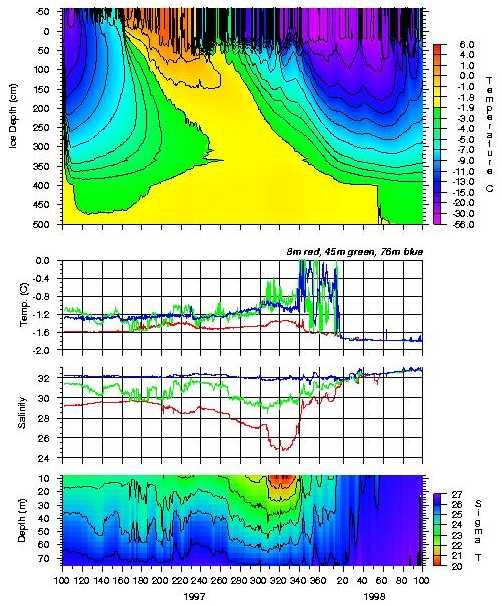
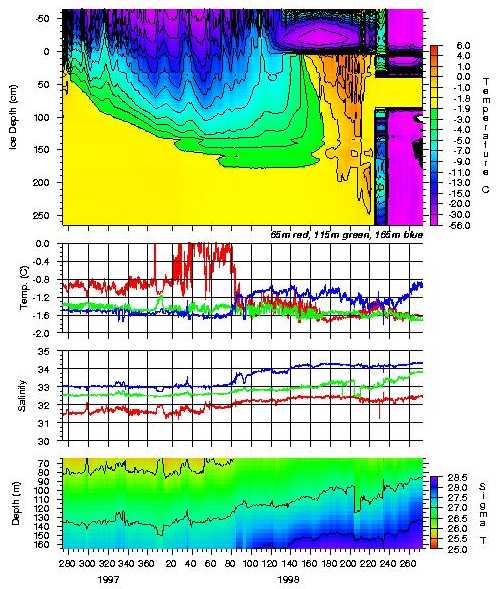
Figure 21: B97 IOEB-1 ice temperature contours and upper ocean temperatures and salinities from 1997 to 1998
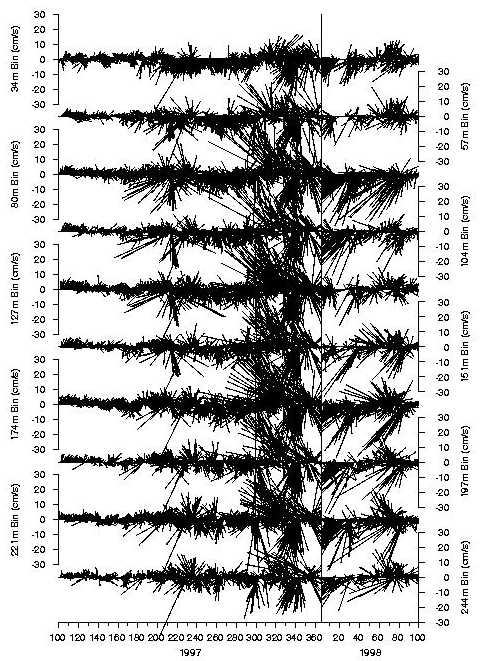
Figure 22: B97 IOEB-1 ADCP current vectors from 1997 to 1998
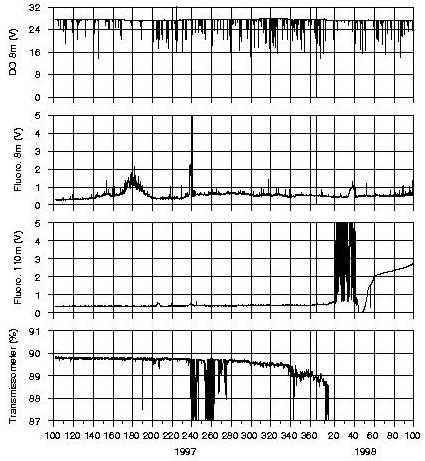
Figure 23: B97 IOEB-1 dissolved oxygen, fluorometry and transmissometry from 1997 to 1998
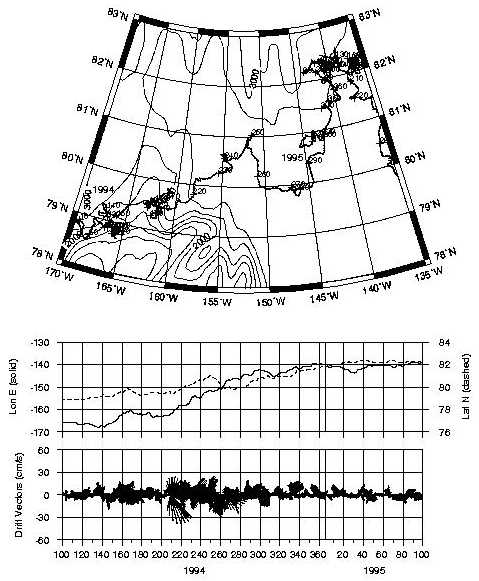
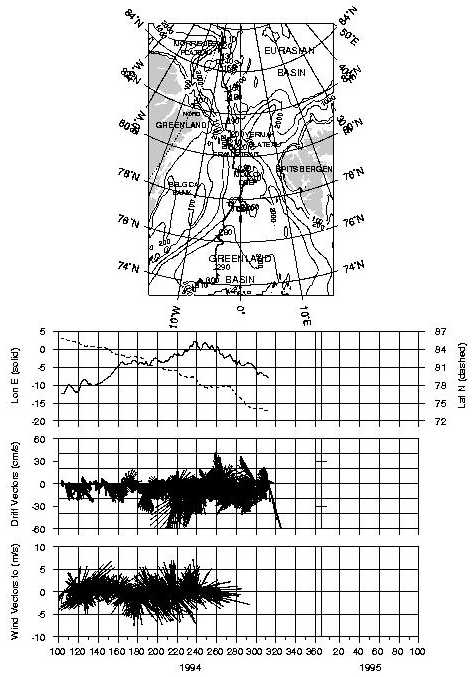
Figure 24: T94 IOEB-2 locations, drift vectors and wind vectors in 1994
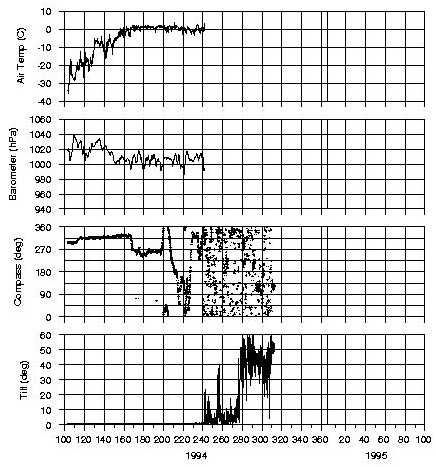
Figure 25: T94 IOEB-2 meteorological data in 1994
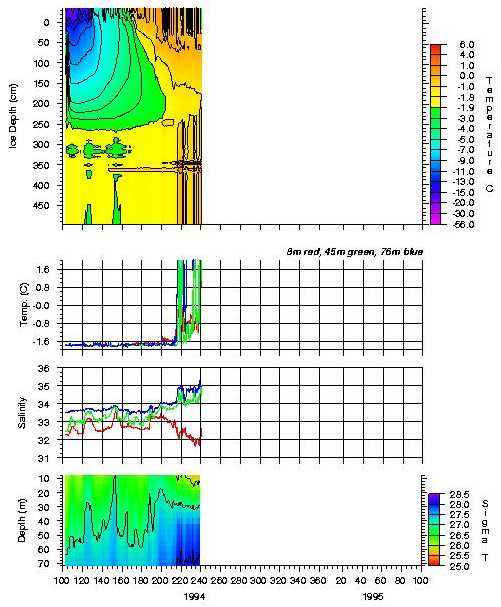
Figure 26: T94 IOEB-2 ice temperature contours and upper ocean temperatures and salinities in 1994
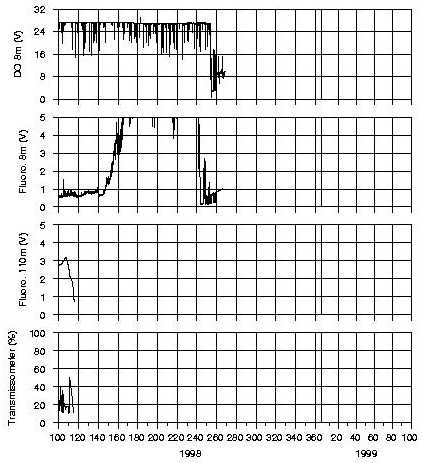
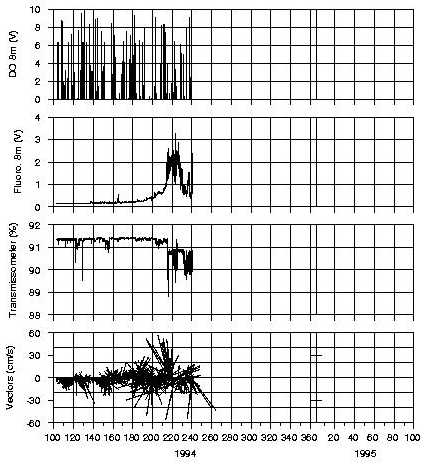
Figure 27: T94 IOEB-2 dissolved oxygen, transmissometry, fluorometry and current vectors in 1994
Figure 28: S97 IOEB-2 locations, drift vectors and wind vectors from 1997 to 1998
Figure 29: S97 IOEB-2 meteorological data from 1997 to 1998
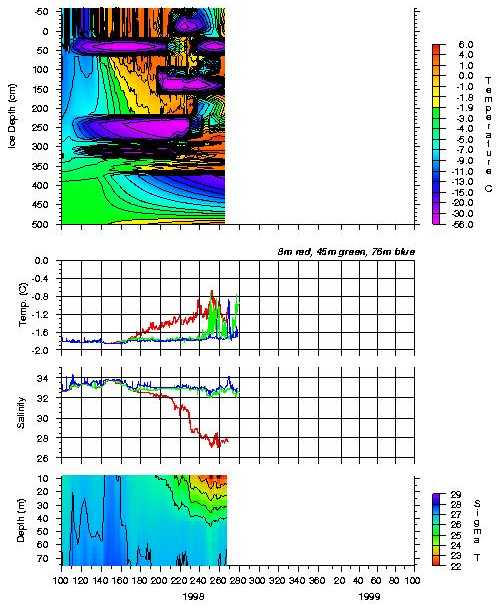
Figure 30: S97 IOEB-2 ice temperature contours and upper ocean temperatures and salinities from 1997 to 1998
Figure 31: S97 IOEB-2 dissolved oxygen, fluorometry and transmissometry from 1997 to 1998
Figure 32: B96, B97, and S97 drift tracks from 1996 to 1998
Abstract
Between 1992 and 1998, three Ice-Ocean Environmental Buoys (IOEBs) were deployed a total of six times on multiyear pack ice in the Arctic Ocean. The processing scheme for the telemetered environmental data, as well as the individual IOEBs and field operations, are described, and the processed data are presented in graphical form.
The IOEB Archived Data Processing (IADP) processing scheme was conceived specifically to remove noise in data telemetered from IOEBs caused by errors in network or satellite communications, and to calibrate to absolute values. The location data consists of Argos quality 2 or 3 positions from each platform transmit terminal (PTT) on a particular IOEB, which are subsequently screened, interpolated, and combined with similarly processed locations from the other PTT, and further smoothed with a 6-hr triangular filter to produce an hourly timeseries with a standard error estimated to be ~150 m. The sensor data is prefiltered, combined, adjusted for buoy drift, and screened with a Gaussian first difference filter to produce unevenly spaced timeseries of each variable measured by the IOEB. Every variable is output to a unique file per year, per buoy consisting of a two-column ASCII timeseries.
Drift and sensor data are presented from the 1992 Transpolar Drift IOEB which operated for only 4 months, IOEB-1 which drifted with the Beaufort Gyre in a large anticyclonic circle from April 1992 to November 1998, and IOEB-2 which drifted through the Fram Strait in 9 months in 1994, and in 1997-98 was redeployed concurrently with SHEBA at a distance 50 km from the main camp.
I. Introduction
Over one hundred years ago, Fridjtof Nansen guided the Fram across the Arctic in order to investigate a region of the ocean that was most poorly understood (Nansen, 1897). In fact, a predominant theory at that time suggested that an ice-free Polar ocean existed beyond the outer ice edge. However, the three-year journey of the Fram was conclusive in dismissing that theory, and instrumental in providing truly modern scientific observations that subsequently proved invaluable to our understanding of the Arctic regions, and oceanography in general. Nansen himself speculated that the environmental conditions of the Arctic could have a great effect on climate, but only recently has this view been seriously receiving public attention.
Today, global climate change is an active concern among scientists, policymakers and the public. In climate studies, the Arctic regions are important because it is believed that they are most sensitive to environmental changes, so that evidence of long-term trends may become apparent there first (Manabe et al., 1991). The feedback mechanisms of Arctic processes could accelerate climate changes; by influencing the global thermohaline circulation and the surface heat balance (Aagaard and Carmack, 1994), or the biogeochemical carbon cycle (Honjo, 1990). In fact, the Arctic is currently undergoing significant changes, as indicated by apparent warming and spreading of the subsurface Atlantic Layer of warm water more than 250 m below the icepack (Carmack et al., 1995), by thinning of the halocline layer (Steele and Boyd, 1998), by shifts in surface mean atmospheric pressure (Walsh et al., 1996), and by a recent decrease in the extent and thickness of multiyear ice in the western Arctic (McPhee et al., 1998).
To understand rapidly changing Arctic environmental conditions requires that comprehensive sets of physical, chemical, and biological data from the atmosphere, sea-ice, and ocean be obtained frequently and coherently throughout all seasons. Human expeditions, either by icebreaker, submarines or ice camps, are the primary means of collecting data in the Arctic. But these are typically limited in time and space, and are prohibitively expensive for long-term studies. Remote sensing techniques have been applied by both aircraft and satellites equipped with visible, infrared, and active and passive microwave sensors over broad areas (Comiso, 1995). Characteristics of the boundary layer between the ocean-air, and ice-air can be estimated globally using polar orbiting satellites, but observations cannot be made below the pack ice or into the depths of the ocean. Therefore, comparisons must still be made with in situ measurements.
Drifting buoys are an alternate means of providing valuable in situ data from the Arctic for long periods of time, with limited human supervision. For example, the International Arctic Buoy Program (IABP) is an international network of Arctic drifters that collectively monitor the drift of the ice pack, air temperature, and barometric pressure, for real-time operational requirements and research purposes. These data have already proven useful for studying the general pattern of the ice drift (Colony and Thorndike, 1984) and its correlation with the geostrophic winds (Thorndike and Colony, 1982). Furthermore, the US Arctic Research Commission has recently recommended the increased use of remotely operated autonomous platforms for long-term observations of the variability of the water masses (Schlosser et al., 1997).
With support from the Office of Naval Research and Japan Marine Science and Technology Center, an advanced multi-sensor system called the Ice-Ocean Environmental Buoy (IOEB) has been designed specifically to acquire numerous environmental data, in the harshest Arctic conditions, unattended for long periods of time (Honjo et al., 1995). This system differs from other Arctic drifters because it contains a full suite of underwater instruments throughout the upper ocean water column, in addition to meteorology and ice sensors. While the prototypes of the IOEB were originally designed for deployment by icebreaker, these and later units were redesigned to allow deployment via aircraft-assisted ice camp operations, as well.
Between 1992 and 1998, three IOEBs were deployed a total of six times on multiyear pack ice in the Arctic Ocean. In this report we briefly describe the IOEB technology, the processing scheme for the telemetered environmental data, the individual buoys and field operations, and provide graphical summaries of all the processed data. This document, the processed telemetered data, and further information are also available on the Internet at http://ioeb.whoi.edu.
II. Description of IOEBs
The basic configuration of the IOEB consists of a surface apex and 110 m (or 165 m) of suspended mooring instrumentation (Figure 1). The apex provides flotation for the mooring, and houses the surface electronics and batteries. The underwater mooring system is electronically and mechanically attached to the surface package by standard three-conductor mooring cable. Below the deepest instrument, an anchor provides tension on the mooring to reduce sailing of the underwater system. The IOEBs described in this report were all configured similarly, with only a few minor instrument and mooring length changes.
The surface electronics consist of dual Argos patch antennae, platform transmit terminals (PTTs), and network microcontrollers, and modules to acquire data from external meteorological and ice sensors. Due to the extreme cold Arctic temperatures, high energy density lithium batteries are used. The microcontrollers acquire data from all surface and underwater instrumentation and feed the compressed datastream to the PTTs. The
meteorological sensors consist of a wind monitor, air temperature sensor, barometer, magnetic compass and mechanical tilt sensor. Three ice-profiling thermistor strings consisting of a total of 33 thermistors are installed in the icefloe containing each IOEB. In addition, 3 internal ice stress sensors and an upward-pointed echo sounder have been tested on IOEBs.
Below the apex are typically three or four conductivity/temperature recorders at different depths, an Acoustic Doppler Current Profiler (ADCP; usually 150 kHz) near the surface pointed downward, one or two fluorometers, a transmissometer, a microfiltering water transfer system, a particle collecting sediment trap, and an electromagnetic current meter. A complete description of the technology of the IOEB is available in Woods Hole Oceanographic Institution Technical Report WHOI-93-45 (Krishfield et al., 1993), and in JAMSTEC Technical Report (Takizawa et al., 1995).
III. Archived Data Processing
IOEBs are deployed in one of the most difficult environments in the world to reach and exist in. These systems are not designed to be expendable, but the extreme cold temperatures and mechanical force of Arctic sea-ice make for greater risk of electrical or mechanical buoy failure than in more moderate climates. Consequently, the IOEB was designed to transmit a representative subset of the data collected by all its instruments, updated on an hourly or half-hourly basis. This makes the data available sooner, and ensures that at least some data from will be recovered from an IOEB, even if the system is not. Transmissions received by Argos satellites are decoded and relayed to our laboratory on a daily basis (Argos CLS, 1996). Here the data is archived and processed so that the “near-real” time operation of all the instruments and sensors on the buoy can be monitored throughout the installation. The method, which was created to operate on the raw telemetered data and produce calibrated, Earth-referenced output, is called IOEB Archived Data Processing, or IADP.
A. Data Acquisition
Every IOEB transmits an Argos datastream from two separate PTTs and antenna combinations every 1.5 to 2 minutes while sufficiently powered and operational. Depending on the number of Argos satellites, their orbit, and atmospheric conditions, updated data is acquired by Argos up to over 28 times per day, per satellite. This data is downlinked at certain spots, and transferred via secondary satellites to Argos processing centers in Europe and Maryland. Data is delivered to our laboratory from Service Argos in Maryland in two manners: using the Automatic Distribution System (ADS) over the Internet, and on floppy disks via mail (Figure 1). The ADS system developed by Argos accesses our server each day, and downloads a file with all the raw data throughout the previous 24-hour period. The ADS data is the same as the data mailed every month on floppy disk, except that the ADS data is in compressed form to reduce transmission time. The IADP processing programs discussed below can work either on the smaller daily or
The input raw Argos datafiles described here, cover a period of 88 buoy-months between monthly files individually, or combinations of these files into multiyear datasets at once. April 1992 and November 1998, and in compressed format occupy a total of 12 Mbytes of diskspace. After processing, the output occupies nearly 18 Mbytes in compressed format.
B. Computer configuration
The desktop computer used to write, compile, and document all the code, drawings, plots, and text described in this report was a PC-compatible system with a Pentium microprocessor. All software was optimized under the IBM OS/2 (Versions Warp 3.0 & 4.0) multitasking Operating System for PCs (IBM, 1995). However, the source code for all the IADP programs is written in highly portable C language (Kernighan et al., 1988) which facilitates translation to alternate platforms. In particular, nearly all the structures and functions should be directly portable to UNIX, except for parts of the directory naming and time structures. In fact, the Generic Mapping Tools (GMT; Wessel and Smith, 1995) programs used to generate all of the plots in this document were ported to OS/2 from UNIX with few difficulties. In addition, the Mortice Kern System (MKS) Toolkit (Version 4.2) of UNIX utilities (MKS, 1993) bridges the gap between platforms; in particular, the MKS sort.exe routine is used in our processing scheme instead of the OS/2 system sort.exe which cannot input the large files. The Borland C++ (Version 1.0) compiler for OS/2 (Borland, 1993) was used throughout for producing the executable programs from the code.
C. Processing routines
The programs that comprise the IADP system (.exe files) are all intended to be run in either a full screen or partial OS/2 command window, by entering the program name on the command line with operational parameters. If too few parameters are entered, a program will cease immediately and print an error to the screen. Programs also cease when they are unable to open some input or any output files. All of the IADP executable programs provide a means of generating operation logfiles by appending either /s for a short (summary) operation log, or /l for a long (itemized) operation log to the end of the command call. All the text directed at the screen can be redirected to a disk file using the redirection operator > filename to open a new file named filename, or >> filename to append to filename.
To automate a series of operations on the input, batch command files (indicated by filename extensions of .cmd) combine multiple programs and their input parameters in an ASCII text file. Here, batches are used to facilitate both processing and plotting the data. In batch files command line variables are indicated by a percent sign (%) followed by a number, while replaceable variables are indicated with two percent characters (%%) and a character. Some of the simple batch commands with self-evident functions that are used in the IADP scheme include: REM (remark statement), ECHO (to print to screen), CALL (to run another batch file from within a batch file), FOR (to repetitively call commands with one different parameter), and GOTO (jump to indicated line). By combining the various IADP executable programs and command files into batch files, automatic processing of the raw Argos data into accurate physical and environmental sensor data occurs (Figure 4). Subsequently, postscript representations of the data can also be automatically generated using GMT executable programs in plot batch files.
1. Extract and sort data
The first operation performed on the raw Argos datafile is the extraction of the IOEB locations and sensor data from Argos format into real numerical values. The program extriadp.exe performs this operation on a single input file; outputting separate location and data files for each PTT configuration file entered during the command call. The configuration file for a PTT contains processing information for extracting and converting all the sensor data from a datastream telemetered by a particular IOEB, including scaling and calibration information. The maximum number of PTTs that can be processed by one call to extriadp defaults to 4, but may be increased by redefining MAXPTTS in the file extriadp.h and recompiling. The output files are automatically constructed from the input PTT numbers by appending either lat.ext for locations, or tab.ext for sensor data. The program sequentially reads in a single line of the input file and processes the information, until the end-of-file is reached. There are no input parameters to delineate time limits at this stage of the processing. Detailed or summary descriptions of the operation may be printed to the screen by appending either /l or /s to the command call, or redirected to a disk file by further using the redirection operator > in conjunction with an output filename.
A sample command call to extract IOEB data from file input.raw for PTTs 1, 2, 3, and 4, with summary operations recorded in file ops.log would be:
extriadp input.raw 1.cfg 2.cfg 3.cfg 4.cfg /s > ops.log
The input file may be in either compressed or uncompressed Argos PRV formats. In our example, eight output files (besides the logfile) would be generated: ptt1lat.ext, ptt1tab.ext, ptt2lat.ext, ptt2tab.ext, ptt3lat.ext, ptt3tab.ext, ptt4lat.ext, and ptt4tab.ext. Each lat.ext file consists of 8 columns of location data: Argos program number, PTT number, date code, time code, Argos location quality, longitude (east positive), latitude (north positive), NOAA satellite letter, and PTT frequency in MHz. Each tab.ext file consists of a variable number of columns of sensor data, depending on the buoy sensor configuration and sequence number. However the first six columns always contain the data record information: Argos program number, PTT number, date code, time code, number of consecutive repetitions received by the Argos satellite with the same data, and the IOEB sequence number. The remaining columns (up to 59) contain the individual IOEB sensor variables as determined by the particular sequence number.
Extriadp loops through the input files by reading in a record as a string, and then performs a series of parses and checks to load the information into a record structure. The location data is treated separately from the sensor data. The output format of each variable is dependent on the resolution of the particular sensor. Records with sequence numbers of 0 or 7 are eliminated, as are records with zeros loaded in every raw hex value and transmissions consisting of only one repetition. If an input error is encountered anywhere, this information is available for logging, and the program continues back to the beginning of the loop.
Depending on the PTT configuration file, extriadp calls functions in convjarg.c to scale each data variable according to buoy specific information and calibrations. Convjarg.c in turn calls functions in prosens.c which are variable specific routines to process each particular sensor value. The program is intended to be expandable to include new PTTs and sensors from future IOEB buoys.
2. Process location timeseries
Four separate programs are used to convert the extracted IOEB locations to a smoothed interpolated drift track with a standard error of less than 200 m per location (Figure 5). The order of the operations is:
sctrioeb.exe, which screens the locations using a Gaussian filter for first differences exceeding a given number of times the standard deviation (std).
intrioeb.exe, which interpolates the locations to an 1 hour interval.
cotrioeb.exe, which combines the interpolated locations from separate PTTs into one IOEB buoy drift track.
smtrioeb.exe, which smoothes the drift using a 6-hour triangular filter, computes the Earth-corrected speed vectors of the drift and the geomagnetic declination, and outputs the results to separate files for each variable, and for each year, along with several files for plotting purposes.
Each program is capable of outputting the operation results to a monitor or disk file, in the same manner as described earlier. The first two programs output PTT location files with the same column and number format as are input: Argos program number, PTT number, date code, time code, Argos location quality, longitude (east positive), latitude (north positive), NOAA satellite letter, and PTT frequency in MHz. The combined drift track is similar to the above, with the omission of the last two columns, which have no meaning when combined. The files output after smoothing are, with few exceptions, two-column timeseries which include the decimal day of the year (with fractional time) in the first column, and a value in the second. Day of the year extends from 1 to <366 on non-leap years, and to <367 on leap years. The calculated speeds include the Earth’s curvature, while the geomagnetic declination is based on the program GEOMAG.FOR from the Geomagnetism Group of the National Geophysical Data Center (NGDC). Based on the IGRF model (IAGA, 1991), this program outputs seven magnetic field parameters, including the magnetic variation with an stated accuracy of ~1/2 degree. A positive angle means that the horizontal component of the geomagnetic field is east (clockwise rotation) of true north. Files with speed vectors or text data for plotting using GMT generally have more than two columns, being generated to suit particular plotting routines.
3. Process data timeseries
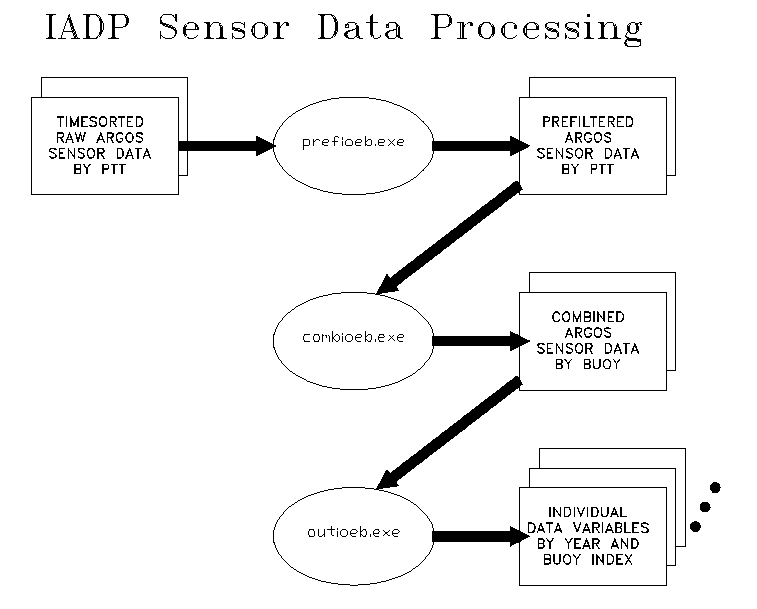
Three programs are used to prefilter, combine, and output the extracted IOEB sensor data into multiple separate timeseries of each data variable per buoy (Figure 6). These operations are accomplished by:
prefioeb.exe, which prefilters and timecodes the sensor data without regard to the actual sensor meanings.
combioeb.exe, which combines the prefiltered data from separate PTTs into one IOEB datafile, while checking for NULL data values and other errors.
outioeb.exe, which outputs separate files for each sensor variable, and for each year. Each program is capable of writing the operation results to a monitor or disk file, in the same manner as described earlier. The output format of the prefiltered data is the same as
input: Argos program number, PTT number, date code, time code, number of consecutive repetitions received by the Argos satellite with the same data, the IOEB sequence number, and up to 59 columns of data. Each record of data after the sequence number is treated as a single string for comparison purpose, and like strings are combined if they are merely repetitions within a certain timelimit. In the end, only one record is saved for each series of scans in a new data sequence, according to the accumulated number of repetitions. If only 1 accumulated repetition exists for a particular data sequence, then that data usually includes broadcast noise and is not included. Each data scan has its acquisition time determined from a simultaneous determination of interpolated controller sequence shifting times.
As prefioeb inputs the sensor data, it tracks all moments when the IOEB microcontroller switches sequences within a two minute time period while an Argos satellite was actively monitoring the buoy. This rather complicated scheme is necessary, because not all instruments broadcast a timecode, and the microcontrollers do not switch sequences at exactly hourly intervals, but vary slightly. The accuracy of the acquisition time coding becomes extremely important when removing the drift of the buoy from observed speeds detected by some sensors. The operation results log show that the method of time coding applied by prefioeb appears to work very well.
Combioeb takes data from both PTTs on a single buoy, flags the NULL values and outputs the best dataset to a single file. The first five columns output contain the same format as the prefiltered input. However, the sensor data output is standardized so that an IOEB without an ADCP will have 81 additional columns of sensor data, while one with will have 141 additional columns, where column represents a separate data variable. When combioeb reads in a record from a PTT data file, it parses each data item separately and loads it into a sensor dependent position in the floating-point data array. Array variable 0 is written to column 6 of the output file when processed, and each next variable incrementally thereafter. Each data group is separately checked for NULL values and all zeros by specific functions within combioeb. All IADP programs assign a value of -9999.999 to NODATA for NULL points.
Outioeb simply loops through the combined buoy datafile once for each sensor variable and outputs a separate two column for each variable for each year, which includes the decimal day of the year (with fractional time) in the first column, and a value in the second. NULL values are not output. The include file outfile.h contains the names array used to build the output filenames from the variable number. This program is the slowest program in the IADP suite of programs, especially for large input files.
In 1996, a platform specific version of outioeb was required to account for additional electronic current meters on this particular IOEB mooring. Called outi96, this program operates in the same manner as outioeb, but includes several additional filenames.
4. Adjust data for drift
After the location data has been processed into a smooth hourly interpolated series, and the sensor data prefiltered and output, then specific corrections can be applied to selected variables to remove the effects of the buoy drift speed and geomagnetic declination. This applies to the wind monitor data, ocean current data, and compass data. These adjustments are performed by the program adjioeb.exe, which additionally calculates the combined magnitude of apex tilt from the x and y components, and corrects (roughly) for an error in data transmission software of the 1992 IOEB barometer data.
There are three steps in the correction procedure that needs to be made to the raw transmitted IOEB wind monitor data to convert it to true “wind” velocity referenced in an x-y plane. The first step consists of all the mechanical and electronic adjustments that are performed to reference the wind direction to geomagnetic north. The second step applies the geomagnetic correction to provide a result referenced to true (or Earth’s) north. Finally, to provide output that can be directly compared to simultaneous ice drift and ocean velocity data (also provided by the same IOEB), the third step changes from an Earth referenced to an x-y coordinate system to indicate the direction and compute the individual component vectors. Keeping with convention, the direction that the wind travels is considered in the meteorological sense, so that a wind current of 180° is considered to come from the south. This is opposite to how the directions of ice drift and ocean currents are portrayed (oceanographic sense). In addition, all our calculations assume the units of degrees, instead of radians.
Electronically, the IOEB raw wind direction measurement represents the output from a variable resistor controlled by the mechanical wind vane. Conditioning electronics supplied by the sensor’s manufacturer output a very precise voltage between 0 and 5 V, proportional to the direction. Ten times during the first ten minutes of every hour, the analog signal output from the wind monitor is digitized and temporarily stored. The ensemble is averaged and the result output by the meteorological data logger module to each microcontroller unit. Via Argos transmitters, the raw wind direction is transmitted as an 8-bit number, which represents values between 0 and 360°, resolving each 1.4°. It is this raw wind direction that is received in our laboratory and used to determine the real wind direction.
As an IOEB drifts, the surface apex is free to rotate and consequently, the mast securing the wind monitor also rotates. A magnetic compass located in the apex measures this rotation with respect to geomagnetic north. Consequently, to derive geomagnetically referenced wind direction, the magnetic compass measurement must be added to the raw IOEB wind direction. Furthermore, for mechanical mounting purposes, the magnetic compass and wind monitor are offset by 40°, requiring the subtraction of this value from the above. Using wd for raw wind direction, and wdc for corrected wind direction, we can write the first step of the wind direction correction in equation form as:
wdc = wd + compass - 40
The second step of the correction involves correcting for the geomagnetic declination that changes over time, and as the location of the IOEB changes. As indicated earlier, the IGRF model is incorporated into our processing routines to determine the angle of declination in degrees based on the year and the drift location of the IOEB. This declination is added to our previous corrected wind direction:
wdc = wd + compass - 40 + declination
This result is sufficient to describe the direction of the wind in terms of “true” geomagnetic north, but to determine the north and east components, conversion to an x-y coordinate system is preferred.
Changing coordinate systems in effect changes the intercept and direction of rotation of the wind vectors in vector space. Whereas the geophysical system is oriented with 0° upward (or north) and increase clockwise, mathematical systems generally orient 0° to the right (or east) and increase counter-clockwise. In sum, subtracting the direction in the geophysical sense from 90°, converts to the angle to the mathematical sense. This makes the resultant wind correction equation:
wdc = 90 - (wd + compass - 40 + declination)
or
wdc = -wd - compass - declination + 130
From the raw wind speed (ws) and the corrected wind direction, wind components in the horizontal and vertical directions can be computed:
wx = ws * cos(wdc)
wy = ws * sin(wdc)
In most cases, the above equations are sufficient to describe the velocity of the wind. Since the IOEB is drifting, however, the movement of the buoy affects the apparent wind measured by the wind monitor. Because the drift speed is usually less than one-tenth of the wind speed, it can be neglected, but for increased accuracy we account for it by adding the components of drift to the corresponding components of the wind. Using Ux and Uy to represent the components of the IOEB drift, and Wx and Wy to represent the resultant wind components we determine the final absolute wind values:
Wx = ws * cos(wdc) + Ux
Wy = ws * sin(wdc) + Uy
and by geometry:
Ws = sqrt(Wx2 + Wy2)
Wd = arctan(Wy/Wx)
The instruments that measure ocean currents on the IOEB each contain their own compass and transmit Earth referenced vectors of the detected currents. Consequently, the geomagnetic declination needs to be removed, as does the buoy drift. Similar to the process described for the wind, the declination is added to the current direction computed from the east and north vectors, the vector components recomputed, and the drift speed added. Maintaining both meteorological and oceanographic traditions, ocean (and ice) currents are described in the opposite direction from wind currents. Whereas, the buoy (and icefloe) drift speed is an order of magnitude less than the wind speed, it is frequently the same order as the ocean currents thus absolutely requiring removal for any meaningful results. Due to the 150m Argos positioning error, however, we have determined that the calculated ocean vectors still have an uncertainty of 2 to 3 cm/s. This is rather large compared to typical Arctic abyssal currents, but is still useful for detecting higher energy disturbances, such as eddies.
The magnitude of the apex tilt is determined by vector addition of tilt x and tilt y components. However, due to a software programming error, the B92 barometer data was sometimes overwritten by tilt data, so its absolute precision is worse than in later IOEBs. The raw data stored in the Meteorological Module of this particular IOEB was influenced by the tilt y data. Consequently, when the tilt y sensor was slightly positive, the barometer was biased +32. When tilt y was slightly negative, it had no effect. Otherwise, its effect could not be reasonably determined. Because tilt y was not being broadcast due to the same software error, determining exactly when and how the data is being influenced is impossible. In order to retain some of the information from this barometer, however, we matched the transmitted data to barometric charts from the same time period to determine which correction factor to apply. Furthermore, the barometer data is omitted whenever the tilt x sensor indicates any tilt, because of the increased uncertainty.
5. Screen data for bad points
The final step employed in the IADP scheme is the removal of extreme outlying points in each timeseries of sensor data, using a Gaussian (normal) filter on the first difference. The program scndata.exe was developed to employ a n-sigma cutoff filter on a series, within a given time interval (within one calendar year). For polar degree data, a vector form called scrnpdat.exe performs the same function. Besides the input and output filenames, the time interval (entered in year, and day of year for both start and end times) is included with the command call, as is the cutoff sigma number (usually 4 in this report). Because different sensors on IOEBs operate for different times, a unique batch command file for each buoy is used to repetitively call either scrndata or scrnpdat with different arguments, once for each sensor to be screened per year. Most data is screened with a 4 std filter, however the B92 ice thermistor data was particularly influenced by noise erroneously created by SeaCats on that particular mooring system, so that data is screened with a 0.2 std filter. The correction of this problem is evident on the T94 IOEB, where similar ice data was screened with a 4-sigma cutoff, without any apparent glitches.
Also included in the command file, a number of calculating programs compute speeds, directions, and vector components from indicated files (calcsd.exe, calcuv.exe, calcvec.exe, calcdens.exe). Finally, three matching programs remove data with unmatched timecodes according to different variations of input files (match1ts.exe, match2ts.exe, matchxts.exe).
D. Plotting routines
GMT Version 3 is used to create all the plots in this report. This free, public domain software package is available over the Internet (ref. Wessel and Smith, 1995). It is designed to manipulate columns of tabular data, time-series, and gridded data sets, and display these data in numerous forms, ranging from simple x-y plots to maps and color, perspective, and shaded-relief illustrations. Output is in the Postscript language (Adobe, 1990), which is a versatile language for printing to a large number of devices. Written in the C programming language as a set of UNIX tools, it was recompiled to operate under OS/2 with only minor modifications.
Batch command files are used to plot all the data for a particular IOEB for each year. The drift tracks are plotted on a polar stereographic projection map, with superimposed coastlines, bathymetry, and text. Both the coastline (World Data Bank II) and bathymetry (ETOPO-5) data are from the NGDC. The rest of the plots are straightforward x-y representations of the timeseries data. The x (time) scaling is uniform, to allow visual comparison between different data. In some cases the y scales are non-uniform or nonlinear, in order to highlight specific features of the data. With one exception, all the data presented are screened with a 4-sigma cutoff.
E. Output data availability
A complete description of the IADP processing scheme, all the source code and command files, the output dataset, postscript plots of the data, runtime files of operations, and descriptive text and drawings programs are all available on the Internet at address http://ioeb.whoi.edu, or by ftp. Files are available in both .zip format for PCs and tar.Z format for UNIX systems. A complete description of the contents of each of the files is accessible from the IOEB homepage, and exists as a text file in the ftp directory. Unzipping the program, source and plot files in the directory \iadp will cause the IADP files to be automatically placed in the correct directories. Most of the individual unzipped output files are two column files where the first column contains the decimal day of the year, and the second column the variable measurement. Table 1 indicates the filenaming conventions output by the IADP programs.
Table 1: IADP Output Filename Format
Filename = prefix + yy (s) . ext
where prefix is defined below
yy = two number year
ext = buoy id extension
s = subscript c for drift corrected, r for recovered, s for screened, t for temporary
Example:
a0e1_92c.b92 = 92 BGY IOEB: drift corrected ADCP/DPM 0, bin 1, east vector for 1992
Prefixes Sensor/Environmental Variable Units
aXbf_ ADCP/DPM X: bin flag bit
aXct_ ADCP/DPM X: counter bit
aXeN_ ADCP/DPM X: raw east vector for bin N cm/s
aXen_ ADCP/DPM X: ensembles number
aXhv_ ADCP/DPM X: heading variability deg
aXqN_ ADCP/DPM X: status bit N bit
aXnN_ ADCP/DPM X: raw north vector for bin N cm/s
aXt_ ADCP/DPM X: temperature deg C
aXtv_ ADCP/DPM X: tilt variability deg
aXvN_ ADCP/DPM X: vertical vector for bin N cm/s
aXxN_ ADCP/DPM X: error bit N bit
comp_ Apex compass = MHE + DECL deg
conN_ MCU controller N battery voltage V
decl_ Geomagnetic declination derived from locations deg
drift_ Drift track (lon, lat) deg, deg
fl_ Fluorometry at 110 m V
ibv_ ICE: battery voltage V
iday_ ICE: day code number
Prefixes Sensor/Environmental Variable Units
iech_ ICE: echo sounder m
ihr_ ICE: hour code number
isNa_ ICE: stress sensor N, sigma-1 kPa
isNb_ ICE: stress sensor N, sigma-2 kPa
itN_ ICE: temperature sensor N deg C
lat_ Drift latitude timeseries deg
lon_ Drift longitude timeseries deg
mat_ MET: air temperature deg C
mbar_ MET: barometric pressure hPa
mbv_ MET: battery voltage V
mday_ MET: day code number
mhe_ MET: raw compass heading deg
mhr_ MET: hour code number
mtav_ MET: average tensiometer lbs
mtmx_ MET: maximum tensiometer lbs
mtst_ MET: std of tensiometer lbs
mtx_ MET: apex tilt x deg
mty_ MET: apex tilt y deg
mwd_ MET: raw wind speed m/s
mws_ MET: raw wind direction deg
pttN_ MET: raw compass heading V
s4c_ S4: raw conductivity mmho
s4d_ S4: raw sigma-theta
s4e_ S4: raw east vector cm/s
s4n_ S4: raw north vector cm/s
s4s_ S4: raw salinity PSU
s4t_ S4: raw temperature deg C
scNc_ SC N: raw conductivity mmho
scNd_ SC N: raw sigma-theta
scNs_ SC N: raw salinity PSU
scNt_ SC N: raw temperature deg C
scdo_ Dissolved oxygen at 8 m
scfl_ Fluorometry at 8 m V
st_ Sediment trap status number
tr_ Transmissometry at 110 m %
ud_ Processed buoy/ice direction deg
ue_ Processed buoy/ice east vector cm/s
un_ Processed buoy/ice north vector cm/s
us_ Processed buoy/ice speed cm/s
uvec_ Processed buoy/ice plot vectors
vd_ Processed 110 m direction deg
ve_ Processed 110 m east vector cm/s
vn_ Processed 110 m north vector cm/s
vs_ Processed 110 m speed cm/s
vvec_ Processed 110 m plot vectors
wd_ Processed wind direction deg
we_ Processed wind east vector m/s
wn_ Processed wind north vector m/s
ws_ Processed wind speed m/s
wtse_ Water transfer system event number
wtss_ Water transfer system status number
wvec_ Processed wind plot vectors
IV. Graphical Results
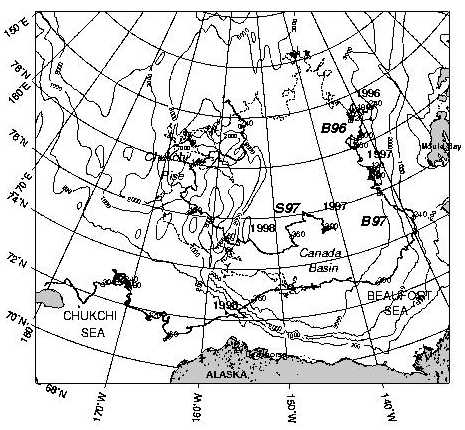
Between 1992 and 1998, three IOEBs were deployed at various times in remote regions of the Arctic pack ice (Figure 7). A 3-letter acronym, based on the region and year deployed, is assigned to identify each individual buoy deployment dataset. In 1992, two IOEBs (T92 IOEB and B92 IOEB-1) were deployed eleven days apart in different Arctic regions: one unit collected data for less than 4 months and was lost, while the second was recovered and redeployed twice (B96 and B97 IOEB-1), telemetering data into November 1998. A third system (T94 IOEB-2) was deployed in 1994, drifted through the Fram Strait in nine months, and was recovered in the MIZ of the Greenland Sea. Later the system was refurbished and redeployed for one year concurrent with the SHEBA experiment (S97 IOEB-2). Table 2 provides a synopsis of the IOEB systems, which are each further described individually below, followed by graphical representations of the data output from IADP.
Table 2: Table of IOEBs
Name/Acronym Deployed Recovered/Ended Data
1992 Transpolar Drift April 15, 1992 July 9, 1992 Limited ice temperature profiles, CTD, ECM.
T92 88.02 N, 57.11 E 85.61 N, 36.48 E Stopped transmitting - not recovered.
IOEB-1
1992 Beaufort Gyre April 26, 1992 April 21, 1996 Met (no wind), ice temperature profile, ice
B92 73.02 N, 148.83 W 79.36 N, 131.46 W stress, ADCP, fluorometry and transmissometry.
1996 Beaufort Gyre April 27, 1996 April 8, 1997 Met, ice temperature profiles, CTD, DO,
B96 79.12 N, 132.22 W 76.85 N, 132.13 W transmissometry, fluorometry and sediment trap.
1997 Beaufort Gyre April 11, 1997 November 23, 1998 Met, ice temperature profiles, CTD, DO, ADCP,
B97 76.87 N, 132.08 W 71.59 N, 179.51 E transmissometry, fluorometry and sediment trap.
Stopped transmitting - not recovered.
IOEB-2
1994 Transpolar Drift April 12, 1994 November 9, 1994 Met, ice temperature profiles, CTD, DO, ECM,
T94 85.83 N, 12.05 W 73.90 N, 8.06 W fluorometry and transmissometry.
1997 SHEBA September 30, 1997 October 1,1998 Met, ice temperature profiles, CTD, ADCP
S97 75.08 N, 140.92 W 80.65 N, 160.17 W fluorometry and sediment trap.
The longevity of IOEB-1 has demonstrated that these systems can provide multiyear timeseries of numerous environmental data in near-real time, while surviving unattended in the Arctic pack ice for as much as 4 years at a stretch. The surface packages of IOEBs have proven to be extremely resilient to pack ice, which allows for entire mooring systems to be recovered and reused. This is especially important for the recovery of samples, and to dump internally recorded data from the underwater instruments that are typically at greater frequency and precision than the telemetered data. With regularly scheduled maintenance visits, IOEBs can reliably telemeter calibrated environmental data from the pack ice, through all seasons, for many years. While both icebreaker and air supported ice camps have been used for recovering, refurbishing, and redeploying these units, ice camp operations are the most flexible and time efficient under certain circumstances.
Using IADP, telemetered data may be fully processed and plotted within hours of acquisition, but is usually automated on a daily basis. The combined dataset from all instruments on an IOEB provides a vertical section of environmental conditions extending from the surface atmosphere, through the sea ice, and typically extending into the upper 110-165 m of the ocean column. Due to the durability of the IOEB surface package, timeseries have been acquired and transmitted through all seasons, and for multiple years. However, because the systems are anchored to the drifting ice pack, the timeseries vary with respect to geography.
Certain characteristics of the data became evident during development of the processing scheme, and deserve mentioning:
− Screened and filtered Argos locations have an estimated error of ~150 m.
− Prefiltering and removing data reps of only 1 can eliminate most transmission-induced noise.
− Matching acquisition time to transmit time is best accomplished by determining the controller timing and interpolating. This is important to make accurate vector calculations of currents. Error is on the order of 2-3 cm/s.
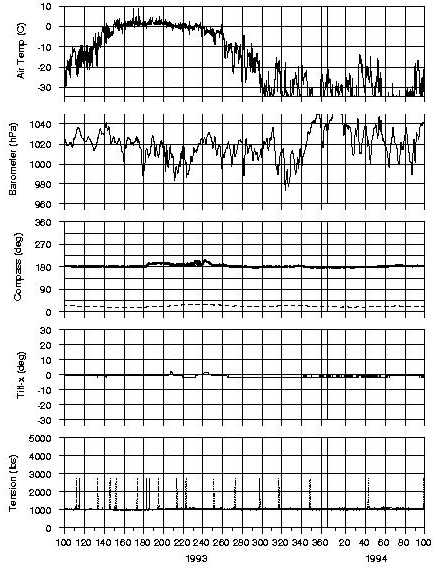
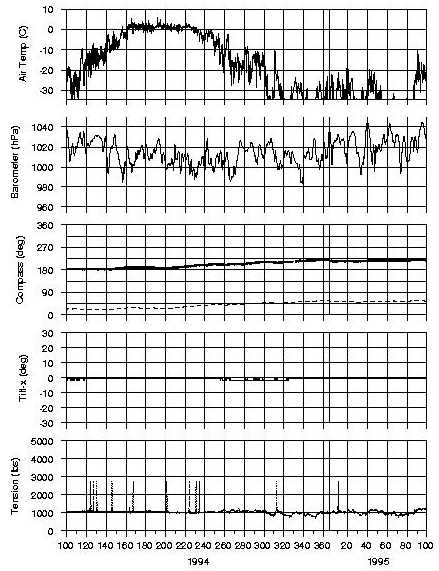
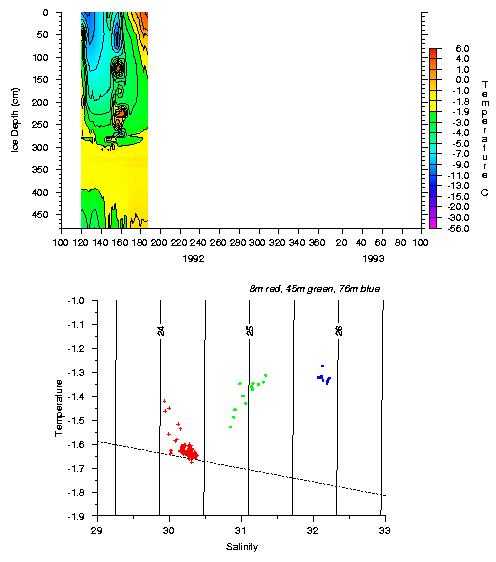
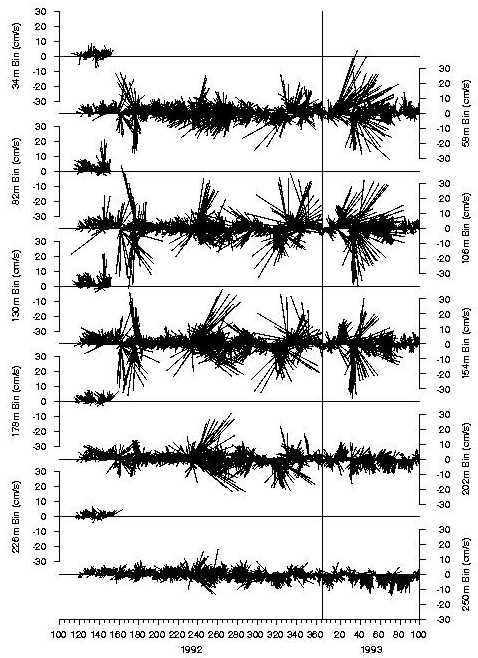
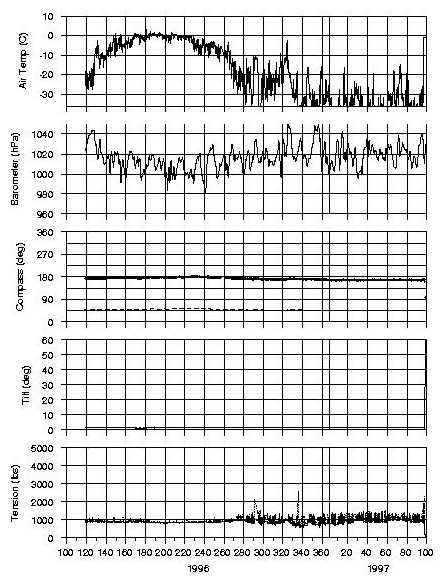
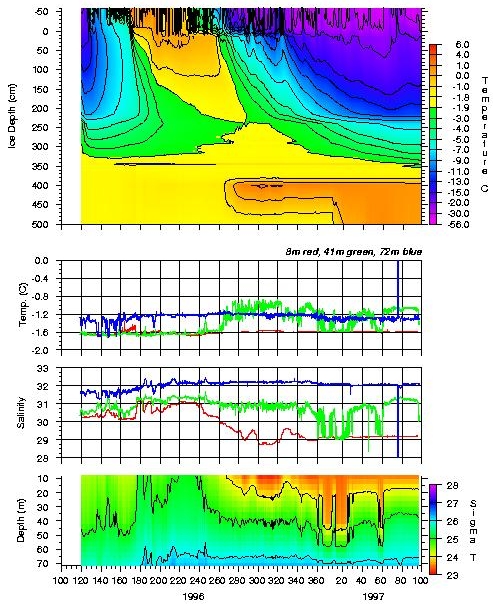
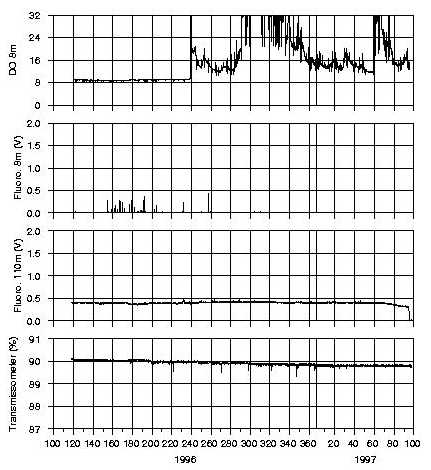
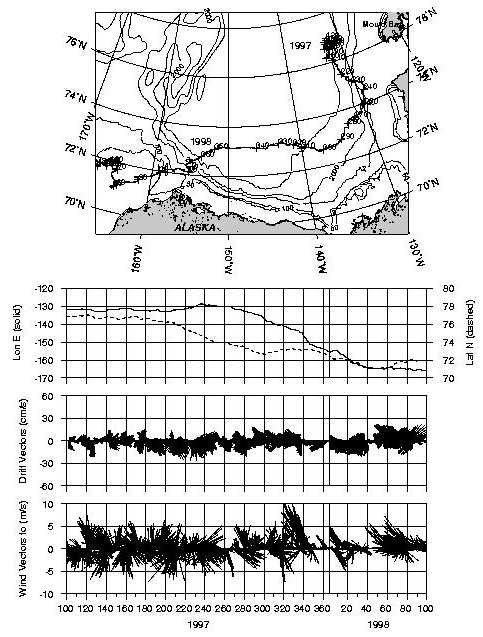
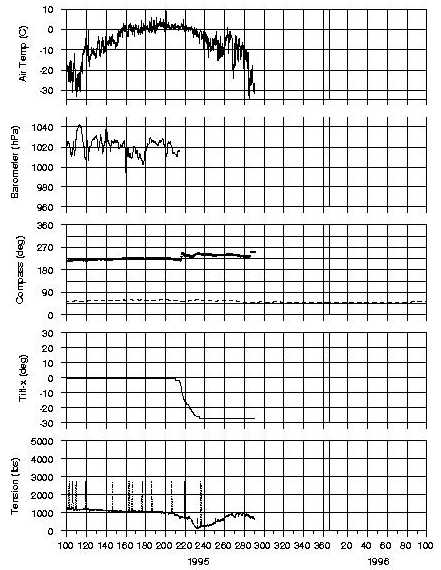
Archiving the data from all the systems through all deployments produced the following data, listed in Table 3 and presented in graphical form. Plots of the output results were generated using batch files of GMT-SYSTEM commands. Except where noted, each page of graphs contains one year of data from a group of sensor variables from a single buoy. As indicated earlier, the drift data has been interpolated and smoothed, while the sensor data has not been interpolated, but has been screened for outliers. Note that compass data includes the correction for the geomagnetic declination, which is represented by the dashed lines on the same plots. Only ADCP horizontal velocity vectors are plotted, although other telemetered data includes vertical velocities, error, status, and instrument temperature. Much of this same data is also presented in JAMSTEC Technical Report (Takizawa et al., 1995).
Table 3: Table of IADP Telemetered Data
T92 B92 B96 B97 T94 S97
duration (days) 85 (28) 1456 347 591 210 365
PTT1 locations 130 21,593 12,593 11,413 3677 6478
PTT2 locations 152 28,240 11,154 11,586 4324 6850
Interpolated locations 711 41,094 17,544 16,586 6392 8971
drift 689 34,993 8329 14,186 5041 8783
PTT1 data 207 6076 11,820 12,143 3723 6655
PTT2 data 162 29,835 11,697 12,019 4160 7111
Combined data 381 26,053 12,840 13,702 4486 6050
air temperature 11,624 3688 3744 1874 5362
barometer 10,282 3698 6195 1882 5392
wind 278 2987 3029 1544 4413
ice temperatures 38 143 925 1360 358 1094
CTD1 88 246 3556 5499 1711
CTD2 22 19 3620 2374 620
CTD3 13 23 3575 2353 623
CTD4 59 626
ECM 51
D.O. 88 247 3570 5445 1677
Fluorometer1 87 3611 5460 1704
Fluorometer2 1963 3639 3791
Transmissometer 1972 3650 3275 1746
ADCP/DPM0 165 4660
ADCP/DPM1 5876 2428
A. 1992 Transpolar Drift IOEB (T92)
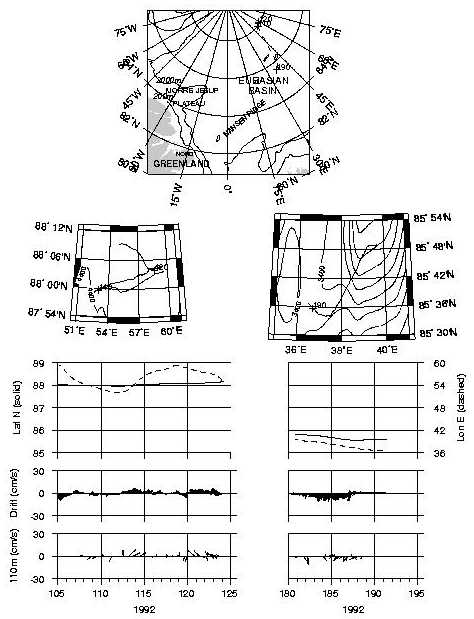
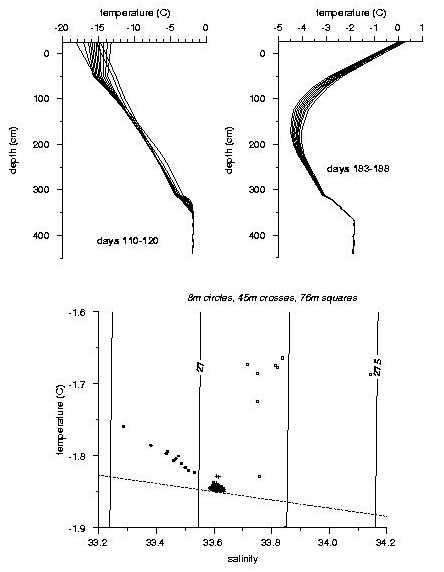
The first IOEB (T92) was deployed from the Arctic Regional Exercise Activity 1992 (AREA-92) ice camp Crystal in the Transpolar Drift on April 15, 1992 at 88° N, 57° E. The U.S. Naval Space and Warfare Systems Command (SPAWAR), the 109th Air National Guard, and Polar Associates Incorporated provided logistic support for the deployment out of Thule and Nord, Greenland. This system transmitted data intermittently for less than three months before failing completely, and has never been recovered.
The party to deploy the IOEB was composed of 4 scientists, plus logistic personnel. Departing Nord on April 3, weather difficulties prevented the scientists from reaching the intended deployment site at the Crystal camp, but instead were landed at an intermediate ice camp. Continuing poor weather stranded the party there for the next nine days, so that it was not until April 12 that the party arrived at Crystal.
After surveying the area around the camp, a site for the deployment was selected on an old multiyear ridge about 100 yards away from the center of the camp. It took the next two days to unpack, assemble the apex, install batteries, and initialize all the sensors and instruments. Meanwhile, the deployment gantry, winch, and hot water melter were prepared. In order to plant the gantry and the winch in the ice, a site 10 by 15 feet was cleared of the overlying 10 to 70 cm cover of snow. Threaded rods for anchoring the winch and gantry were frozen into the icefloe, and the apparatus was assembled. Afterwards, the hot water melter with 36” diameter drill ring was used to core through the 3.7 m thick icefloe. The iceplug itself was removed in pieces using chainsaws.
Only 90 miles from the North Pole, time constraints and constant daylight allowed the deployment to occur in the middle of the night (00:00-04:00 Z), while air temperatures approached -35 °C. The 110 m long IOEB system was lowered through the icehole, anchor first. All the instruments were stored in a nearby heated tent until immediately before being deployed to prevent cold damage, and were kept warm with a Herman Nelson heater while being connected to the mooring cables. The apex was attached last to conclude the deployment and fill the icehole.
On the following day, the ice thermistors, ice stress sensors, and meteorological mast were installed with the buoy. It soon became apparent that the data to the PTTs was not being properly updated every hour. A field repair was initiated to remedy the situation, but was unsuccessful. Much later it was determined that error was caused by network interference associated with the subsurface CTD units.
For 20 days, the system transmitted locations and intermittent data from only one PTT, then failed for unknown reasons. Mechanical and engineering data transmitted by the buoy do not indicate any significant changes before cessation. Surprisingly, the system reappeared 3 months later, farther south and west. For another 10 days, the other PTT transmitted locations and some data, until it also ceased. No other information is available concerning this IOEB since July 1992.
Due to the severe deployment conditions, several instruments failed to operate after deployment, and the remainder were influenced by network interference. The last transmissions from the T92 IOEB at 85° N, 36° W were only 85 days after initial deployment. However, because the timeseries was broken in time, only a total of 28 days of unique drift, ice thermistor, CTD, and 110 m current data was acquired and is plotted
B. 1992 Beaufort Gyre IOEB-1 (B92)
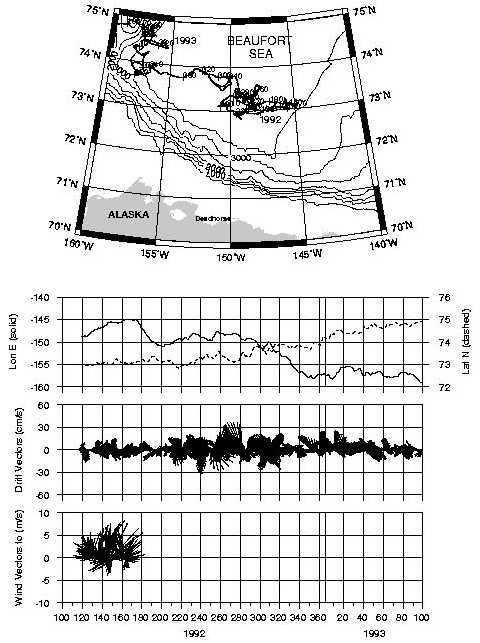
Eleven days after the first IOEB, on April 26, 1992, the Beaufort Gyre IOEB-1 (B92) was deployed from the LEADEX ice camp at 73° N, 148° W, approximately 150 miles north of Deadhorse, Alaska. The deployment gantry and winch used at the Crystal deployment were rushed out of Greenland and to Alaska in a matter of days, so that the deployment of the second IOEB could occur before the LEADEX camp was abandoned.
On April 24, all the instruments at the bottom of the mooring were initialized. In order to get the sediment trap package through the 36" ice hole before the hole could freeze inward, the bottom-most instruments were deployed as soon as possible. Unfortunately, the hole had already frozen in enough to hamper the deployment, and it took all evening to deploy the deepest packages. On April 25, the upper mooring instruments were initialized and the remainder of the buoy was deployed. The surface float was in position by 03:00 Z. Shortly thereafter, all the ice sensors and the meteorological mast were installed. On April 26, the LEADEX ice camp was abandoned by all.
After the deployment, it became apparent that a problem existed on the RS-485 sensor network, since data from the sensors was not being updated, similar to the T92 IOEB. Later it was determined that the SeaCat recorders created glitches over the network when entering and exiting low power mode. This problem did not appear until the mooring system was put under tension, however, and therefore was not previously identified. After a month, the SeaCat batteries became exhausted, and noise on the network disappeared. The excessive network noise caused the water transfer system and sediment trap to halt their programs almost immediately. The same problem also appears to be the cause of excessive noise in the B92 ice data.
After May 1992, most other instruments began updating reliably, including the ice module, meteorological module, ADCP/DPM, and transmissometer/fluorometer module at 108 m. While most instruments were supplied with two to three year battery packs, data continued to be transmitted by some into 1995. The platform transmit terminals were provided with the most power and continued to operated unattended, providing locations into April 1996 where it was recovered and redeployed.
After 1993, the IOEB drifted away from the North American coast and could only hope to be visited by icebreaker, although this opportunity did not occur. But in the summer of 1995, it appeared that the buoy would eventually drift to within Twin Otter aircraft range from the Queen Elizabeth Islands. Consequently a recovery/refurbishment operation was staged in the spring of 1996 as part of the AREA 96 program. Logistic support for the recovery operation was provided by SPAWAR, the 109th Air National Guard, and Polar Associates Incorporated out of Thule, Greenland. The Mould Bay Weather Station in northwest Canada was a base for flight operations into the ice pack, and provided temporary accommodations and services. The Twin Otter aircraft and crew were contracted from Kenn Borek Air. Four scientists along with one logistics person occupied the icefloe containing the buoy, then recovered, refurbished, and redeployed the system from an air supported ice camp consisting of only two tents, in a period of 13 days
On April 12, the first survey was made to the latest Argos buoy position. The ice in this area was composed almost entirely of tightly packed, relatively small multiyear floes, with numerous, tall ridges. Absent were the larger sized floes and numerous leads that characterized the region where the IOEB was deployed four years previously. On our arrival, the skies were clear, visibility excellent, and the yellow surface float was spotted within 10 minutes of reaching the site.
A landing on a nearby icefloe 0.5 mile distant enabled a reconnaissance of the IOEB to be made on foot. The apex leaned at a ~30-40° angle and was covered on top with 3-4” of light snow. It was positioned in a 6-8’ diameter circular depression (1-2’ deep) in the surrounding ice/snow surface; apparently caused by seasonal melting. However, because the yellow sides of the apex foam were exposed 3-5’ all around, it was relatively easy to spot the unit from the air. The meteorological mast was bent approximately 45°, the wind monitor was completely missing, and the air thermistor was hanging from the damaged radiation shield. The foam flotation showed superficial polar bear claw marks, but was in excellent general condition, as was the top plate, patch antennas, and pickup chain. Next to the float, the aluminum pole and plate assembly which supported the under-ice echo sounder, protruded 4’ above the ice, although none of the wires to any of the ice sensors were still connected to the apex, or were visible in the vicinity.
Unfortunately, the reconnaissance landing strip nor any nearby icefloes were suitable for a reliable airstrip for logistic support, consequently arrangements were made to charter a Bell 206 single-engine helicopter to support the operation. The IOEB site could only be visited by helicopter, so a main camp (named AMBER) was formed 8 miles away, as a base of operations during recovery and as a redeployment site.
The first personnel pioneered the main camp on April 16, the recovery gear was shuttled to the site, and three days later on Sunday, April 21, the actual recovery of the IOEB began. The day was partly cloudy, with air temperature hovering between -20 and
-25 °C. A portable hot water drill was used to cut a 50” hole in the 4 m thick ice around the buoy. Wires from the ice sensors installed four years ago were frozen everywhere in the ice around the buoy and sometimes inhibited the ice drill, until being manually removed. The ice plug was frozen to the blue cable and was raised by lifting the mooring, cut into pieces with chainsaws and the debris dragged away. The mooring system was completely retrieved, making sure that each instrument was promptly hauled into a nearby tent immediately upon reaching the surface, to prevent freezing. By April 21, 23:00 Z the recovery was complete. The following day, everything was transported via helicopter back to AMBER ice camp and the IOEB remote location was completely abandoned.
The first priority back at AMBER was to dump data from any instruments, and remove old batteries. In all cases, both the main and backup batteries had expired in all the underwater instruments. This was expected, since the time that passed after deployment was double the expected lifetime of the sensor battery packs. Only the ADCP contained non-volatile bubble memory, but data collection from that instrument was not attempted in the field.
This IOEB was successfully redeployed in 1996 (B96), and maintenance was performed again in 1997 (B97). It operated into November 1998, for a total of nearly 80 months of consecutive operation in the Arctic pack ice and Chukchi Sea.
C. 1996 Beaufort Gyre IOEB-1 (B96)
Over four years after being deployed, the B92 IOEB-1 buoy system drifted in a large generally clockwise arc, exceeding 82° N latitude in 1995, and finally drifted within 300 miles of the Canadian Archipelago in early 1996. With support by SPAWAR, the 109th Air National Guard, and Polar Associates, a recovery/redeployment operation was launched from the Atmospheric Environment Service (AES) Weather Station at Mould Bay, Canada as part of the AREA-96 operation in April 1996. Using commercially contracted Twin Otter aircraft and a helicopter, 5 days of remote ice camp operations successfully recovered the system intact at location 79° N, 131° W. Several days later, the refurbished system (B96) was redeployed 30 km distant, and effectively transmitted data for another year.
After recovery of the B92 IOEB, 2-1/2 days were spent refurbishing the apex and underwater system for redeployment. Both of the patch antennas on the apex had minor superficial cracking on the urethane surface and were replaced. On the electronics endcap, the bulkhead connectors which interface with the external ice sensors were well preserved, eventhough the sensor wires were removed from the apex over three years previously. Most of the electronics in the apex were reused, although some software was upgraded by replacing EEPROM memory chips. The only hardware replaced were one of the microcontroller modules (which apparently failed early during the drift), the magnetic compass, and wind monitor interface board. On April 25, the IOEB apex was completely reassembled with the refurbished electronics and new batteries, and Argos satellites received transmissions on the next day.
The mooring cables and most of the underwater instruments to be deployed were new units, with the exception of the biogeochemical package. The sediment trap, transmissometer and fluorometer were cleaned thoroughly and the software for the sediment trap and transmissometer/fluorometer module was upgraded. The ADCP and water transfer system were not redeployed; the ADCP was replaced with an S4 current meter at the same depth. The deep fluorometer from the original IOEB was found to be defective and was replaced by the shallow unit. Meanwhile, the gantry and winch were frozen in for the station work and deployment.
On Friday, April 26, the station work and redeployment of the IOEB began. In the morning, a 36” hole was cut by the hot water drill through the 4 m thick ice in about 1 hour. After removing the ice plug (with chainsaws), a CTD cast was made down to 150 m, stopping at 110 m to collect water for the sediment trap bottles. Deployment of the buoy began after 6 PM (local) in clear weather. After each 31 m wire rope segment, all the units on the mooring were interrogated to ensure their correct functioning. After the apex filled the icehole at 01:30 Z on April 27, all the instruments were broadcasting locally.
The ice thermistors and meteorological mast were installed the next morning in cold, overcast, and windier conditions. A calibration of the wind direction was performed using a handheld magnetic compass and a GPS position. Finally, snow was shoveled back into the deployment site, to leave the IOEB in a somewhat pristine environment. The following day, several flights were performed late to remove the remainder of the cargo, and the rest of the ice camp party. On May 1, Mould Bay was evacuated by C-130 of all IOEB gear and ice camp personnel back to Thule, Greenland.
Over the next 12 months, both PTTs and microcontrollers on the IOEB functioned properly and telemetered information from 69 environmental variables. The network noise and various software errors that disrupted the 1992 system were repaired on the 1996 system. In addition, field measurements of the air temperature, barometer and wind monitor all agreed with the corresponding IOEB data, and the earliest transmitted SeaCat data agrees with data from the CTD cast taken shortly before redeployment. On the other hand, both S4 current meters malfunctioned. The network conducting cable that looped around the current meter possibly influenced the shallow unit. The deep S4 stopped operating one day after being deployed, and was later determined to have apparently flooded.
In 1997, the distance from Mould Bay to the IOEB was reduced considerably, due to the fact that the buoy was located nearly 245 km further southward than in 1996. The primary objectives for revisiting the IOEB again in 1997 were to recover the sediment trap samples acquired over the previous year, reinstall the ADCP onto the mooring system, and to extend the lifetime of the system and all its instrumentation. Each of these objectives was met; in particular, the recovery of the sediment trap samples is particularly noteworthy as it marks the first time that a full year timeseries of valuable particle flux samples was acquired under the Arctic pack.
As part of AREA-97, SPAWAR, the 109th Air National Guard, and Polar Associates again provided logistic support for a small ice camp recovery/redeployment operation, again staged out of Mould Bay, Canada. This year, a refrozen lead runway existed near the buoy site, so that camp could be made on the same icefloe containing the IOEB, and Twin Otters without the need for a helicopter could support the field operation. Transportation of all the gear and people, and camp functions proceeded extremely smoothly due to favorable environmental conditions.
By 00:15 Z, on April 8, 1997, the IOEB-1 deployed in the Beaufort Sea was again successfully recovered intact at location 79° N, 130° W. The weather was excellent for the recovery: the skies were clear, there was little wind, and the temperature hovered around -25 °C. The hot water ice drill was started and began cutting a 50 inch hole around the apex at 15:30 Z. In less than two hours, the drill penetrated the 14’ 10” of ice. Pickaxe and chainsaw removed the ice around the apex and cable. This required the most time and labor of the recovery operation, and the hole was not completely clear of ice until 21:45 Z. Over the next 2.5 hours, each instrument on the mooring system was removed (while being kept warm by a hot air blower), and placed into the science tent. Although it was impossible to keep the sample cups on the sediment trap from freezing somewhat during the recovery, fortunately none cracked and no samples were lost. Later, after allowing the system to warm and dry somewhat, the bottles were removed, sealed and stored in a cool environment. All other instruments were allowed to warm and dry overnight in the science tent, and their data dumped the following day.
Full datasets were obtained from each of the three SeaCats on the mooring system, the upper S4 current meter, the transmissometer/fluorometer module, and the sediment trap. Only the deep S4 current meter failed to respond, even when a substitute battery packed was used. The recovered data compares precisely to the transmitted data for each of these instruments, although the recovered data includes points not transmitted, as expected.
D. 1997 Beaufort Gyre IOEB-1 (B97)
The same IOEB-1 system was originally deployed off the coast of Alaska in 1992, drifted in a large clockwise arc for four years before being visited and refurbished in April 1996 and April 1997. SPAWAR, the 109th Air National Guard, and Polar Associates provided logistic support out of the AES Weather Station at Mould Bay, Canada, both years. After the recovery in 1997, three days were used to dump data from the instruments and replace or refurbish them for continued performance. By 01:28 Z, on April 11, the system was once again completely deployed and operational in the icefloe at location 79° N, 131° W.
While a redeployment site was prepared, the apex was refurbished and all instruments initialized for the reinstallation. Meanwhile, a CTD cast was taken down to 500 m through the hole abandoned by the IOEB. The redeployment site was removed about 50 m away from the recovery site, to provide more space away from the icefloe edge. The icefloe thickness was 13’ 7” here, and another ice core was taken at this site. On April 9, a new 39” deployment hole was cut through the icefloe, and another CTD cast was performed. During this second cast, bottle water for the sediment trap was taken at 100 m.
Redeployment of the IOEB began at 21:20 Z. Although the skies were clear, there was a significant wind chill. Using a laptop and extension cable, network communications were confirmed for each instrument by manual interrogation after being lowered into the seawater. The S4 module ceased transmitting during the deployment, but due to the cold conditions, no attempt was made to recover and repair it (especially since all other instruments on the mooring communicated properly). Finally, the apex was attached and lowered, the ice thermistors and meteorological mast were installed, and the redeployed system was complete by 01:30 Z, April 11. A final CTD cast was also performed on this day, while packing the IOEB gear. On April 13, the weather worsened, and the last personnel were returned with the last full flight of equipment.
The entire B96 recovery / B97 deployment ice camp operation was performed in only 12 days, including all flights, pioneering and breaking down the ice camp. Due to the professional planning, experience and hard work of the participants, and especially good fortune, it is unlikely that the operation could have been performed more efficiently, or in any less time.
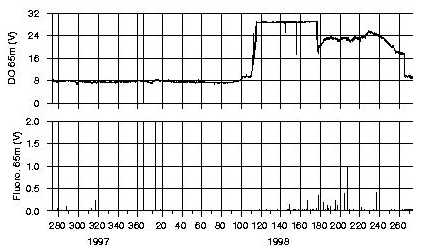
After redeployment, all instruments (except the S4 module) functioned properly and reliably for 1-1/2 years. At the very end of 1997 and beginning of 1998, the B97 IOEB was carried by the icepack onto the shelf of the Chukchi Sea. From this time through the following summer, the mooring system dragged on the shelf bottom that varied between 50 and 100 m. From June through October, the ice melted away from the apex, and the IOEB was effectively anchored in open water, and information was still being telemetered from underwater instruments. After freeze-up in November the underwater instruments stopped communicating and the ice again began to drag the buoy, which was heading directly towards Wrangel Island as of the last transmissions on November 23, 1998.
Consequently, data obtained by underwater instruments in 1998 are subject to shallow depths. The mooring line was probably not vertical, which changes the depths of the CTD data. Furthermore, most of the deeper ADCP bins are not real data, and the transmissometer and fluorometer at 110 m indicate that they are often in the mud during this time.
E. 1994 Transpolar Drift IOEB-2 (T94)
In 1994, a third IOEB (IOEB-2) was deployed in the Transpolar Drift icestream at 86° N, 12° W as part of the AREA-94 operation, eventually traveled through the Fram Strait, and was recovered after 9 months at 9° W, 74° N. However, due to icefloe rafting in the East Greenland MIZ, the mooring system parted before recovery and most of the underwater instruments were lost.
In April 1994, SPAWAR provided the AREA-94 operation from Thule and Nord, Greenland, with logistic support provided by the 109th Air National Guard, Polar Associates and Kenn Borek Air. To deploy the IOEB, a separate ice camp consisting of two tents for 6 people was created north of the Fram Strait. Nearly 14,000 lbs. of ice camp gear, buoy instrumentation, deployment apparatus, and personnel weight was transported by Twin Otter aircraft from the northern coast of Greenland out onto the pack ice for this particular operation.
On Friday, April 8, the site for the ice camp was selected based on criteria for landing the aircraft and positioning the IOEB. The aircraft need a relatively smooth surface for takeoffs and landings, consistent with ice formed by refrozen leads. Furthermore, alternate runways should be available nearby, in case cracks form across the primary runway. On the other hand, the ideal deployment site for the IOEB would be on a large multi-year floe that is between 4 and 6 m thick. Due to the fact that most of the ice around 86° N was ruble, our choices were limited, and we decided to deploy the buoy on the selected 2 m thick icefloe. By the end of the first evening, both tents that comprised the camp were already assembled and occupied by half of our personnel. On the following day (April 10), the remaining gear and personnel arrived and work immediately began on installing the deployment gantry and winch stand, which requires a large amount of melted ice for freezing in mounts to the icefloe. Not until the following afternoon was this apparatus deemed sufficiently secured to the ice.
The work tent (which also housed two of the ice party) was positioned next to the deployment gantry so that the underwater instruments could be kept warm until just before deployment. A cargo door on the end of the tent allowed for the removal of the largest devices. The other tent was the communications tent that housed the VHF radio, four of the ice party, and cooking gear. The distance between tents was about 30 to 40 m. Each tent was supplied with either a shotgun or rifle for protection against large white visitors.
In the late afternoon when the gantry was properly frozen, work began on melting the deployment hole through the ice using a CRREL hot water drill ring. A 39" hole was cut through the ice removed in pieces using a chainsaw. Melting the hole took only about 2 hours through the 2.8 m thick ice. When the plug was removed, there was 30 cm of freeboard of the ice over the seawater.
The IOEB mooring system was deployed anchor first through the ice hole. The T94 IOEB-2 was outfit differently from the previous 1992 IOEBs, in that the outer foam shell was reduced in size to accommodate transportation by Twin Otters, and a 75 kHz ADCP was implemented instead of a 150 kHz unit. Due to the significant differences in mass between the two ADCPs, this required additional flotation to be added to the mooring for buoyancy. The air temperature at the ice camp in April 1997 was between –20 and –30 °C. Since the underwater instruments could not be exposed to these extreme temperatures for extended periods, a Herman Nelson heater was used to blow hot air into a plastic wrap
On April 12, 1994, at 14:28 UTC, the apex was lowered into position on an icefloe at 86° N, 12° W. With the apex and mooring system installed, the meteorological mast containing the wind monitor and air temperature sensor was mounted. Ice stress sensors were installed in the ice surrounding the buoy (at 0.5, 1, and 2 m depths), as were an ice thermistor string and upward-pointed echo sounder.
However, after 3 or 4 hours in the water, the ADCP/DPM combination began sending zeros. Without any spare electronic parts to repair the ADCP or DPM, we decided not to remove the underwater mooring system. Afterwards, valuable environmental data was transmitted from all but three of the sensors/instruments. Besides the ADCP/DPM, the echo sounder and the tensiometer did not operate. Otherwise all other meteorological and ice sensors transmitted valid information, as did the SeaCats, current meter and transmissometer module.
The T94 IOEB drifted south faster than desired, and passed through the Fram Strait during the summer of 1994. Before August 29, 1994, the IOEB drifted southward intact on the icefloe it was mounted on, as indicated by stable tilt measurements inside the apex of the buoy. During all this time, data was reliably transmitted from the surface electronic instruments, and all but one underwater instrument. Late in the day on August 28 the IOEB was located at approximately 78.5° N, 0.4° E. when the barometer began to drop and wind speeds increased, indicating the onset of an Arctic storm. As the wind speed increased up to 8 m/s, the drift of the buoy to the southwest also increased up to 75 cm/s. After a slight lull in the storm on the morning of August 29, the winds and ice drift again increased; by afternoon, the wind speed was up to 12 m/s and the buoy was drifting at a rate of nearly 50 cm/s. At 13:00 Z, a major change in the status of the IOEB occurred, concurrent with a slowing and change of direction of the buoy drift. The apex tilt sensor indicated a list of 15°, which later increased up to 40 degrees. The air temperature and barometric pressure sensors henceforth began registering unreal fluctuations, while the wind monitor no longer transmitted wind speed information; each of these problems presumably due to the influence of seawater. Furthermore, erroneous data from all the ice sensors after this time indicate that their wires were pulled from the surface package at this same time. Concurrently, Argos satellites received the last reliable transmissions from the underwater mooring system of the IOEB. These indicators suggest that it was at this time that the icefloe containing the IOEB broke apart; probably as a result of being rammed into stronger floes. Because of the damage to the meteorological sensors, we suspect that surface package was temporarily submerged below the surface of the seawater. In addition, it was also at this time that the ice penetrator cable appears to have been damaged. However, since the tilt readings rebounded after this time, the mooring system was still secured intact to the surface float. Even the meteorological sensor mast appears to have been intact up until September 7, when the air temperature readings change abruptly.
The next major change in the status of the IOEB occurred on October 4 at 18:00 Z at 76.9° N, 3.5° W. Concurrent with an increase and change of direction of the drift of the IOEB, the tilt sensor began indicating consistently higher list values of the apex. It appears that at this time the mooring system parted from the surface package.
Three possible causes of the mooring cable break are: 1) a strain break, probably caused by rafting of icefloes around the IOEB, 2) a shear break, possibly caused by an overturning icefloe capturing the IOEB mooring, 3) a fatigue break due to vertical motion of the mooring system. The physical evidence suggests that a combination of a strain break and fatigue may be the cause. It is very likely that on September 29, that due to the storm conditions, the IOEB was caught between rafting icefloes which severely damaged the mooring system. The bottom of the apex bellmouth and the ADCP frame are likely points where edges of icefloes could catch. This would suggest that that the icefloes rafted over each other by a distance of nearly 10 m. However, since the tilt sensors suggest that the mooring system was still intact up until October 4, it is likely that vertical motion between the buoyant apex and sea-anchor sediment trap created the working fatigue required to finally part the damaged wire rope of the mooring system.
Recovery of the T94 IOEB was accomplished from a Norwegian ship, Sverdrup II, in the East Greenland Sea in autumn of 1994. The location of the IOEB was reached in the dark early morning hour of 05:10 Z on November 9 and the buoy located in the relatively calm, ice-free ocean in only 40 minutes time using an Argos direction finder. Due to the absence of the underwater mooring, the apex was tilting greatly and the surface top plate was encased in ice. Working in a light snow, crewmembers were lowered in a small boat to chip ice and attach a recovery line to the apex, whereupon the surface package was hoisted onto the ship using the stern A-frame. Because only the surface SeaCat package remained attached to the lower mooring system, that unit was pulled on deck by hand and the recovery operation was complete.
It is apparent that this IOEB suffered excessive ice forces during its drift along the East Coast of Greenland. However, the apex package was in relatively excellent condition, with only minor surface scratches on the foam flotation collar. The top plate and bellmouth flange were undamaged, and the interior electronics tube was completely sealed, intact, and operational. The ice sensors had been previously pulled from the package, and the mast containing meteorological instruments broken off. At the bottom of the apex, a slightly cocked bellmouth flange corresponds to stress wrinkles on the bottom of the foam. Whereas the potted chain cable appeared intact at first glance, it was later noted upon removal that the urethane was cracked in a complete circle around the top termination inside the bellmouth about 6" from the end.
The surface SeaCat package had been damaged. The fluorometer was completely missing from its mount, and the SeaCat pump was dangling from its electronics cable. Furthermore, the flotation balls that mounted on the stainless steel frame were completely missing, and the frame itself was distorted. The lower termination was still attached to the frame, but just below the strain relief boot the 3/8" wire rope had broken. Surprisingly, the SeaCat was still operational, and the full data set was retrieved from the instrument.
F. 1997 SHEBA IOEB-2 (S97)
As part of the Surface Heat Budget of the Arctic Ocean (SHEBA; Moritz and Perovich, 1996) buoy array, IOEB-2 was re-equipped and deployed on the way to establishing the ice camp. The buoy was initially located about 50 km from SHEBA, drifted in the same general manner as the camp, and was recovered during breakout the following year. From September 30, 1997 to October 1, 1998, the system drifted from 75° N, 140° W to 80° N, 160° W for a total of 2000 km from the Canada Basin, over the Northwest Ridge and Chukchi Plateau, to the slope of the Makarov Basin. Complete yearlong timeseries of air temperature, barometer, buoy drift, and compass heading, were telemetered via Argos during the drift. Partial-year records of wind (< 1/2 year) and ice thermistor profiles (~ 3/4 year) were also acquired. Upon recovery of the buoy, upper ocean temperature and salinity data at 65, 105, and 165 m were retrieved along with current profiles from an ADCP, a timeseries of dissolved oxygen, and biogeochemical samples from a sediment trap.
On September 30, 1997 enroute to the desired SHEBA campsite, the Canadian Coast Guard Icebreaker Des Groseilliers maneuvered into a position where the deployment could be performed with the bow crane. Equipment was loaded onto the icefloe, and a 1 m diameter hole cut through the 1.1 m thick icefloe. Anchor first, each instrument was attached to the mooring system and lowered through the icehole. By 23:50 Z, the mooring and surface apex were installed at 75° 5.4’ N, 140° 54.7’ W. The meteorological mast and ice thermistors were subsequently installed, the deployment gear loaded back onto the ship, and the cruise resumed. Later, after a problem with the underwater telemetry of the IOEB was identified, the buoy was visited briefly by helicopter, to make a correction that enabled the air and ice data to be transmitted. The ocean data had to be retrieved upon recovery.
Over the next year, the IOEB drifted unattended in a large anticyclonic arc, while constantly updating locations via Argos. In May of 1998, scientists performing maintenance on a nearby buoy did visit the IOEB and surmised that a bear had visited the IOEB, removed the anemometer, and bent the air temperature radiation shield. Actually, the telemetered wind data failed on April 25th (while the IOEB was near 76° N, 164° W), indicating that could be when the bear discovered the buoy. The air temperature measurement does not appear to have been effected.
Recovery of the IOEB was accomplished on October 1, 1998 from the Canadian Coast Guard Icebreaker Louis St. Laurent. When found, the surface buoy was tilted at a 30° angle within a pressure ridge that appears from tilt data to have surrounded it two weeks previously. The meteorological mast was bent over and the wind monitor was missing, but the apex was undamaged. One out of three ice thermistor strings was still attached to the endcap. These were removed and brought onboard the ship, and ship’s bubblers were used in an attempt to blow the mooring free from the broken ice. Due to the high ice concentration, however, the ice could not be removed. Consequently, the icebreaker was maneuvered for several hours to create a large pond. It then became relatively straightforward to pull the mooring system from the water in only a few hours (despite the raw weather), apex first. By 17:12 Z, at 80° 39.2’ N, 160° 10.2’ W, the system was completely recovered.
Onboard, 24 Mbytes of data from the 150 kHz ADCP were dumped, SeaCat conductivities and temperature timeseries at 3 depths (one with dissolved oxygen) were retrieved, and a complete collection of 21 sediment trap samples were brought back to the lab for further analysis. Unfortunately, the SeaCat at 8 m was found to have failed, and the sensitivity of the fluorometer was too low to provide useful information.
References
Aagaard, K. and E.C. Carmack, “The Arctic Ocean and Climate: A Perspective” in The Polar Oceans and Their Role in Shaping the Global Environment, O.M. Johannessen, R.D. Muench, J.E. Overland, eds. AGU Geophysical Monograph 85, pp. 5-20, 1994.
Adobe Systems Inc., Postscript Language Reference Manual, 2nd edition, Addison-Wesly, Reading, MA, pp. 764, 1990.
Argos CLS, Argos User Manual, 1.0, pp. 176, 1996.
Borland International Inc., Borland C++ for OS/2: Library Reference, Borland International, Scotts Valley, CA, pp. 513, 1993.
Carmack, E.C., R.W. Macdonald, R.G. Perkin, F.A. McLaughlin, and R.J. Pearson, Evidence for warming of Atlantic Water in the Southern Canadian Basin of the Arctic Ocean: Results from the Larsen-93 Expedition, Geophys. Res. Lett., 22 (9), 1061-1064, 1995.
Colony, R., and A.S. Thorndike, An Estimate of the Mean Field of Arctic Sea Ice Motion, J. Geophys. Res., 89 (C6), 10,623-10,629, 1984.
Honjo, S., “Particle Fluxes and Modern Sedimentation in the Polar Oceans” in Polar Oceanography, Part B: Chemistry, Biology, and Geology, W. Smith, ed., Academic Press, London, pp. 687-739, 1990.
Honjo, S., T. Takizawa, R. Krishfield, J. Kemp, and K. Hatakeyama, Drifting Buoys Make Discoveries About Interactive Processes in the Arctic Ocean, EOS trans. AGU, 76, 209-219,1995.
IAGA Division V Working Group 8, R.A. Langel, Chairman, International Geomagnetic Reference Field, 1991 revision, J. Geomag. Geoelectr., 43, 1007-1012, 1991.
IBM Corp., User’s Guide to OS/2 Warp, International Business Machines, Corp., USA, pp. 400, 1995.
Kernighan, B.W., and D.M. Ritchie, The C programming language, 2nd edition, pp. 272, Prentice-Hall, Englewood Cliffs, NJ, 1988.
Krishfield, R., K. Doherty, and S. Honjo, Ice-Ocean Environmental Buoys (IOEB); Technology and Deployment in 1991-1992, WHOI Tech. Rep. 93-45, pp. 138, Woods Hole, MA, 1993.
Manabe, S., Stoffer, R. J., Spelman, M. J. and Bryan, K., Transient response of a coupled ocean-atmosphere model to gradual changes of atmospheric CO2, I; Annual mean response, J. Climate, 4, 785-881, 1991.
McPhee, M.G., T.P. Stanton, J.H. Morison, D.G. Martinson, Freshening of the upper ocean in the Arctic: Is perennial sea ice disappearing? Geophys. Res. Lett., 25 (10), 1729-1732, 1998.
Moritz, R.E. and D.K. Perovich (eds), Surface Heat Budget of the Arctic Ocean Science Plan, ARCSS/OAII Report Number 5, University of Washington, Seattle, 64 pp., 1996.
Nansen, F., Farthest North, Vol. I and II, pp. 510 and pp. 671, Archibald Constable and Co., Westminster, 1897.
MKS Inc., MKS Toolkit Reference Manual, Release 4.2, pp. 647, Mortice Kern Systems, Inc., Waterloo, Ontario, CANADA, 1993.
Schlosser, P., W. Tucker, N. Flanders, and W. Warnick (eds.), Logistic Recommendations for an Improved U.S. Arctic Research Capability, The Arctic Research Consortium of the US, Fairbanks, AK, 88 pp., 1997.
Sea-Bird Electronics, Inc., CTD Data Acquisition Software; Seasoft Version 3.3, pp. 44, Sea-Bird Electronics, Inc., Bellevue, WA, January 1990.
Steele, M., and T. Boyd, Retreat of the cold halocline layer in the Arctic Ocean, J. Geophys. Res., 103, 10,419-10,435, 1998.
Takizawa, T., K. Hatakeyama, T. Nakamura, S. Honjo, R. Krishfield, and N. Koyama, Report of Arctic Observational Data by Ice-Ocean Environmental Buoys (IOEB) 1 and 2 (April 1992 to July 1995), JAMSTEC Technical Report, August 1995, pp. 187, Yokosuka, Japan (in Japanese).
Thorndike, A.S., and R. Colony, Sea Ice Motion in Response to Geostrophic Winds, J. Geophys. Res., 87 (C8), 5845-5852, 1982.
Walsh, J.E., W.L. Chapman, and T. Shy, recent decrease of sea level pressure in the central Arctic, J. Clim., 9, 480-486, 1996.
Wessel, P., and W.H.F. Smith, New version of the Generic Mapping Tools released, EOS Trans. AGU, 76, 329, 1995.
