Tech Report 02-09 Eddys in the Arctic Ocean
WHOI-2002-09
Eddys in the Arctic Ocean from IOEB ADCP data
By Richard A. Krishfield, Albert J. Plueddemann, and Susumu Honjo, Woods Hole Oceanographic Institution, Woods Hole, MA 02543
Technical Report
WHOI-2002-09
October 2002
Table of Contents
Abstract
I. Introduction
II. Background
III. IOEB ADCP data processing
A. Determination of absolute velocities
B. Tidal and near-inertial demodulation
C. Eddy detection algorithms
D. Radial property estimates
E. Output data format
IV. Results
A. B92 IOEB eddys:
B. B92T IOEB eddys:
C. B97 IOEB eddys:
D. S97 IOEB eddys:
Acknowledgements
References
Abstract
Filtered and Earth-referenced ADCP data from the B92, B97 and S97 IOEBs were demodulated to remove inertial and near-inertial tidal frequencies, in order to highlight the low frequency components for examination of Arctic submesoscale eddys. This report describes the raw data, processing scheme, and numerical and graphical results of this analysis, which are also available at http://ioeb.whoi.edu/ioebeddys.htm. Using the demodulated timeseries of current profiles from each buoy, characteristics of 95 possible eddy encounters are quantified by (1) identifying anomalously large velocities associated with subsurface vortices, (2) determining the vortex centers and their drift, and (3) determining vortex properties as a function of radius and depth. Out of 44 total months of observations, 81 of the encounters were determined to be subsurface eddies, and 29 were eddy core encounters. Only 14 of the confirmed subsurface encounters were cyclonic, versus 66 anticyclonic, and one indeterminate. Within the southern and central Canadian basin portion of the Beaufort Gyre, halocline eddys with maximum velocities between 10 and 45 cm/s, centered around 140 m depth, and over 100 m thick were prevalent. Over the Northwind Ridge, eddy encounters were absent from any timeseries. Farther north and west over the Chukchi Cap, encounters resumed, but were generally smaller, more shallow and less intense (although these observations were mostly derived from a lower resolution transmitted data subset).
I. Introduction
During the second North Pole (NP) drifting station conducted by the Former Soviet Union (FSU) in 1950-51, current measurements in the Arctic Basin beneath the icepack indicated the occasional presence of enhanced currents (>20 cm/s) near 150 m depth (Somov, 1954). Later, Belyakov (1972) noted the presence of similar features in NP-1 and NP-8 data. However, this information was not available outside the FSU, and it wasn’t until the occupation of T-3 ice island in the 1960s that enhanced current anomalies were first reported by western scientists (Galt, 1967). Later, STD
profiles and current data from the Arctic Ice Dynamics Joint Experiment (AIDJEX) pilot camps in 1970 and 1972 provided the first clear evidence of isolated baroclinic eddies (Coachman and Newton, 1972; Newton et al., 1974, Hunkins, 1974), and more than 130 eddy encounters were reported in 1975-76 from the four ice camps which composed the main AIDJEX program (Manley and Hunkins, 1985) in the Beaufort Sea. The eddies were mostly anticyclonic (97%), 10-20 km in diameter, and located in the halocline (30-200 m depth). Since then, the detailed physical and dynamic properties of both cyclonic and anticyclonic eddies observed during the Arctic Internal Wave Experiment (AIWEX) have been examined (D’Asaro, 1988), and dissipation measured (Padman et al., 1990). Recently the hydrographic and biogeochemical properties of a cold-core eddy were reported (Muench et al., 2000). From these reports, it is clear that the background velocities in the Canadian Basin pycnocline are small (a few cm/s) compared to the maximum rotational velocities of the eddies (10-40 cm/s), so that nearly all velocities greater than 10 cm/s may be associated with eddies.
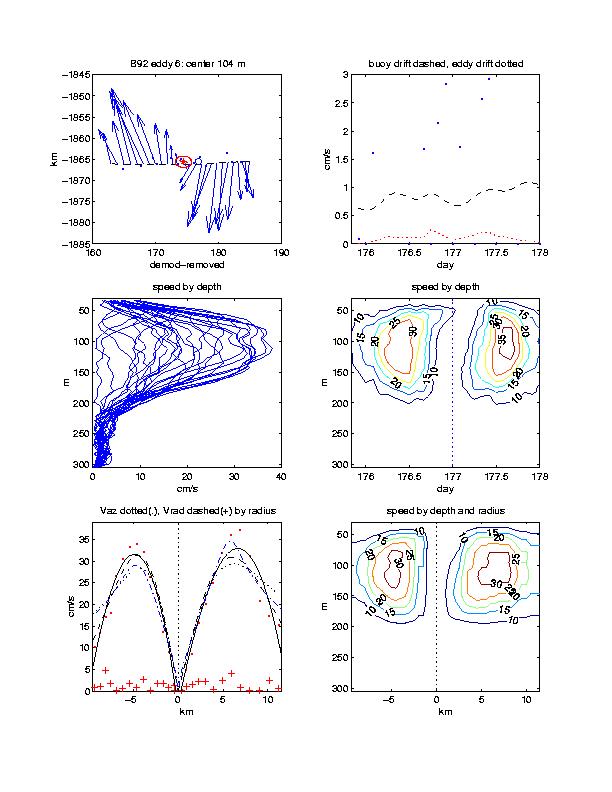
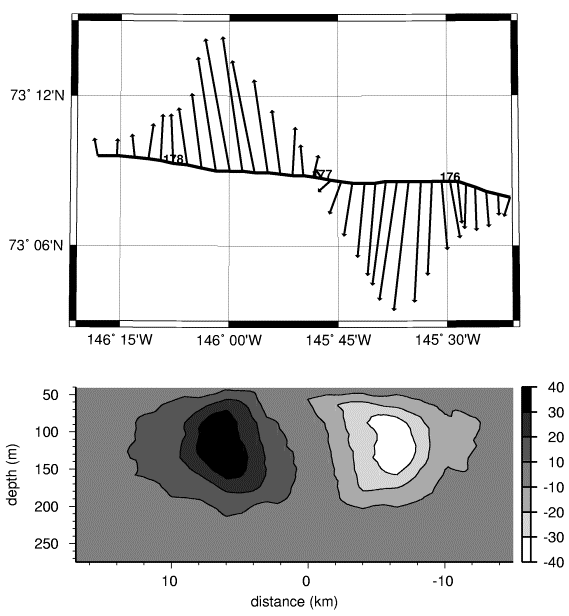
An example of the horizontal and vertical current structure of an Arctic halocline eddy is presented in Figure 1 based on Acoustic Doppler Current Profile (ADCP) data from an Ice-Ocean Environmental Drifting (IOEB) buoy deployed in 1992. The current profile data were sampled over a three day period while the buoy was carried by the ice pack westward at a high rate of speed (>50 cm/s). The analyzed current vectors at 104 m (center depth of the eddy) and contours suggest that the feature may be described by cyclonic solid body rotation with maximum radial velocities exceeding the background velocity by 35 cm/s. The eddy appears to be slow moving or stationary (<10 cm/s), extends from <50 m to >200 m in depth, and is nearly 10 km in diameter. In this report, we describe the ADCP current data and processing used to produce this example, and present numerical and graphical results on the dynamic structure of a total of 95 current anomalies (possible
Related Multimedia
B92 eddy plots
B92T eddy plots
B97 eddy plots
S97 eddy plots
Related Files
|
|
|
|
|
|
|
|
eddy encounters) determined from long duration timeseries of IOEB ADCP data in the Beaufort Gyre between 1992 and 1998. Not every encounter produces a clear picture of an eddy, as in the example in Figure 1, and some are probably not eddies. However, in the text that follows, this distinction is not made, and every current anomaly is treated as an eddy.
II. Background
A total of 44 months of observations of velocity in the upper ocean beneath the icepack in the western Arctic were obtained using 150 kHz narrowband ADCPs on the 1992 and 1997 Beaufort Gyre and 1997 SHEBA IOEBs. The IOEB system was developed to acquire and telemeter in near real-time inter-relatable time-series data on atmospheric, oceanographic and ice physics in ice-covered oceans during all seasons. It was designed to survive harsh conditions in the Arctic ice pack for extended periods of time, requiring only infrequent maintenance.
The IOEB consists of a surface flotation package containing a watertight, pressure resistant electronics compartment housing satellite transmitters, data loggers, and batteries, and provides buoyancy for itself and a suspended instrumented mooring package. Argos platform transmit terminals (PTTs) are used for determining the location of the buoy and broadcasting data. The underwater mooring system has extended down to as much as 165 m below the icefloe, and has included conductivity and temperature recorders at discrete depths, an ADCP, a dissolved oxygen sensor, a transmissometer, a fluorometer, and at the bottom, a sediment trap. Below the deepest instrument, an anchor provides tension on the mooring to reduce sailing of the underwater system. Complete detailed information on the IOEB program (Honjo et al., 1995) is available on this website, and in technical reports on the hardware (Krishfield et al., 1993) and on field operations and data (Krishfield et al., 1999).
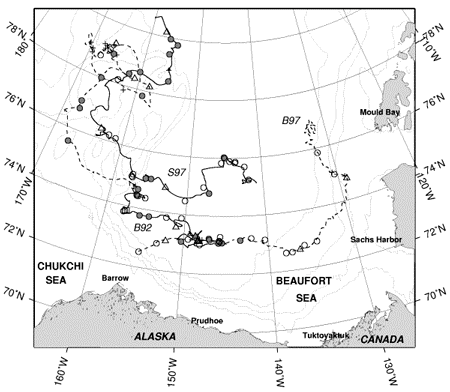
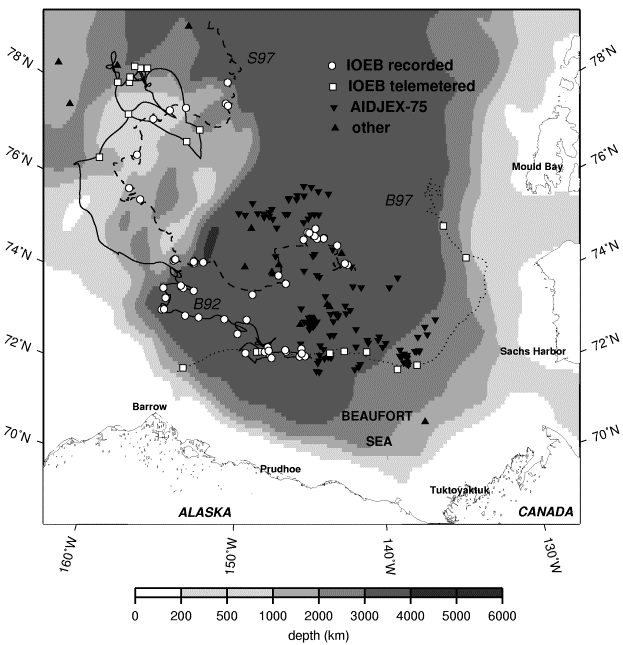
Two IOEBs were deployed a total of four times on multiyear pack ice in the western Arctic Ocean between 1992 and 1998. One IOEB was continuously deployed in the pack ice for over 8 years. Installed in April 1992 (indicated by the acronym B92), it drifted with the Beaufort Gyre in a large anticyclonic circle, and was refurbished in the field twice in April 1996 (B96) and April 1997 (B97). Another IOEB (S97) was deployed in 1997-98 concurrently with the SHEBA field program at a distance 50 km from the main camp for one year.
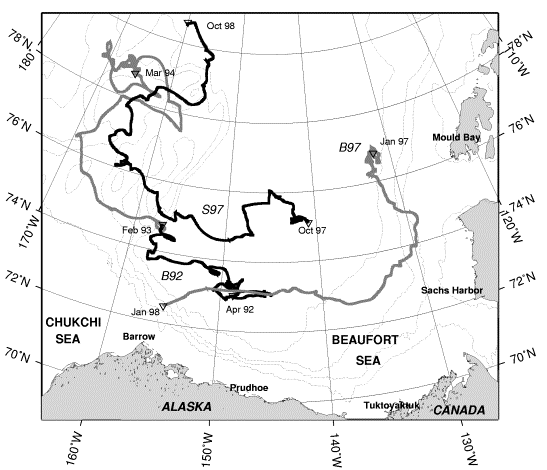
The drift tracks of IOEBs with ADCP data are shown in Figure 2. On each one of these buoys, a RD Instruments 150 khz narrowband ADCP was mounted, pointing downward, at 14 m below the ice-tethered float. Every instrument was configured to sample every 15 minutes, partitioning the data into 40 bins of 8 m length and extending downward 320 m below the instrument. Provided with either 20 or 24 Mbytes of EEPROM storage, sufficient onboard memory was present at the start of each deployment to store up to 12 months of this high-resolution data. Using a Data Processing Module (DPM; Plueddemann et al., 1992) to average the currents in depth and time, a low-resolution subset was broadcast with the IOEB datastream for the lifetime of the ADCP. The broadcast current data consists of two-hour averages from ten, 23-m long bins.
Table 1 summarizes the platform drift, resolution of ADCP timeseries, and number of possible eddy encounters obtained from each IOEB. There are two high-resolution and two low-resolution datasets.
Because both the B92 and S97 IOEBs were recovered, 10 and 12 months of high-resolution current data were retrieved, respectively. The first dataset, “B92” was obtained by an ADCP deployed on the Beaufort Gyre IOEB in April 1992 from the LEADEX Ice Camp and spans 10 months, while drifting from 73.0°N, 149°W, to 74.7°N, 157°W. The “S97” dataset was obtained by another ADCP on another IOEB that was deployed during the SHEBA Experiment, and traveled from 75.1°N, 141°W to 80.6°N, 160°W between October 1997 and October 1998. Two-hour averages of the S97 absolute current velocity data are also available via the SHEBA website at http://sheba.apl.washington.edu/.
However, the B92 IOEB continued to transmit low-resolution data from 5 bins for over another year after the onboard memory was filled. The extended portion of the B92 transmitted dataset is thus referred to as "B92T". The B97 IOEB was never recovered, but transmitted 10 bins of low-resolution current data (dataset "B97") for 9 months while drifting from 76.9°N, 132.1°W to 71.6°N, 179.5°E. In Table 1, only the number of bins used in the eddy analysis are indicated. Despite the lower resolution, our results indicate that eddys are often clearly identifiable in the transmitted datasets.
In a previous study, spectral analysis was used on the full 23-month B92 transmitted ADCP dataset to describe upper ocean current variability in the Beaufort Gyre (Plueddemann et al., 1998). The horizontal kinetic energy was dominated by eddy band (2-5 day periods) and near-inertial band energy. Of particular interest with regard to our results, there was no clear annual cycle in the eddy energy, which dominated the Beaufort Sea and Canada basin, but was nearly absent over the more shallow topography of the Northwind Ridge and Chukchi Plateau.
Table 1: Summary of ADCP timeseries from IOEBS
| B92 | B92T | B97 | S97 | |
|---|---|---|---|---|
| Duration | 4/92-2/93 | 2/93-3/94 | 4/97-1/98 | 10/97-9/98 |
| days | 303 | 392 | 265 | 363 |
| Drift km | 2295 | 3319 | 2022 | 2777 |
| ADCP bins | 38 | 5 | 10 | 38 |
| bin length | 7.8 | 23.4 | 23.4 | 7.8 |
| bin spacing | 7.8 | 46.8 | 23.4 | 7.8 |
| bin spacing | 7.8 | 46.8 | 23.4 | 7.8 |
| Total encounters | 27 | 21 | 18 | 29 |
| anticyclonic | 20 | 14 | 13 | 25 |
| cyclonic | 6 | 7 | 5 | 4 |
III. IOEB ADCP data processing
High-resolution data recovered from ADCPs (B92 and S97) are processed to remove noise, correct for platform drift and geomagnetic declination, remove bottom hits, and output interpolated 2-hr average current profiles along with ancillary data. Both datasets were processed according to the following method, while accounting for some specific instrument/experimental differences:
- Raw binary ADCP files are unpacked to provide header, beam velocity profiles, echo amplitudes, and percent good data.
- Beam data are analyzed to remove distortions caused by acoustic reflections from instruments on the suspended mooring, bottom hits, low percent good, and other discrete bad points in individual beams.
- Earth-referenced Janus velocities are computed from the filtered beam data, and locations. Simultaneously, geomagnetic declination is determined from the NGDC IGRF model.
- A first difference filter is used on the computed velocities to remove spurious points above selected thresholds.
- Gaps in the velocity data are linearly interpolated. The velocity and ancillary data are averaged over 2 hours and output.
Low-resolution data transmitted from IOEBs (B92T and B97) have already been processed and averaged by the DPM into Janus velocities before broadcast, and are Earth-referenced, adjusted for the geomagnetic declination, filtered and interpolated by IOEB Archived Data Processing (IADP; Krishfield et al., 1999).All high-resolution and low-resolution absolute velocity datasets are subsequently referenced to their deepest bin and have their inertial and tidal frequencies removed by demodulation, to highlight the anomalous currents from the background. The demodulated series are then operated on by eddy detecting algorithms, and the properties of each eddy quantified and plotted. Results are retained in MATLAB binary format, and are freely available at the IOEB website along with this documentation.A. Determination of absolute velocitiesFrom both recovered ADCPs, raw data are downloaded in binary format using the RD Instruments software SCADCP, version 4.05. These files are combined into a single data file, and an unpack program developed at WHOI is used to convert the binary data to text files of header, beam velocities (VELB), echo amplitude (EAB), and percent good (GDB). Each file contains the consecutive day of year in the first column. The header file also contains pitch, roll, heading, temperature, and various error detection data. The other data files are in sets of 4, one for each beam, and contain the time and data for each of the 40 vertical bins in a separate column. At this stage, the time interval between consecutive measurements are spaced 15 min apart. The data begins when the instrument was started previous to deployment and has not yet been truncated to the actual time of immersion in the ocean.Before being combined into Earth-referenced velocities, the data from the individual beams are processed to remove various errors. In the B92 dataset, simultaneous distortions in EAB and VELB in bins 10 and 11 are attributed to spurious acoustic reflections from the sediment trap suspended at 110 m on the mooring below the downward-pointed ADCP. These are detected by comparing vertical differences of EAB and VELB at these depths, and selecting times when a combination of these indicators exceeds a criteria. To eliminate these distortions, a vertical linear interpolation of VELB is performed between bins 9 and 12. Although the discrepancies normally appear in only one beam, all four beams are corrected at each detection time. Altogether, less than 2% of the profiles in the B92 beam data were corrected. In the S97 dataset, the sediment trap was at a lower depth, and the distortions did not substantially protrude from the background signal. In fact, some small distortions do occur around bin 10, which we attribute to a smaller instrument located at 110 m on this system. In these cases, criteria provided from examination of EAB and VELB indicators could not clearly resolve between distorted and non-distorted profiles. Consequently, no mooring system distortions were corrected in the S97 beam data.
Table 2: Summary of recovered ADCP timeseries filtering
| B92 | S97 | |
|---|---|---|
| Current profile records (x 40 bins | 28985 | 34805 |
| Sediment trap distortions removed (in bins 10 & 11) | 548 | 0 |
| Total bins removed using first difference filter | 384 | 4180 |
| Bottom-hit bins removed | 0 | 6937 |
| Profiles removed: bad or with bit errors | 0 | 23 |
On the other hand, while all the B92 dataset is over deep water, during a 7-day portion of the S97 timeseries the ocean bottom is shallower than the range of the ADCP. The bottom hits in the S97 data are indicated by a local maximum in EAB below bin 27, and between days 533 and 540.5. Over these bottom hits, 5 bins of data are also distorted. These are handled by eliminating all points from 5 bins above the bottom hit to bin 40. Several other peculiar errors occur during the bottom-hit period, that appear in the GDB and bit error data. Dropouts in GDB < 75 on day 536 are removed throughout the water column, while 19 entire profiles with bit errors are removed between days 539 and 540. In addition, 4 other profiles with GDB < 50, were removed from the S97 beam data on days 504 and 509.
The pre-processed VELB beam data are converted to Earth-referenced, or Janus velocities using programs that input header data, latitude and longitude, and geomagnetic declination model parameters, and output declination as well as u, v, w, and error components of the profiles. To remove spurious noise, a first-difference filter is employed on both the Janus u and v velocities. The routines operate on each bin of either the u or v timeseries, eliminating points which exceed a predetermined first-difference threshold. For the B92 data, a threshold of 13 cm/s/15min was used on every bin, while for the S97 data, a threshold of 12 cm/s/15min was used on bins 3 through 34, and 16 cm/s/15min on the remaining bins. Points eliminated in either the u or v series are also eliminated in the other series, as well as the Janus error and w series. This amounts to a bin-average of only 10 out of 28985 points removed for B92, and 104 out of 34805 points for S97.
The absolute velocity datasets are produced by combining the filtered Janus data with the header data, locations, drift components, and other ancillary data. Gaps in the Janus velocities are linearly interpolated in time, and 2 hour averages (8 points) are computed for each variable. The bottom hit depths are nulled (NaN), as are missing data from other variables. Overall, only 2% of the data were removed and interpolated by these processing steps in the B92 data, and less than 1% in the S97 data (where the deeper spacing of the sediment trap appears to alleviate the acoustic distortions).
The algorithm for estimating the bin centers is:
z(i) = D0 + D_blank + 0.5(Dp - Db) + i * Db where: i = bin number
D0 = instrument depth (= 14 m)
D_blank = blank after transmit (B92 = 0 m, S97 = 3.9 m )
Dp = pulse length (= 15.6 m)
Db = bin length (= 7.8 m)
The actual bin length is approximately 7.8 m instead of 8 m after adjusting for the soundspeed which is different enough to have a significant impact on the bin length and maximum range. The reference soundspeed used for determination of pulse length is 1475 m/s, different than that used for velocity (at least in the narrowband ADCP). For a nominal soundspeed near 1440 m/s, this gives a correction factor of 1440/1475 = 0.976.
Both B92 and S97 absolute velocity datasets contain 38 bins of ADCP data, but the depths are not equal. In the S97 dataset, only the first 38 bins contain good current velocities, while bins 39 and 40 have low percent good. On the other hand, in the B92 dataset bin 1 was removed due to an incorrect blank after transmit, and bin 40 due to low percent good.
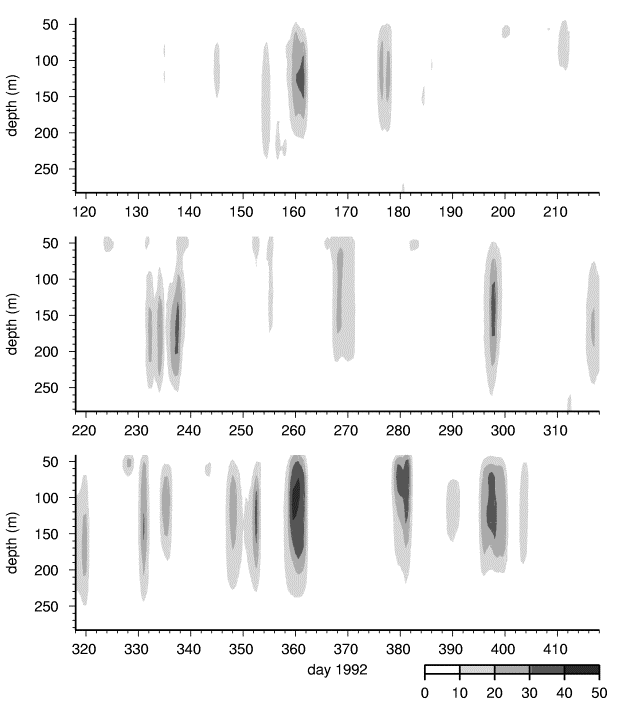
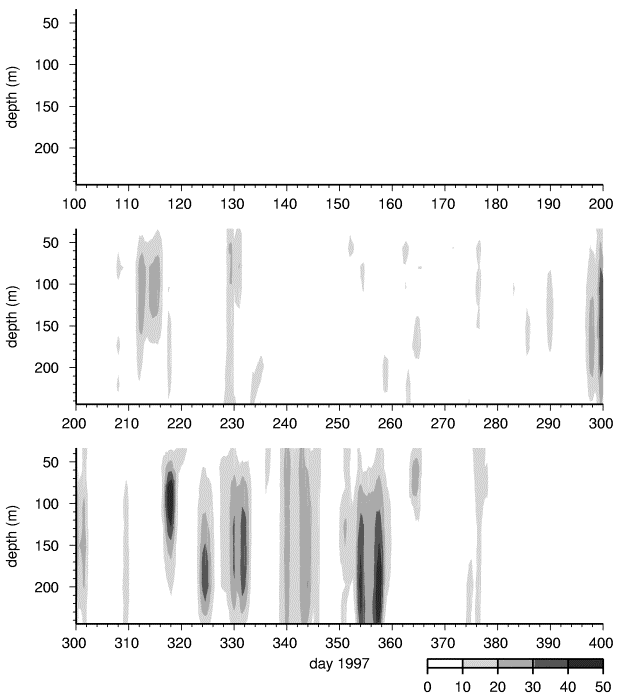
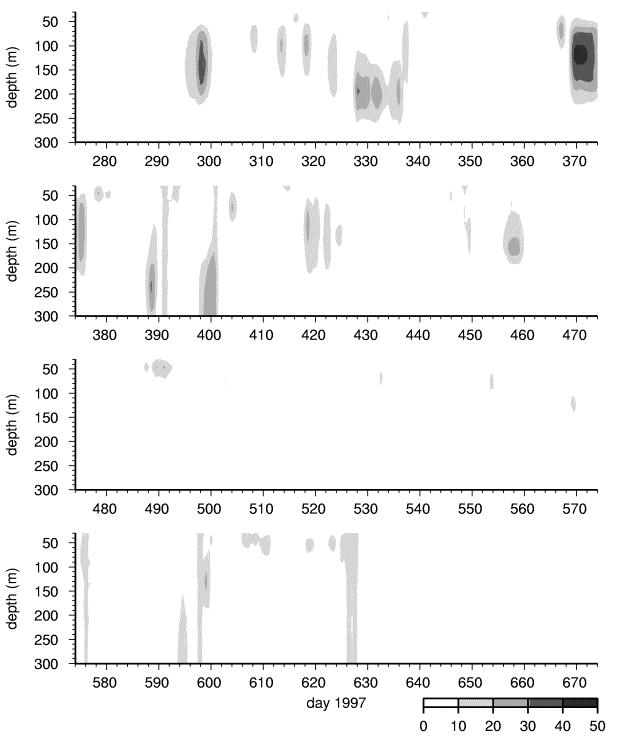
Daily average contours of absolute current speeds from each dataset are plotted versus depth in Figures 3 through 6. Only speeds greater than 10 cm/s are indicated to highlight the anomalous currents that are presumably associated with eddy encounters.
No data or bad bins8511064Bottom-hit bins removed06937.
B. Tidal and near-inertial demodulation
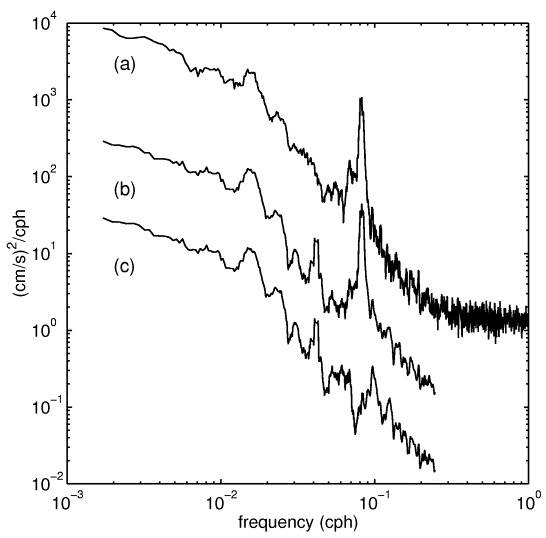
In order to highlight the low frequency component of the currents for examination of submesoscale eddys, demodulation is used to remove inertial and tidal variability in the semi-diurnal band. The demodulation parameterization code was adapted from FITPOS and associated routines by McPhee (1988).
The demodulation procedure is the same for both the recovered and transmitted datasets and consists of two passes through the 2-hour timeseries, so we call this double demodulation. The first pass parameterizes the inertial components within a relatively short window in time (to account for the transient nature of surface events), and the second pass parameterizes the tidal components in a longer window. Both negative and positive senses for each frequency are demodulated according to the least-square error. The first pass steps through the data in 3 day steps, determining inertial components in adjacent 3 day segments (36 data points), and the second pass determines tidal components using overlapping 15 day segments (180 points).
For both the B92 and S97 data, the double demodulation procedure was conducted twice: the first version separated the inertial and 4 tidal components (M2, S2, K1, and O1), while the second separated the inertial and only the semi-diurnal tidal components (M2 and S2). Examination of the spectra of the output using all 4 tidal bands indicated that the diurnal frequency components accounted for less than 2 cm/s of the variance, while the inertial/semi-diurnal components sometimes accounted for as much as 6 cm/s of the variance. Furthermore, it appeared that some of the low frequency eddy energy could be bleeding into the diurnal bands. Consequently, only the components of the inertial and semi-diurnal frequencies from the second demodulation procedure (inertial, M2 and S2) are removed from the ADCP 2-hr data for the ensuing eddy analysis. The same double demodulation procedure is used on the transmitted, as well as the recovered, datasets.
The demodulation returns the parameters for the various frequency components in terms of the 3 day step, and the computed inertial and tidal velocities (M2 and S2) at the original time spacing (2 hr). Finally, the inertial and tidal velocities are subtracted from the input clean 2-hr datasets to arrive at the output “demodulated” current data.
An example of the differences in energy between the raw relative current velocities, the Earth-referenced, and the demodulated velocities are presented by spectra from the B92 dataset in Figure 7.
C. Eddy detection algorithms
Using the demodulated timeseries of current profiles from each buoy, characteristics of the individual eddys are quantified by: 1) identifying possible eddy encounters, 2) estimating the location of the vortex center, and 3) determining the properties of the anomalies with respect to radius and depth.
In order to detect possible eddy encounters, the demodulated current profiles are smoothed vertically by depth and then by time using running mean filters to eliminate short duration high-velocity pulses (which do not provide enough information for eddy determination), as well as to bridge short periods of low-velocities (to combine multiple radii from a single eddy into a single encounter). From the smoothed data, possible eddy encounters are selected when the magnitude of the maximum current (by depth) exceeds a given threshold for a minimum time, and are identified by start and end time, and by median depth of the maximum speed throughout the encounter period. However, where the maximum occurrs within the top two current depth bins (< 50 m), the encounter is not included, as it is suspected that these were probably local inertial events.
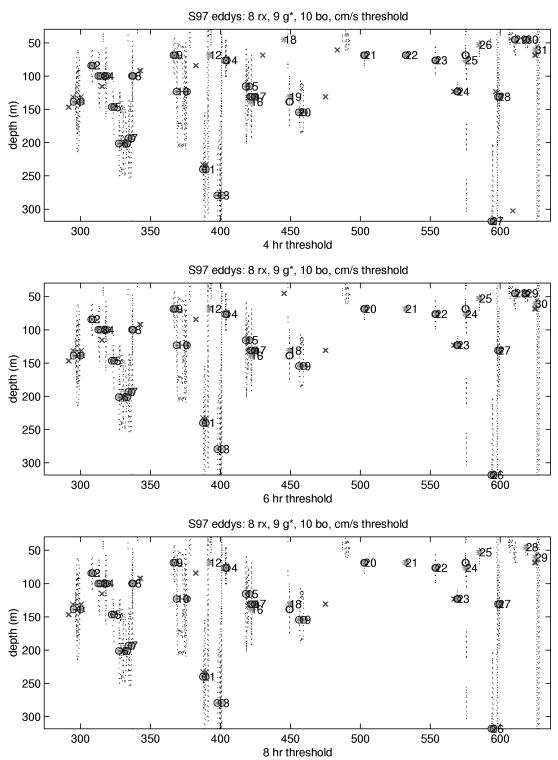
Several smoothing weights and threshold parameters were tested, and it was determined that a vertical average of 50 m and temporal average of 12 hours, in conjunction with a speed threshold of 9 cm/s for more than 6 hours, worked best for identifying possible encounters in the B92 and S97 (Figure 6) recovered datasets. However, for the B92T and B97 transmitted datasets a threshold of 12 cm/s (with the same 6 hour duration) was more appropriate. A total of 27 possible encounters were identified for the B92 data, and 30 for the S97 data (numbers in middle panel of Figure 8). By inspection, 1 encounter is further divided into separate events, 2 encounters are combined into a single event, and 1 encounter completely eliminated for the subsequent analysis. As a result, all remaining encounters basically consist of observations through two hemispheres of an eddy, forward and back through one hemisphere, or a glancing track across and eddy. Note however, that each encounter does not necessarily indicate a unique eddy, because at least a few eddys appear to have been detected more than once.
Because the eddys may move during an encounter, a complicated method is required to accurately estimate the translating eddy center, in order to reduce the distortion of the subsequently computed radial data. For estimation of the eddy centers, the non-smoothed, demodulated dataset is used, and each encounter is sequentially treated independently in the same manner. First a reference velocity is removed from all bins: if the depth of the velocity maximum is deep (> bin 25) a surface velocity (bin 3) is subtracted, while if the velocity maximum is shallow (<= bin 25) a deep velocity (bin 36) is subtracted. Then the resulting velocities for the 5 bins surrounding the depth of the maximum are averaged. Successive eddy centers are determined from the intersections of perpendiculars to the 5-bin average velocity (after conversion to a Cartesian coordinate system) in overlapping 8-hour windows. To constrain the movement of the eddy center further, the median eddy center is determined and all eddy centers greater than twice the standard deviation of the distance from the median center divided by the square root of number of centers, are eliminated. The resulting eddy center timeseries is linearly interpolated to the original time interval (2 hour) with the remaining centers, fixed at the endpoint values outside the interpolated interval, and subsequently smoothed with a 16-hour running-mean average. Using this method constrained all of the eddy centers to move at rates less than 1.5 cm/s, and generally much lower. The improvement over using a fixed eddy center estimate is evident during subsequent determination of the radial properties of the eddy, by reducing the radial components of velocity and increasing the azimuthal components (which is consistent with the assumption of the eddy in near-solid body rotation).
Using the translating eddy center estimate for each encounter, profiles of the radial and azimuthal components of the demodulated velocity are recomputed for each successive time in the encounter. When possible, each encounter timeseries is divided into separate radii at the minimum magnitude of velocity less than 10 cm/s. Separating the data from each hemisphere at a midpoint provides two estimates of the eddy, or alternately allows examination of the asymmetry.
While the processing procedure is primarily automated, it cannot resolve all the difficulties in distinguishing the eddys properly. Consequently, plots of the output must be manually examined and some adjustments made to the encounter intervals, the eddy center estimates, and midpoint. In several instances, the translating center estimate is discarded for a fixed eddy center.
D. Radial property estimates
Each eddy encounter is quantified on the basis of time, location, depth, and drift of the eddy. Calculated properties of each radii are: maximum azimuthal velocity, radius of maximum velocity, vertical thickness, and sense of rotation. Several numerical fitting algorithms were applied to the radial velocities, and statistics of the fits are tabulated. These variables are stored in digital format (see next section, “Output data format”), printed in the eddy tables for each dataset (in the “Results” section), and individually plotted for each eddy (also in the “Results” section).
Specifically, the quantities that are determined per eddy encounter are:
# assigned eddy number
n number of 2-hr profiles in encounter
start, end start, end date of encounter (year day)
dur duration of encounter (days)
depth depth of maximum velocity of eddy (m)
lon, lat mean longitude, latitude of eddy
err standard deviation of distance between all “good” eddy centers and mean.
std normalized standard deviation from all “good” to median centers (km)
stdc “std” restricted to centers within an error circle (km)
espd mean eddy translational speed (cm/s)
The quantities that are determined per first and second radii are:
min8, max8 minimum, maximum depth with speeds > 8 cm/s (m)
width8 vertical thickness of eddy based on 8 cm/s criteria (m)
minh, maxh minimum, maximum depth from half-width criteria (m)
width vertical thickness of eddy based on half-width criteria (m)
maxv maximum azimuthal velocity (cm/s)
rad radius from center to maxv (km)
s rotation sense of eddy: anticyclonic = 1, cyclonic = -1
vstd standard deviation of radial velocities (cm/s)
rms1 root-mean-square error of 3rd order polynomial fit (cm/s)
rms2 root-mean-square error of “sink eddy” fit (cm/s)
rms3 root-mean-square error of “stirred eddy” fit (cm/s)
rms4 root-mean-square error from Bessel function fit (cm/s)
The duration of any individual encounter varies between 8 hours and more than 7 days, but is on average about 2 days. Eddys are encountered throughout the depths sampled by the current profiler, but the mean center depth (determined from maximum velocity) from all encounters is 122 m. The mean movement of the eddy (espd) was generally constrained by our method to about 0.1 cm/s, but some eddies were allowed to drift by as much as 0.4 cm/s, and in other cases were fixed to a single location. Statistics on the eddy center translation estimate provide information on the quality of the raw eddy center triangulation (err), and on the deviations of the drifting eddy center estimate from the median center estimate (std), and from only those median center estimates that are within a statistical confidence circle described by:
2 * standard deviation of locations / square root of number of points.
Up to two radial estimates of each eddy are determined. In some cases, the drift of the platform caused an eddy to be sampled only marginally at the outer edges, and only one radial estimate is obtained (sometimes not even extending into the core of the eddy). Other times the buoy drift would sample in and out through the same radial section of an eddy, or transect directly through an apparent eddy. Depending on the number of points in a sample, and on the apparent asymmetry of the eddy, either 1 or 2 radial estimates are generated. For each radius, the physical eddy properties that were tabulated are: vertical eddy width (width8 and width), maximum azimuthal (or tangential) velocity (maxv), distance from eddy center to maxv (rad), and rotational sense (s).
The average vertical width of the features are estimated using two methods: a threshold of 8 cm/s is used to define the eddy limits (width8), while the “half-width” method defines the threshold as half of the eddy center velocity (width). Systematically, the half-width estimates are less than the 8 cm/s threshold estimates, so that the mean vertical width of all eddy encounters is 85-100 m (based on first half estimates). The average radial distance of all eddys is approximately 5 km, although individual radii vary from as little as 0.4 to as much as 19.1 km. The rotation sense of the eddys was overwhelmingly anticyclonic (72 versus 22 cyclonic, and 1 indeterminate).
The standard deviation of the radial velocities (vtsd) at the depth of maxv is also tabulated for each radius. In an ideal eddy, all of the velocity components are azimuthal, so the radial velocity component would be zero. Therefore, low values of vstd indicate better agreement between the estimated radial and azimuthal velocity components and theory, while high values indicate either poor data or eddy translational movements not accounted for by the analysis.
Furthermore, the azimuthal velocity components at the depth of the maxv are fit using 4 different parameterizations, and the root-mean-square (rms) error determinations are tabulated. The first parameterization is based on 3rd order polynomial fits, the next two parameterizations are based on “sink” and “stirred” eddy equations, and the fourth parameterization is based on Bessel functions. The polynomial fit almost always produces the least rms error from the observations (rms1). The “sink” and “stirred” eddy equations are based on rotating-tank studies by Carnevale et al. (1991), and are named after the method that was used to create each type of vortex. For both, the equations for azimuthal velocity are dependent on eddy radius and relative vorticity. Ranges of eddy radius and relative vorticity are used to generate curves of azimuthal velocity by radius, which are compared to the observations, and the best fit (least rms difference) is selected (rms2 for “sink”, and rms3 “stirred”). In a similar manner, the Bessel function parameterization is based on idealized eddy velocity equations after McEwen (1948), which are dependent on eddy radius, relative vorticity, and decay parameters. A range of Bessel functions are fit, and that which produces the least rms error from the observations (rms4) is saved.
Furthermore, strain and vorticity are computed along radii at the depth of the maximum velocity. These variables are not specifically tabulated in this report, but are provided in the binary output data. Inner (outer) refer to samples inside (outside) the radius of maximum velocity.
E. Output data format
The eddy data are stored in MATLAB binary format, and are organized into four files which contain the information from the four datasets (all provided via links on the right side of this page):
B92 b92eddy.mat
B92T b92teddy.mat
B97 b97eddy.mat
S97 s97eddy.mat
Each file contains the following variables:
HDR = [#, n, start, end, dur, dep, lat, lon, err, std stdc, espd] = encounter information
DAT1,2 = [n, min8, max8, width8, minh, maxh, width, maxv, rad, s, vstd] = radial data
E1,2 = [rms1, rms2, rms3, rms4] = fit errors (based on P, S, R, Q fits)
P1,2 = [a1, a2, a3, a4] = parametric fit constants
Q1,2 = [radius, zeta, D] = Bessel fit constants
R1,2 = [radius, zeta] = “stirred” fit constants
S1,2 = [radius, zeta] = “sink” fit constants
Y1,2 = [max, min, n_in, mean_in, std_in, n_out, mean_out, std_out] = strain
Z1,2 = [max, min, n_in, mean_in, std_in, n_out, mean_out, std_out] = vorticity
where 1,2 separate variables for the first-half and second-half estimates. Note that “n” in HDR is the number of all points in the event, “n” in DAT are the number of points in each radius, and “n” in Y and Z are the number of points in each radius according to inner or outer (maximum velocity included in both).
IV. Results
In this section, the results of the eddy encounters are presented numerically in tables from each dataset (Tables 3-14), graphically by dataset (Figures 10, 38, 60, and 79), and in 6-panel plots for each encounter (Figures 11-37, 39-59, 61-78, and 80-108). A list of the column headings in the tables is given in the previous section “Radial Property Estimates,” and the minimum, maximum, mean, and standard deviation from each dataset is included at the bottom of each table. Furthermore, locations of the eddys encountered for each dataset are plotted on Cartesian grids, with the radius of the maximum velocity of each eddy plotted to scale and numbered and depths indicated by marks.
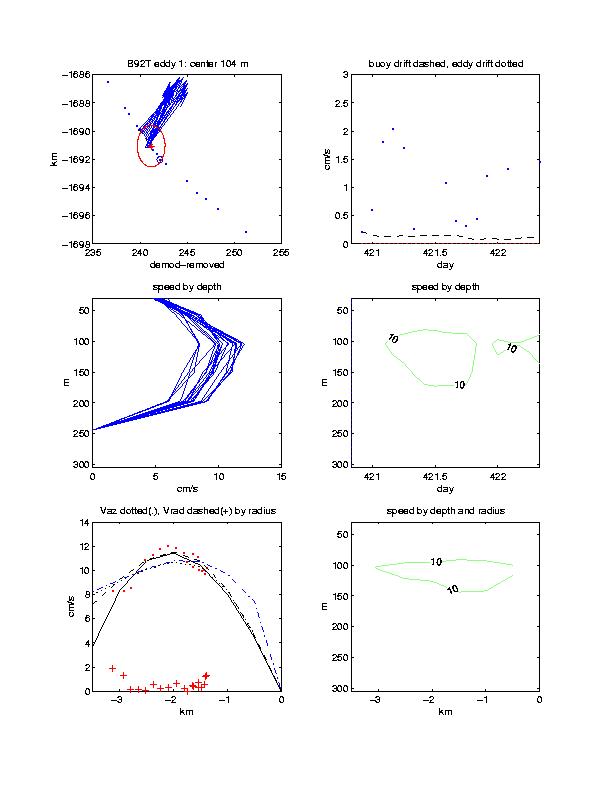
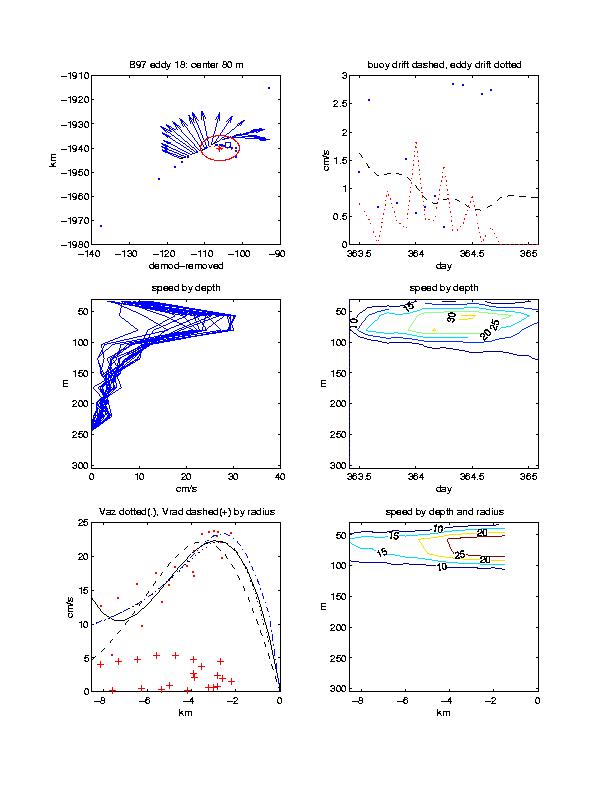
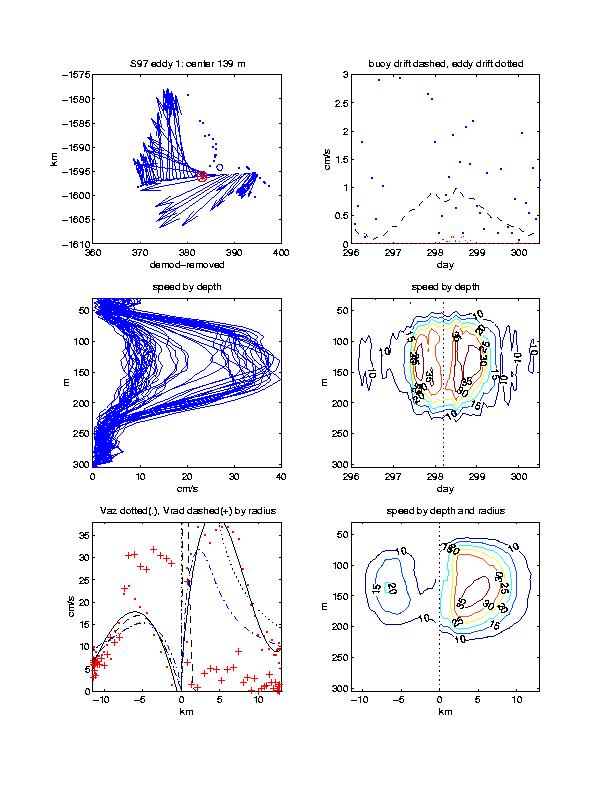
Velocity plots from each eddy encounter display characteristics of each feature along several different dimensions. In the upper left panel, the IOEB drift (converted to a Cartesian plane) is indicated by a dashed line, current vectors at the depth of the maximum velocity are indicated by arrows, dots indicate raw triangulated eddy centers, star indicates the median location, and circle indicates a statistical confidence region around the median. It is the dots within the circle that are normally used to describe the eddy translational drift. The eddy translational drift is plotted in the upper right panel by a dotted line, the change between each individual raw triangulation by dots, and the buoy drift speed by the dashed line, all as a function of time. In some cases (where espd = 0), the eddy center location is fixed when estimating the radial properties. All of the profiles as a function of depth are plotted in the middle left panel, and timeseries contours of current speeds by depth are plotted in the middle right panel. For comparison, the lower right panel plots contours of current speed by depth, after converting from time to distance along radii. The lower left plot along radii plots the azimuthal velocity at the center depth by dots, the radial velocity by crosses, the 3rd order parametric fits by solid lines, the “sink” fits by dotted lines, the “stirred” fits by dashed lines, and the Bessel fits by dash-dotted lines. All speeds are in cm/s.
All of the eddy encounters determined by the velocity threshold technique from IOEBs indicated in this report are plotted in Figure 9 with previously reported eddy encounters (from references in “Introduction”).
The 95 probable eddy encounters determined are subdivided into two additional categories: 81 subsurface eddy encounters, and 29 eddy core encounters.
The criteria for a subsurface eddy encounter is subjective, but very straightforward - a clearly defined sub-surface maximum in the velocity profile. All but two of the "rejected" encounters are from the transmitted data, where the low vertical resolution makes it difficult to distinguish surface from sub-surface maxima. It is likely that some of the rejected encounters are in fact shallow subsurface eddies. The 14 rejected encounters (which are still included in “Results”) are:
B92: 27
B92T: 6, 10, 11, 12, 13, 15, 18, 19, 20
B97T: 2, 4, 14
S97: 25
In order to obtain reliable physical and dynamical properties from the eddies, it is necessary for the transect to have encountered the eddy core. The eddies in this category actually satisfy three objective criteria, indicating a tight cluster of center estimates from the geometric technique, a smoothly varying tangential velocity, and a transect that passed "inside" of the radius of maximum velocity. The three criteria for rejection are:
(1) If std > 3.0 km, the center is suspect.
(2) If vstd > 3.0 cm/s, the fit is suspect.
(3) If Rmin < Ro, maxv and rad are suspect. Where 'Rmin' = minimum radius during the encounter (a measure of how close to the encounter passed to the estimated center) and Ro = estimated eddy radius.
The 29 eddy core encounters are:
B92: 2, 5, 6, 7, 8, 9, 12, 13, 18, 19, 26,
B92T: 1, 2, 3, 4, 5, 7, 21
B97T: 13
S97: 6, 10, 13, 14, 22, 23, 24, 26, 27, 28
A. B92 IOEB eddys:
The portion of the B92 ADCP dataset that was stored in the instrument and recovered corresponds to the time when elevated spectral densities were found in the low frequency eddy band (3-5 days) while the IOEB buoy was located in the Canada Basin (Plueddemann et al., 1998). In the present analysis we find numerous encounters with eddies centered in the range 90 to 160 m, most which are anticyclonic and extend over 100 m vertically and have very distinct maximum velocities between 25 and 40 cm/s. The radial distances of the eddys vary from 1 to 12 km, with most in the 3 to 7 km range. However, a number of the encounters are just fleeting glimpses of the outer edge of an eddy (1, 3, 8, 11, 14, 15, 16, 17, 19, 20, 21, 23, 24), and others are deeper features (7, 27). Only 7 encounters completely transect an eddy (2, 6, 9, 10, 12, 18, 26), while 5 others only provide estimates along one radial section (4, 5, 13, 22, 25).
B. B92T IOEB eddys:
The B92T transmitted ADCP dataset continues the timeseries after the end of the B92 recovered data until the instrument stopped providing data, and encompasses the region over the Northwind Ridge and Chukchi Cap. Here the spectral densities in the eddy band are greatly reduced compared to the Canada Basin (Plueddemann et al., 1998), and this is evident in the differences in absolute current speed anomalies between Figures 3 and 4. Based on a vertical resolution of only 4 transmitted current bins, the B92T dataset includes many smaller (1-2 km radial distance), less intense (10-20 cm/s maximum velocity), and more shallow (57 m) features than in the B92 Canada Basin timeseries (some which are not distinctly subsurface). There are 3 clear cross-sections through eddys: one shallow (2), one mid-depth (3), and one deep (4), and only 5 other eddys (5, 6, 7, 12, 13) which provide radial information close to the eddy center.
C. B97 IOEB eddys:
The B97 dataset consists entirely of 10 bins of transmitted ADCP current velocities, since the IOEB was never recovered. The observations begin in the northeast Canada basin, and terminate at the mouth of Barrow Canyon. During the first 6 months of the timeseries, there are few instances where the absolute velocities exceed 10 cm/s (Figure 5), but many in the southern Canada Basin. Out of the 18 encounters in the B97 dataset, 4 were cross-sectioned (1, 3, 8, 13), 4 provide one radial estimate (2, 4, 9, 14), and 3 were deep (5, 15, 17).
D. S97 IOEB eddys:
Deployed in conjunction with the SHEBA field program, the S97 IOEB acquired ADCP current data approximately 50-100 km away from the main camp between October 1, 1997 and October 1, 1998. Twenty-nine possible eddys were encountered: the first 17 in the Canada basin were mostly halocline, none were detected on the northwest slope of the Northwind Ridge, 12 more were detected over the Chukchi Cap, mostly of the smaller surface variety. In this respect, the upper ocean current variability of the S97 dataset resembles the combined B92 and B92T datasets (compare Figure 6 with Figures 3 and 4) at a different timescale, consistent with the similarity of the drift tracks. This suggests that in the upper ocean beneath the pack ice in the Beaufort Gyre there is a difference in the character of the eddy fields, roughly bounded along the lines of the Northwind Ridge.
Acknowledgements
Support for this research has been provided by the National Science Foundation (NSF) Arctic System Science (ACSYS) program and the Office of Naval Research (ONR) High Latitude (HL) program. The IOEB program and raw ADCP environmental data were accomplished in collaboration with the Japan Marine Science and Technology Center (JAMSTEC). We are grateful to T. Takizawa (JAMSTEC), and K. Hatakeyama (JAMSTEC) for their contributions.
In addition to the authors, others were responsible for developing portions of the program code used in the analysis. We acknowledge N. Galbraith for developing the Janus routines, M. McPhee (McPhee Research) for providing the demodulation routines, and C. Edwards for developing the eddy center estimation algorithm. The geomagnetic declination model is based on the IGRF model provided by the National Geophysical Data Center (NGDC).
Most of the algorithms and many of the plots presented in this document were developed in MATLAB releases 10 and 11. The polar stereographic project plots were generated using the GMT-SYSTEM 3.3, and bathymetry from the International Bathymetric Chart of the Arctic Ocean (IBCAO).
References
Belyakov, L.N., Cause of the emergence of sporadic deep flows in the Arctic basin, Problemy Arktiki i Antarktiki, 39, 25-32, 1972.
Carnevale, G.F., R.C. Kloosterziel, and G.J.F. van Heijst, Propoagation of barotropic vortices over topography in a rotating tank, J. Fluid Mech., 233, 119-139, 1991.
Coachman, L.K., and J.L. Newton, Water and ice motion in the Beaufort Sea, spring 1970, AIDJEX Bull., 12, 61-91, 1972.
D’Asaro, E.A., Observations of small eddies in the Beaufort Sea, J. Geophys. Res., 93, 6669-6684, 1988.
Galt, J.A., Current measurements in the Canadian Basin of the Arctic Ocean, summer, 1965, University of Washington, Department of Oceanography Technical Report, 184, 17 pp., 1967.
Honjo, S., T. Takizawa, R. Krishfield, J. Kemp, and K. Hatakeyama, Drifting Buoys Make Discoveries About Interactive Processes in the Arctic Ocean, EOS trans. AGU, 76, 209-219, 1995.
Hunkins, K.L. Subsurface eddies in the Arctic Ocean, Deep-Sea Res., 21, 1017-1033, 1974.
Krishfield, R., K. Doherty, and S. Honjo, Ice-Ocean Environmental Buoys (IOEB); Technology and Deployment in 1991-1992, Woods Hole Oceanographic Institution Technical Report, WHOI 93-45, pp. 138, Woods Hole, MA, 1993.
Krishfield, R., S. Honjo, T. Takizawa, and K. Hatakeyama, IOEB Archived Data Processing and Graphical Results from April 1992 through November 1998, Woods Hole Oceanographic Institution Technical Report, WHOI 99-12, pp. 88, Woods Hole, MA, 1999.
Manley, T.O., and K. Hunkins, Mesoscale eedies of the Arctic Ocean, J. Geophys. Res., 90, 4911-4930, 1985.
McEwen, G.F., The dynamics of large horizontal eddies (axes vertical) in the ocean off southern California, J. Mar, Res., 7, 188-216, 1948.
McPhee, M.G., Analysis and Prediction of Short-Term Ice Drift, J. Offshore Mech. Arctic Eng., 110, 94-100, 1988.
Muench, R.D, J.T. Gunn, T.E. Whitledge, P. Schlosser, and W. Smethie Jr., An Arctic cold core eddy, J. Geophys. Res., 105, 23,997-24,006, 2000.
Newton, J.L., K. Aagaard, and L.K. Coachman, Baroclinic eddies in the Arctic Ocean, Deep-Sea Res., 21, 707-719, 1974.
Padman, L., M. Levine, T. Dillon, J. Morison, and R. Pinkel, Hydrography and microstructure of an Arctic cyclonic eddy, J. Geophys. Res., 95, 9411-9220, 1990.
Plueddemann, A.J., R. Krishfield, T. Takizawa, K. Hatakeyama and S. Honjo, Upper ocean velocities in the Beaufort Gyre, Geophys. Res. Lett., 25, 183-186, 1998.
Plueddemann, A.J., A.L. Oien, R.C. Singer, and S.P. Smith, A Data Processing Module for Acoustic Doppler Current Meters, Woods Hole Oceanographic Institution Technical Report, WHOI 92-05, pp. 71, Woods Hole, MA, 1992.
Somov, M.M., ed. Observational Data of the Scientific Research Drifting Station of 1950-51, I. (translated by American Meteorological Society document AD117134), 1954.
