Ocean surface mixed layer
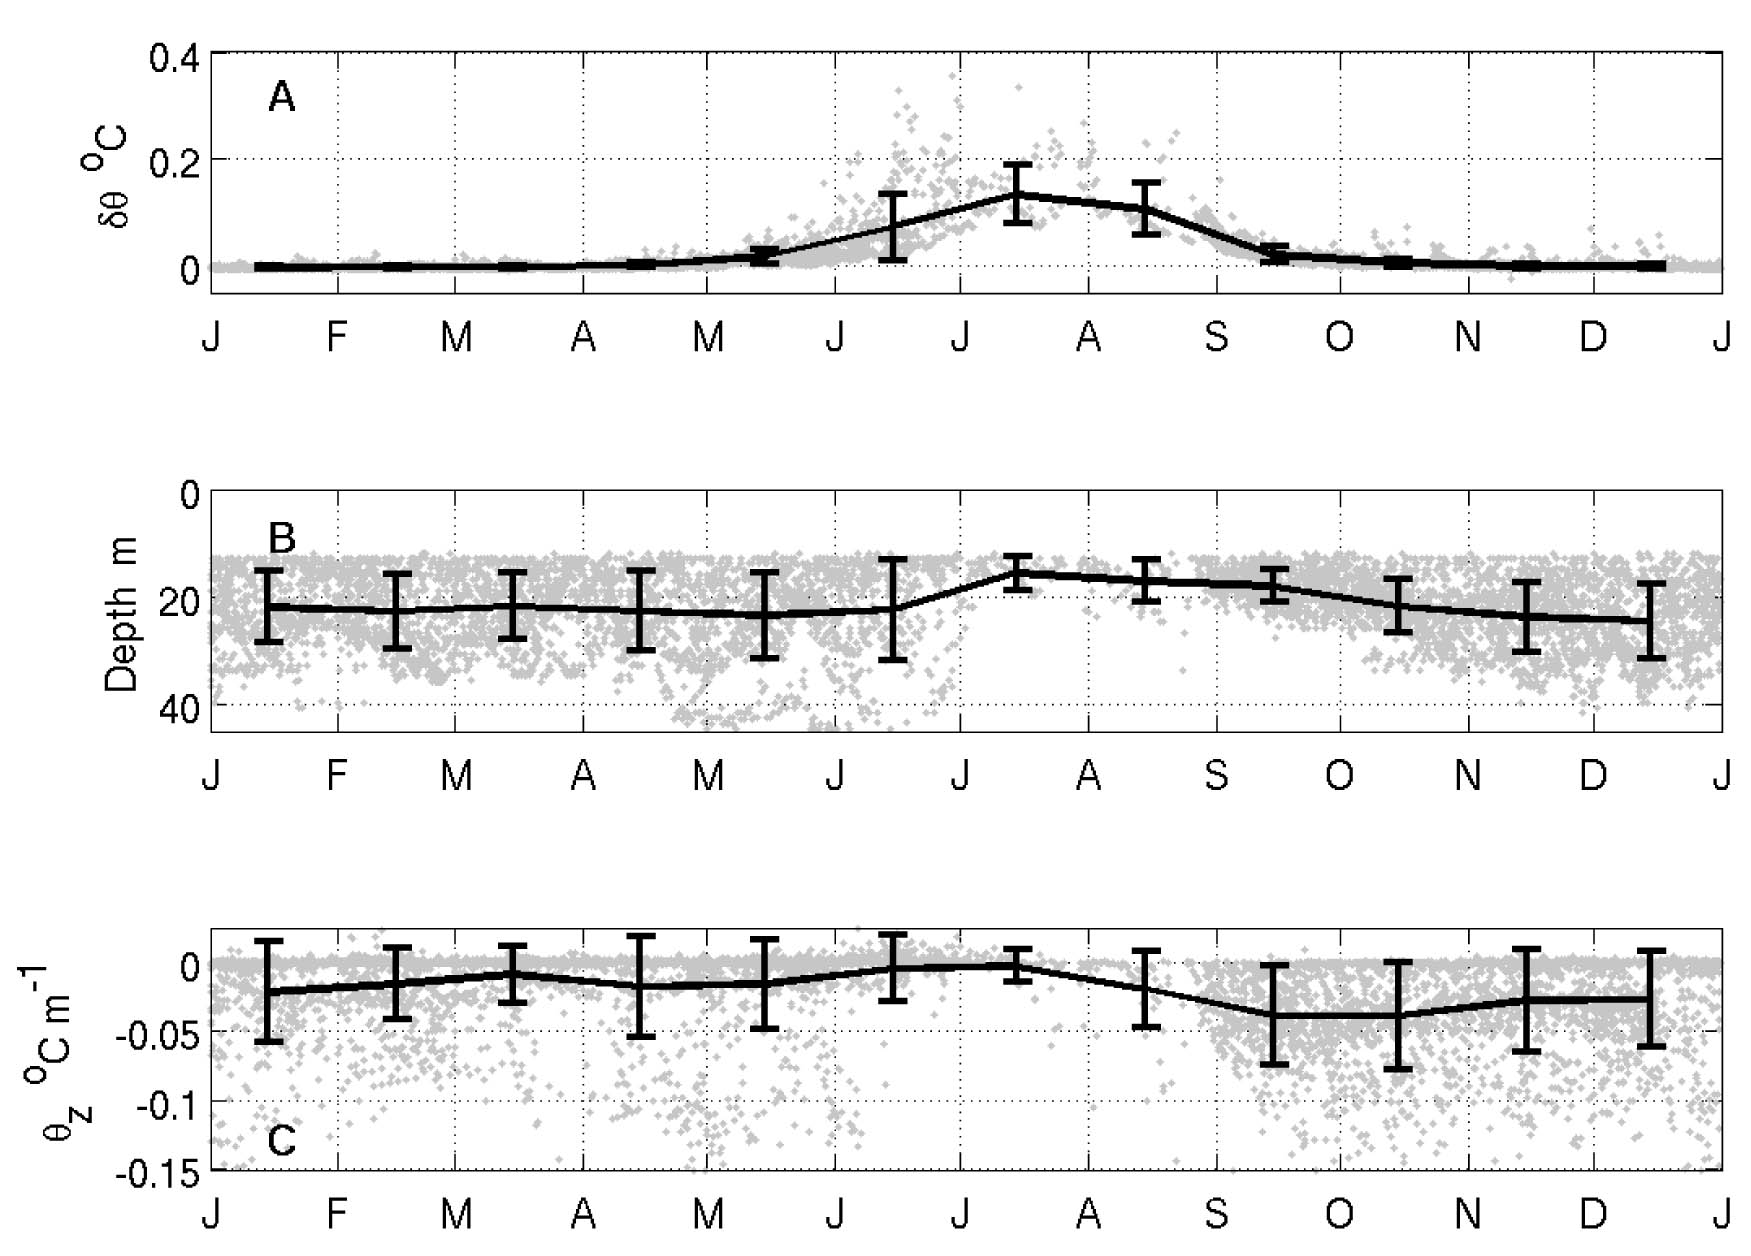
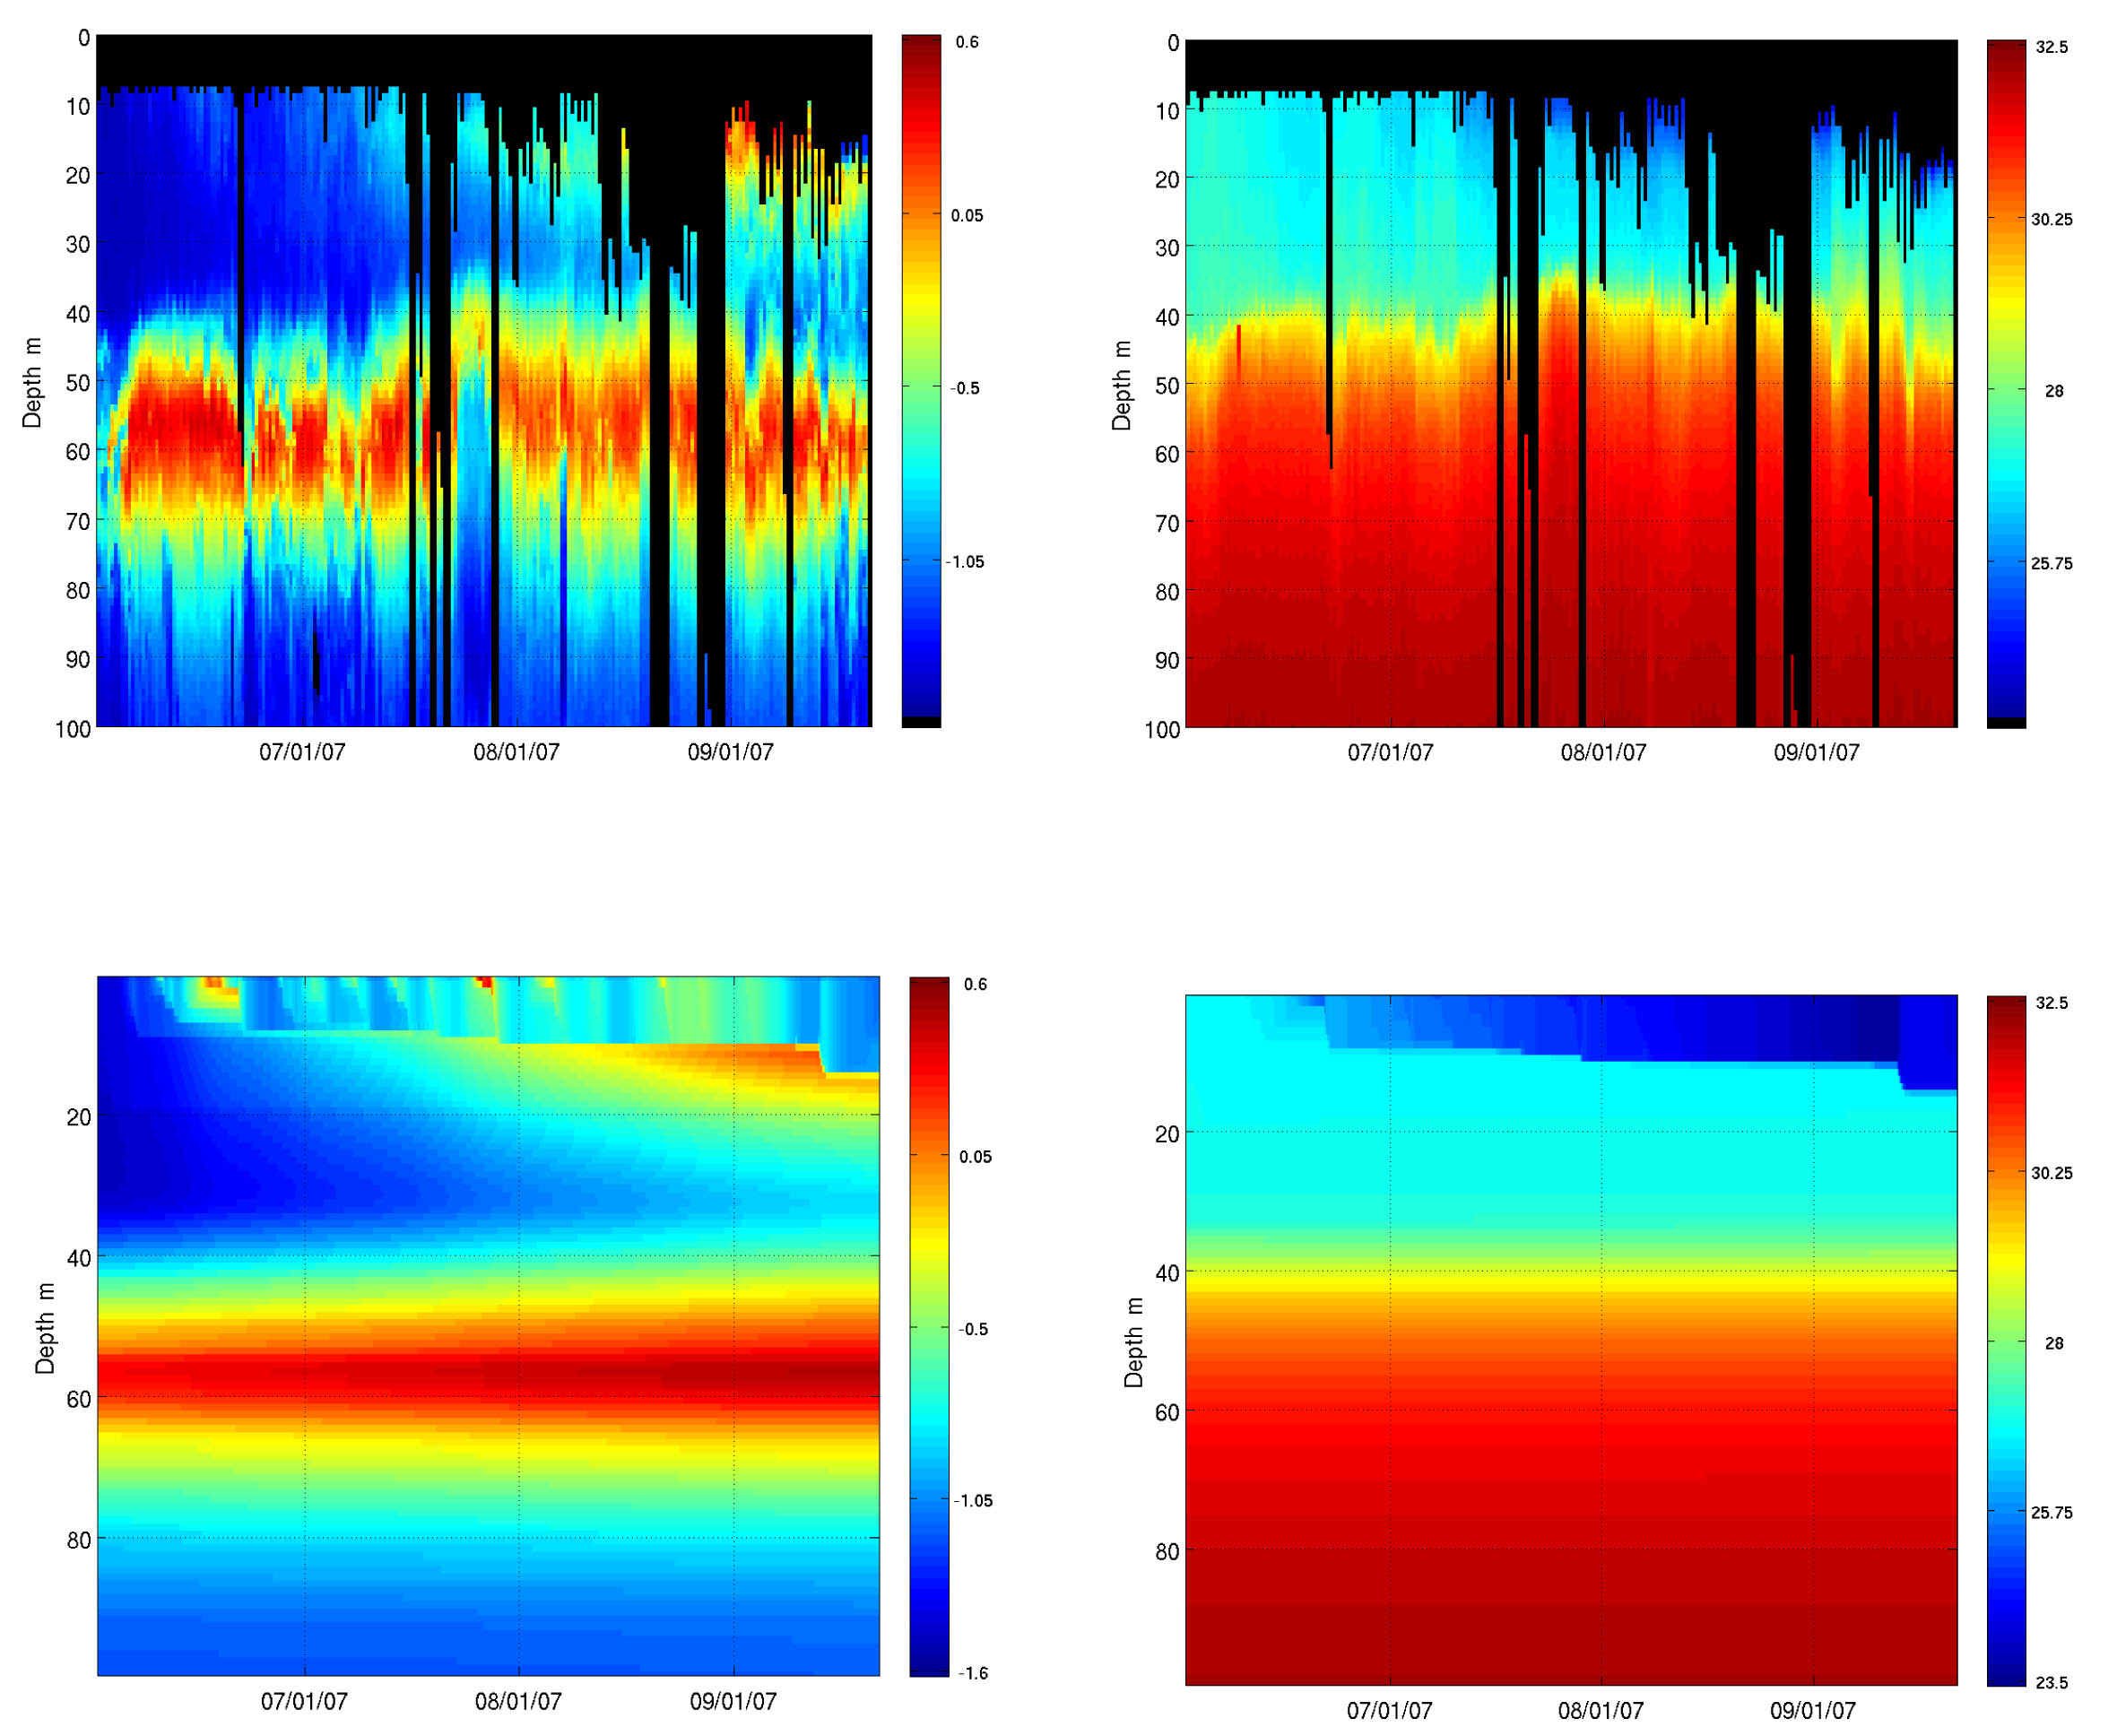
Variations in the Arctic Central Canada Basin mixed layer properties are documented based on a subset of nearly 6500 temperature and salinity profiles acquired by Ice-Tethered Profilers during the period summer 2004 to summer 2009 and analyzed in conjunction with sea ice observations from Ice Mass Balance Buoys and atmosphere-ocean heat flux estimates. The July-August mean mixed layer depth based on the Ice-Tethered Profiler data averaged 16 m (an overestimate due to the Ice Tethered Profiler sampling characteristics and present analysis procedures) while the average winter mixed layer depth was only 24 m, with individual observations rarely exceeding 40 m. Guidance interpreting the observations is provided by a one-dimensional ocean mixed layer model. The analysis focuses attention on the very strong density stratification at the base of the mixed layer in the Canada Basin that greatly impedes surface layer deepening and thus limits the flux of deep ocean heat to the surface that could influence sea ice growth/decay. The observations additionally suggest that efficient lateral mixed layer restratification processes may be active in the Arctic, also impeding mixed layer deepening.
Reference: Toole, J.M., M.-L. Timmermans, D.K. Perovich, R.A. Krishfield, A. Proshutinsky and J.A. Richter-Menge, 2010: Influences of the Ocean Surface Mixed Layer and Thermohaline Stratification on Arctic Sea Ice in the Central Canada Basin. Journal of Geophysical Research, accepted.

