GPS Transient Detection
Figure 1. Map gives the horizontal components of the transient deformation field between the time of the foreshock and the mainshock as estimated by the NSF. Panels on the right show the east component time series for the 4 stations denoted by the red triangles on the map with three or four digits of station code (910: Esashi, 911: Iwate-Ohigashi, 914: Miyagi-Towa, 1145: Iwate-Kawasaki-A). The blue dots are the JPL 30 minute solutions minus our estimate of the reference frame error. The red line is the sum of the benchmark, transient, and Heaviside components of the time series as estimated by the NSF. The black curve is the transient deformation field as estimated by the filter. The y-axis of each time series plot is in meters.
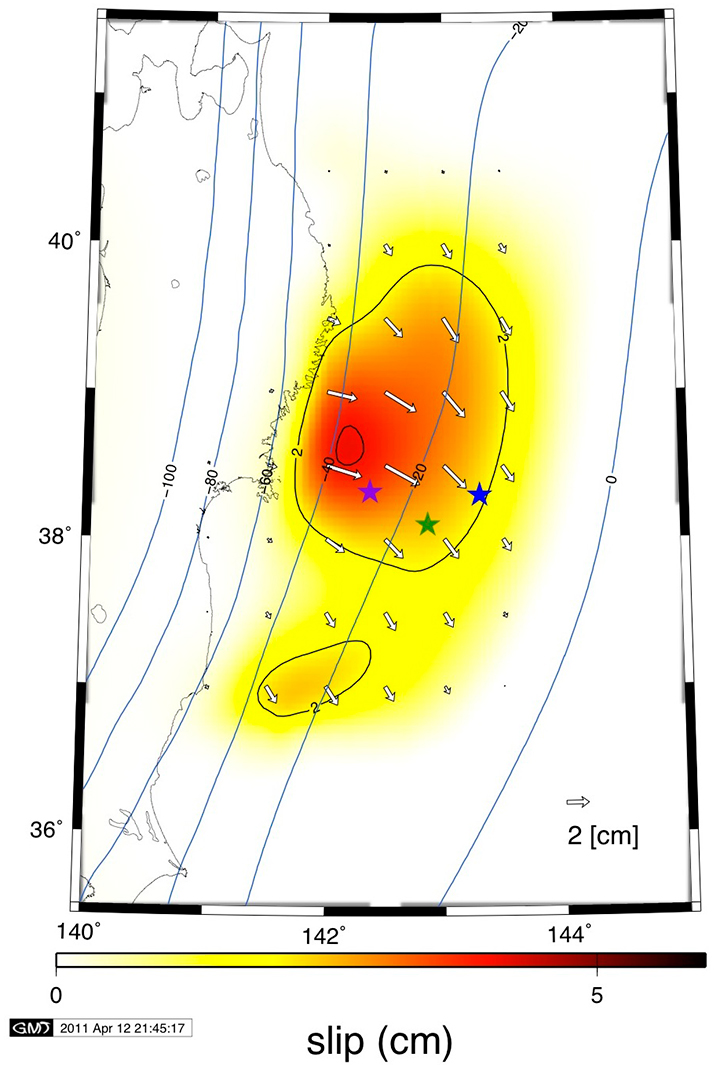
Figure 3 a. Transient slip distribution, The black, green and blues contours represent slip, its error and depth of the plate interface. The slip contour is 2.0 cm, and the error contour is 1.5 cm. Note that error is scaled by the misfit. Error is larger in the inside of the contour, and is low near the trench because the slip there is constrained to be small. The maximum value of error is 1.9 cm. The black, green and blue contours represent slip, standard deviation of slip and depth of the plate interface. The blue asterisk shows the epicenter of the March 9 foreshock, and the green and purple asterisks indicate epicenter of the March 11 mainshock by JMA and USGS, respectively. b. Fit to horizontal displacement data. Black and red arrows represent observed and predicted displacements.
Collaborators
Matt Wei (WHOI)
Shin'ichi Miyazaki (Kyoto Univ)
Paul Segall (Stanford Univ)
Rowena Lohman (Cornell Univ)