Dispatch 3: CTD cast, transit, repeat
Ashley Arroyo (Yale University)
September 1, 2024
22:20 UTC, 72.06°N 133.03°W
Conditions:
- Partly cloudy
- 0% sea ice cover
- 5 °C
- Sunrise: 31-Aug-2024 06:50:28 -06
- Sunset: 31-Aug-2024 22:57:04 -06
- Day length: 16hour 6min 35sec
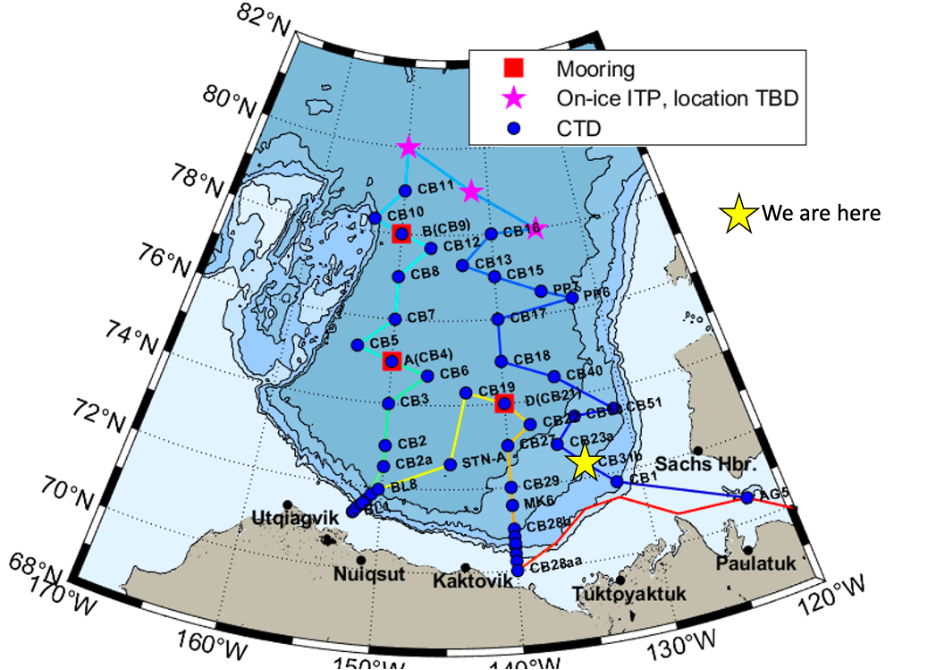
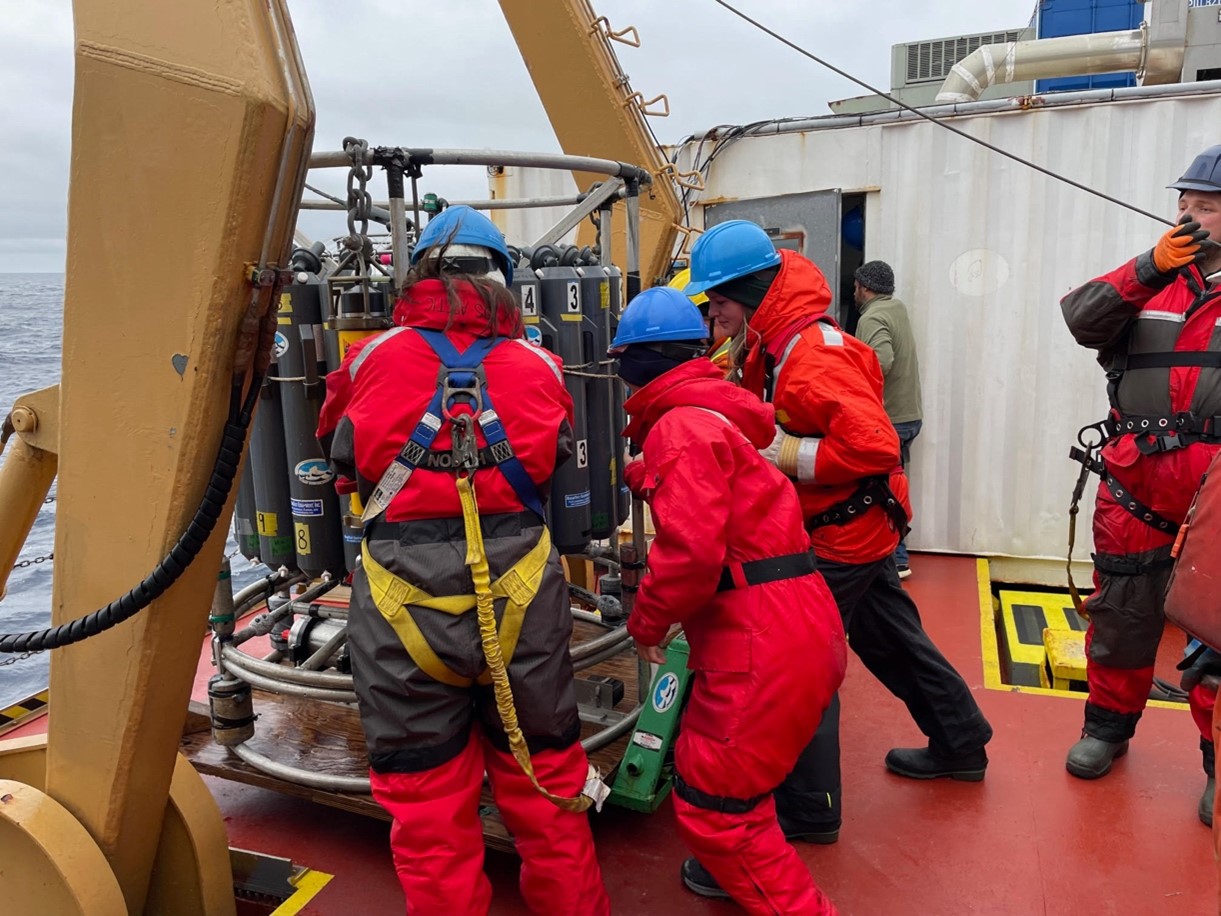
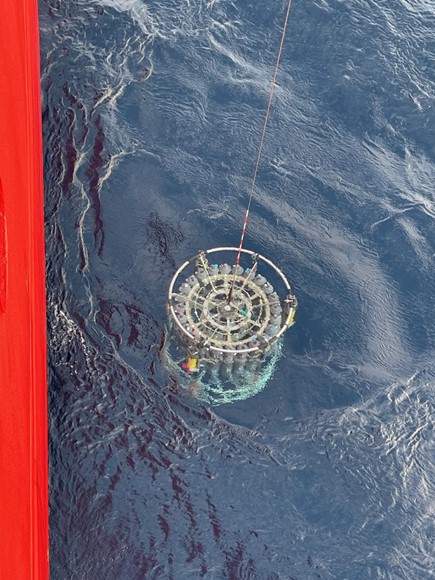
Today, the CTD watch standers (both day and night watches) were kept busy with rosette casts and water sampling. We completed two full CTD casts (stations CB-1 and CB-31b). For each station, we perform the cast by lowering the rosette to the ocean bottom, and then back up to the surface while collecting water samples in the Niskin bottles on the way up. Once the rosette was back on board, the watch standers quickly went to work collecting the water samples from the bottles which will be measured for chemical properties (e.g., carbon, oxygen, nutrients, and more). Once the sampling is complete, a few members of the watch team will begin filtering the water for certain properties – these include chlorophyll and organic matter (for example, see previous dispatch here to learn about filtering chlorophyll).
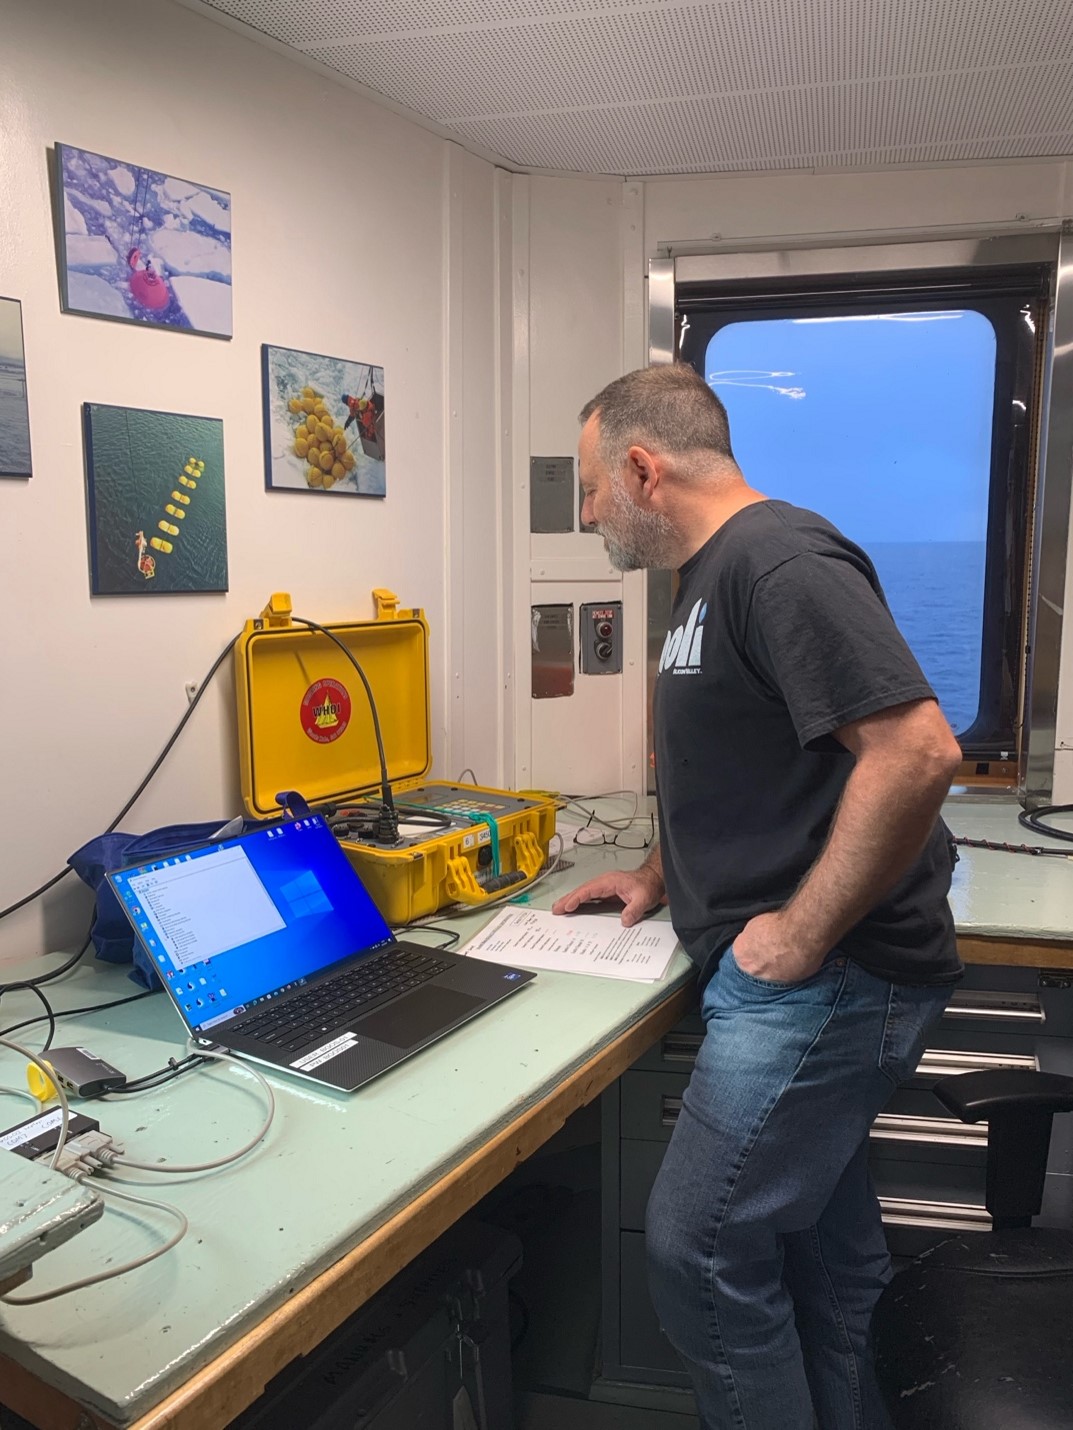
In addition to the typical procedure for the CTD casts, the mooring/buoy team from Woods Hole Oceanographic Institution (WHOI) fastened their acoustic releases (which are used to locate and release the moorings) to the rosette and asked for the rosette to hang out near the ocean bottom while they tested their release systems to ensure the equipment that will be deployed on the deep moorings will be functional. Once that was complete (and successful), they gave us a phone call to let us know that we could proceed with our CTD operations.
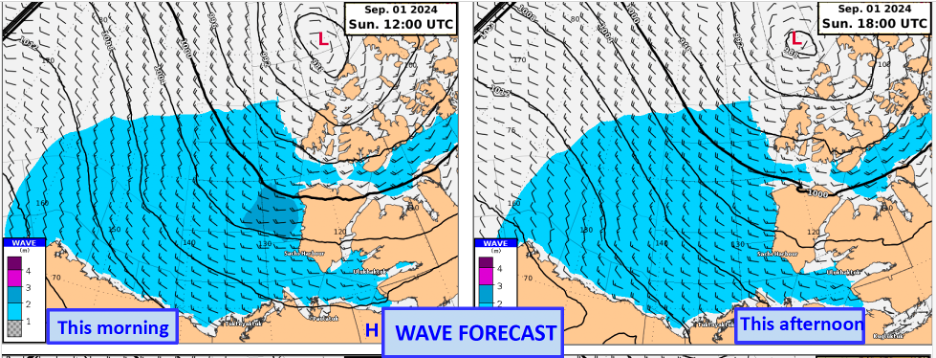
We are having much better weather today, as the low-pressure system that was causing rough seas has mostly moved out of the area. We continue to steam northwest at ~12 knots to our next station, CB23a.
