Skip to content

Freshwater Content Gridded Data

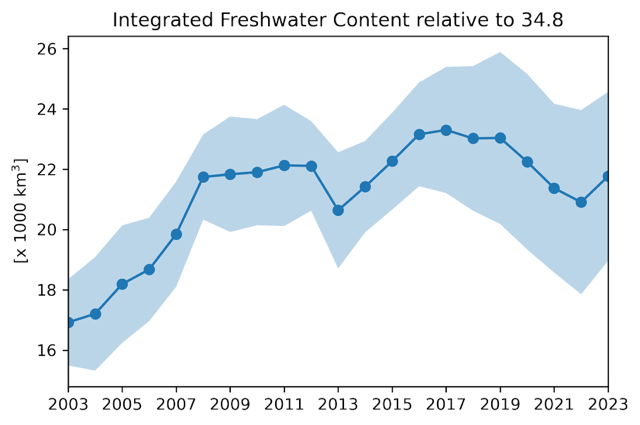
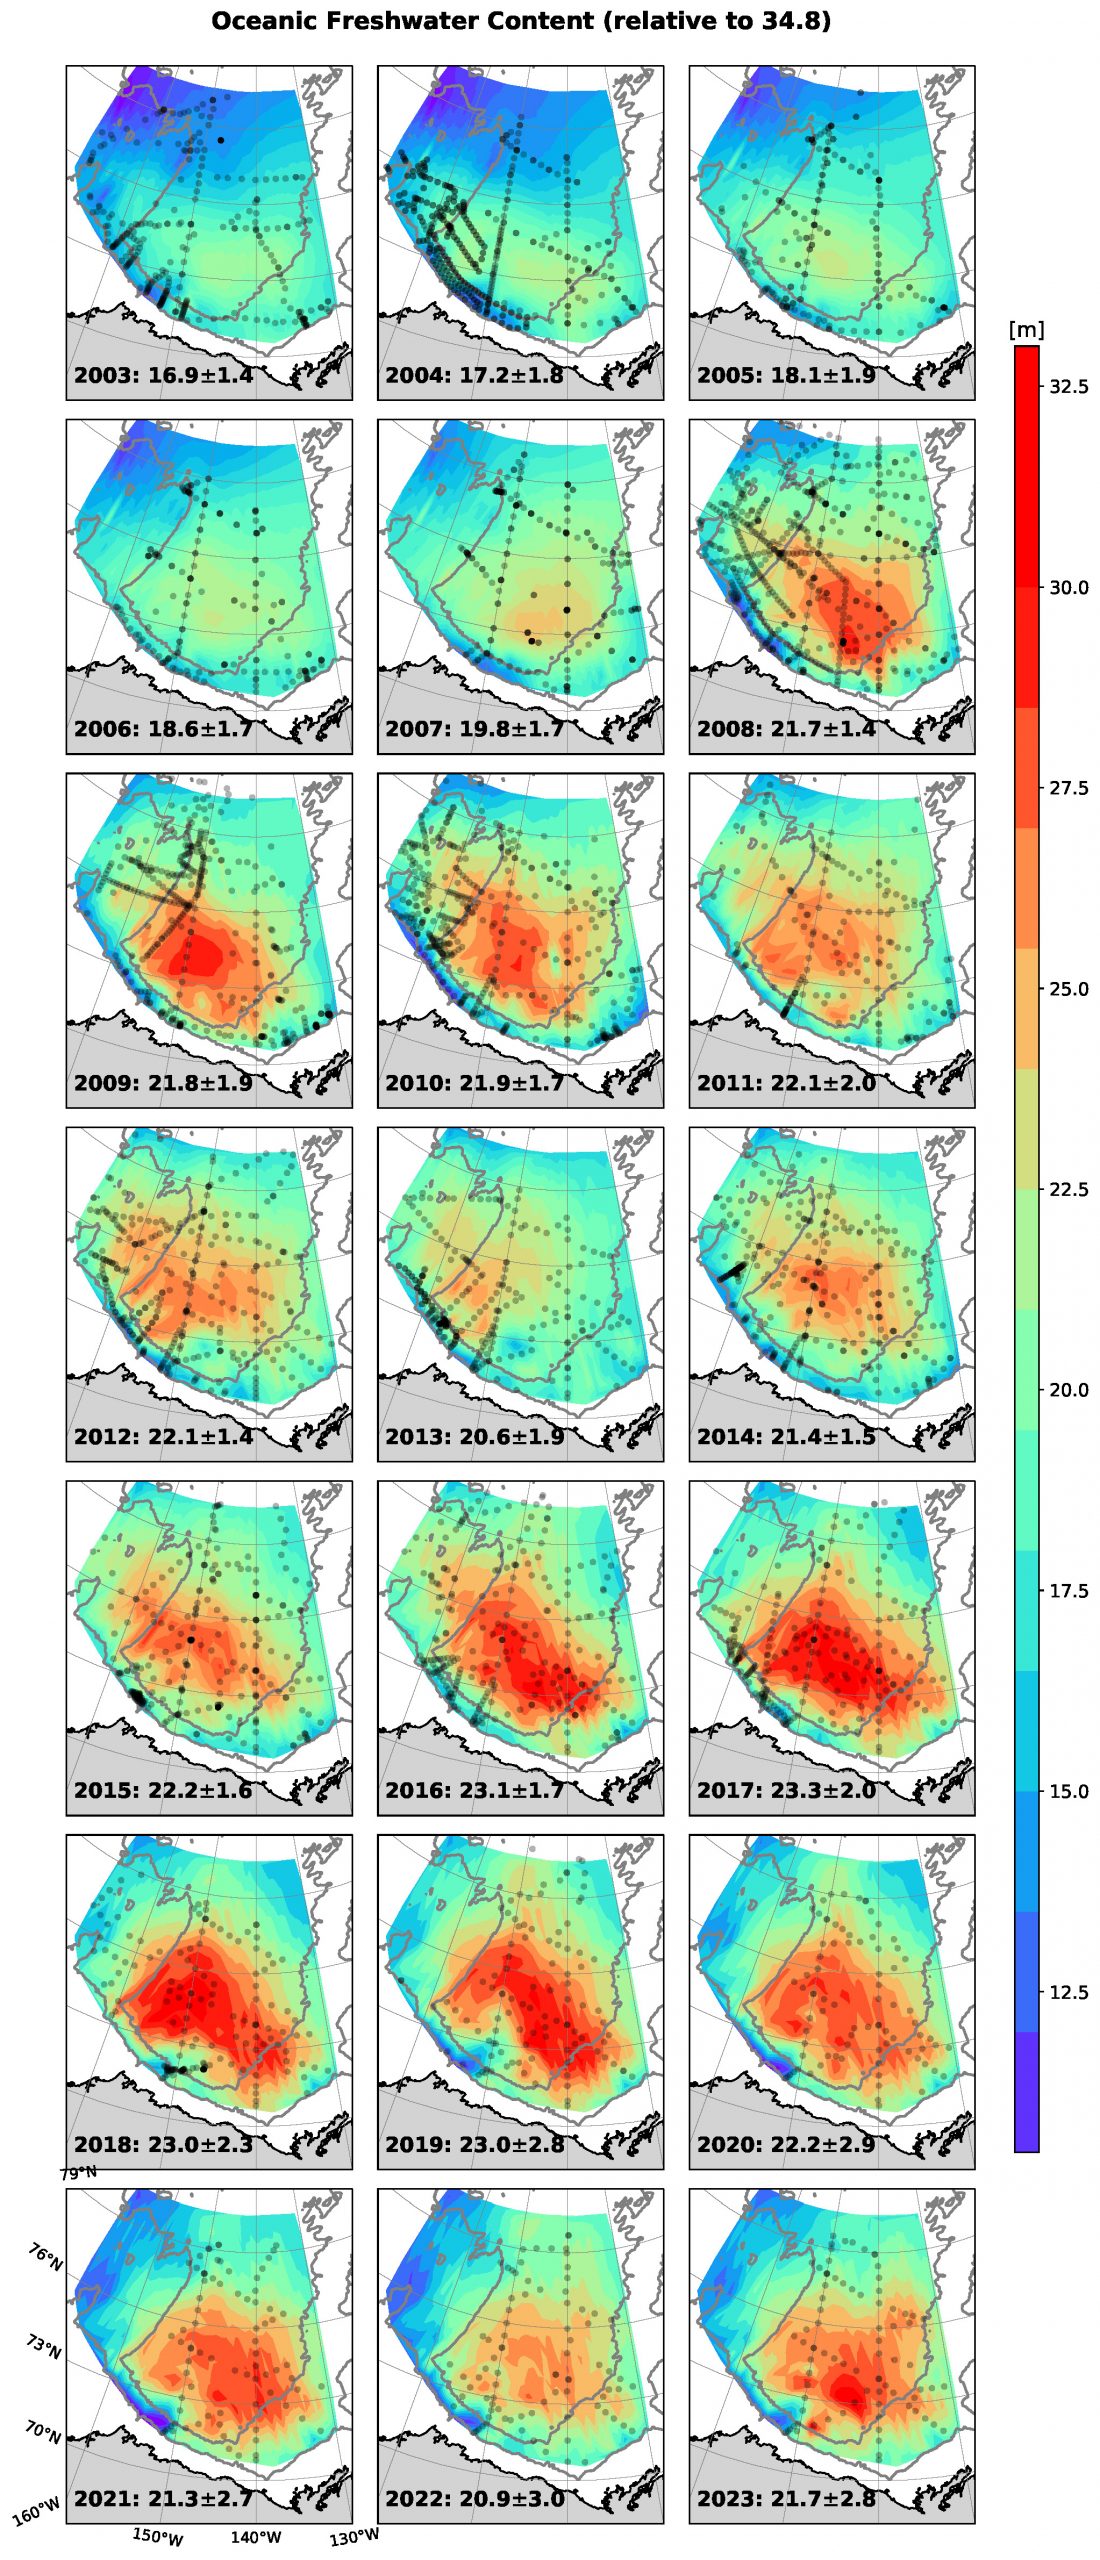
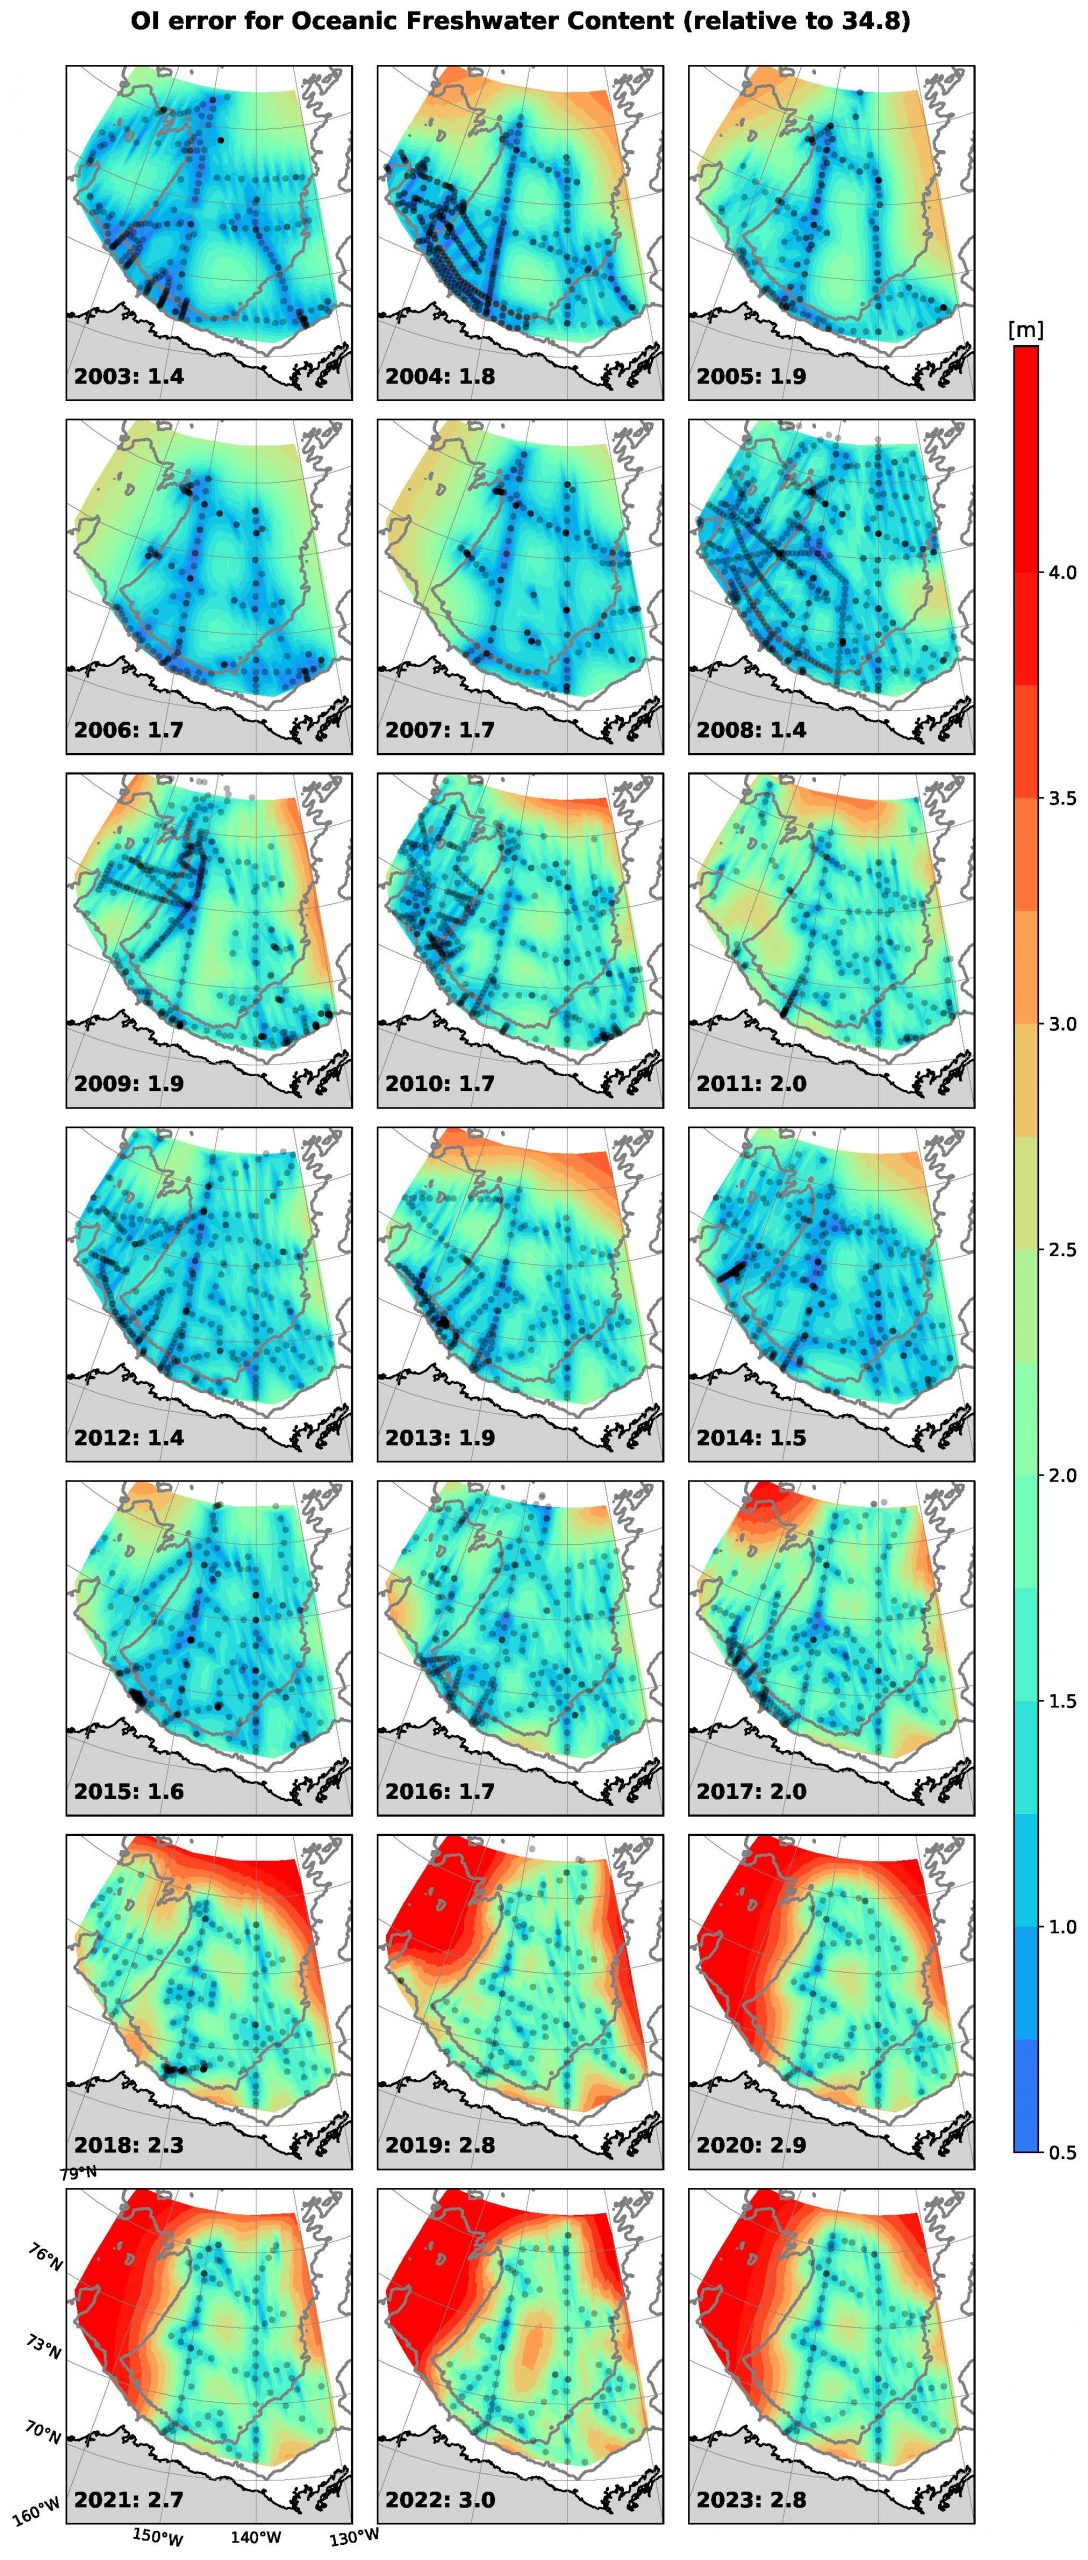
Estimates of liquid freshwater content (hereafter, FWC) of the Beaufort Gyre region (Figure 1) seawater are computed following Proshutinsky et al. (2009) using CTD, XCTD, and UCTD profiles collected each year from July through October: a total of 3224 water-column profiles in the 2000s, and 2331 profiles in the 2010s. Spatial maps (on a 50-km square grid) of FWC distribution were constructed in the region, which is defined to be between 70˚N and 80˚N, and 130˚W - 170˚W where water depths exceed 300 m, using optimal interpolation for each year from 2003 through 2017 (Figure 2). Spatially-integrated fresh water volumes for the region (encompassing an area of 1.023 x 10⁶ km2) are labelled for each year on each panel in Figure 2, with uncertainties determined from combining the uncertainties in the profiles with the optimal interpolation errors shown in Figure 3.
Uncertainties for each grid cell, determined using the optimal interpolation technique previously described in Proshutinsky et al. (2009), were updated and are presented in Figure 3.
Figure 4 shows freshwater content changes in the Beaufort Gyre region in 2003-2017 and freshwater content changes in different layers with salinities less than 30, between 30 and 33.8 and between 33.8 and 34.8.
Gridded data are available in the  “2003-2018” folder and more information about data and figures illustrating the data are provided in the folder entitled  “Data Description.”
Figure 1a) Beaufort Gyre Observational System assets configuration with A-D mooring locations depicted as stars, and sites of “standard” CTD stations where observations of sea ice and water physical and geochemical parameters have been conducted over the period 2003-2017; b) Time-averaged summer freshwater content (relative to reference salinity 34.8, m; colors and contours) in the Beaufort Gyre region for 1950s-1980s and 2013-2017. The colored area of the 2013-2017 chart shows the Beaufort Gyre 50x50 km grid coverage.
Figure 4 Time-series of BGR FWC volume (103 km3) in different layers defined by salinity (S) ranges: deep layer (S > 33.8, yellow bars), middle layer (30 < S < 33.8, cyan bars), and surface layer (S < 30, orange bars). Note that the bars are not stacked, but that the green bars represent total FWC. Error bars depict uncertainties in FWC estimates. Linear trends (km3a-1) are shown by dotted lines. The left-most wide bars are FWC volume derived from summer climatology 1950-1989 (see Timokhov and Tanis, 1998). Trend errors are estimated at 95% confidence interval.
References
Proshutinsky, A., Krishfield, M.-L. Timmermans, J. Toole, E. Carmack, F. Mclaughlin, W. J. Williams, S. Zimmermann, M. Itoh, & K. Shimada (2009), Beaufort Gyre freshwater reservoir: State and variability from observations, Journal of Geophysical Research, 114, 1–25, doi:10.1029/2008JC005104.