Freshwater Content in the Beaufort Gyre: Data from Observations, Russian Climatology and Models
Table of Contents
TABLE OF CONTENTS
LIST OF FIGURES
LIST OF TABLES
INTRODUCTION
METHODS
OBSERVED PROFILE DATA
HISTORICAL CLIMATOLOGICAL DATA
MODEL DATA
RESULTS
List of Figures
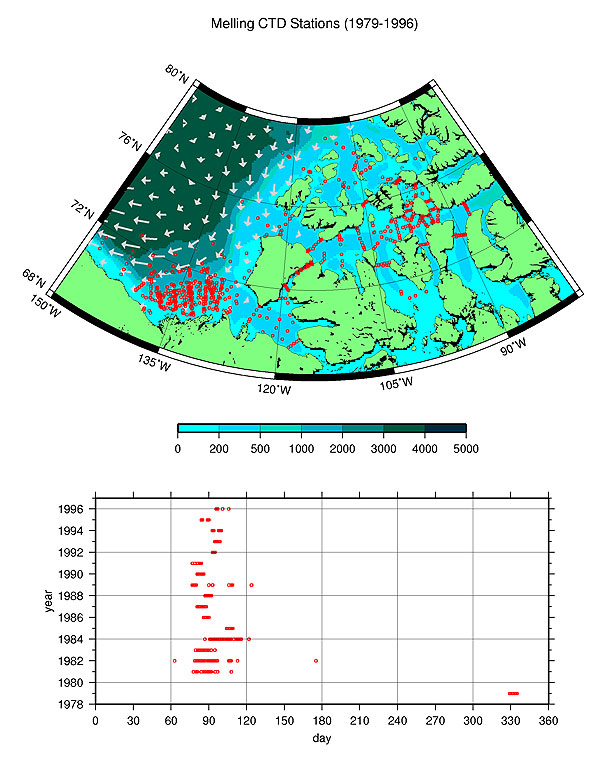
Figure 1. Locations and time distribution of Melling CTD data.
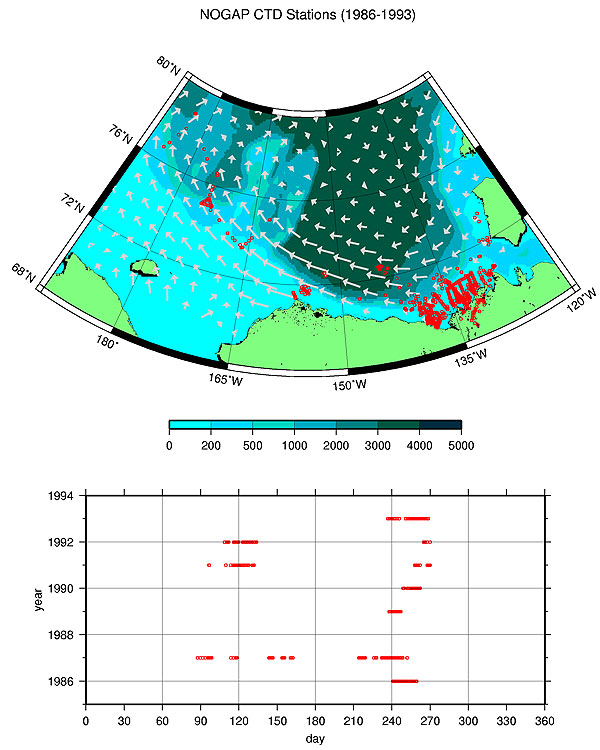
Figure 2. Locations and time distribution of NOGAP CTD data.
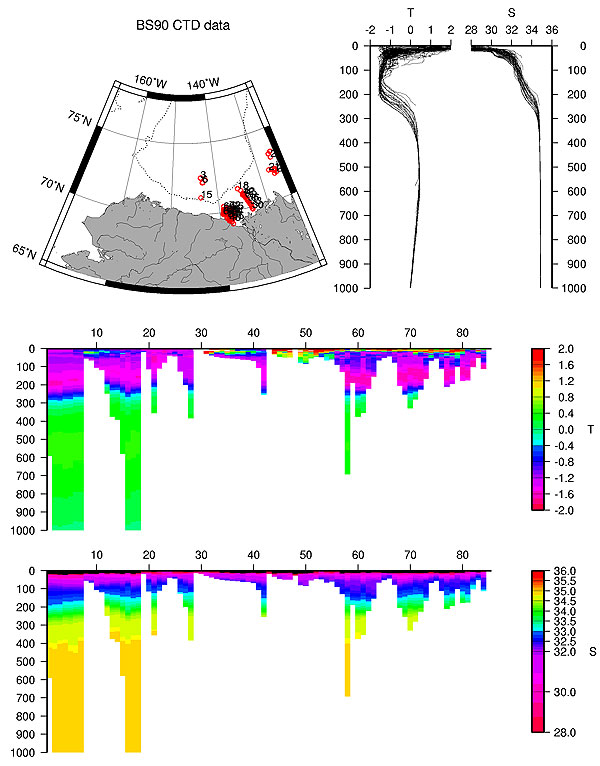
Figure 3. Locations, profiles, and sections of IOS 1990 CTD data.
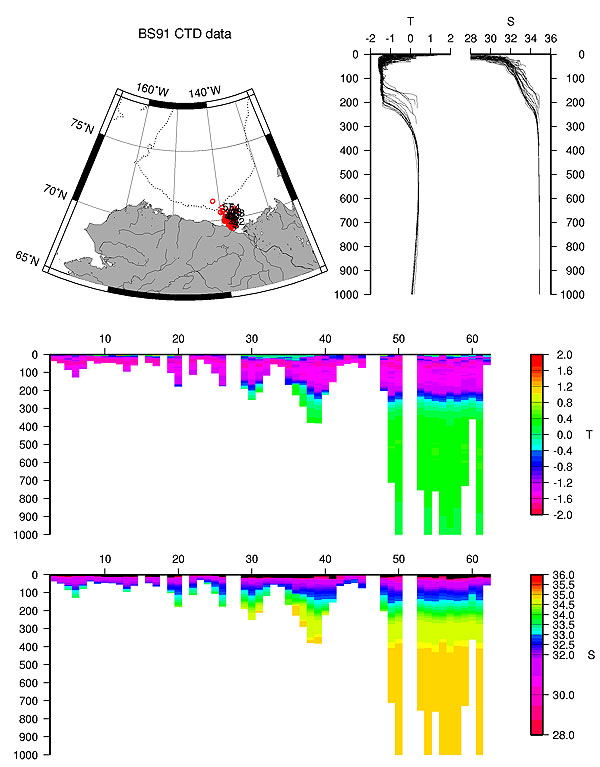
Figure 4. Locations, profiles, and sections of IOS 1991 CTD data.
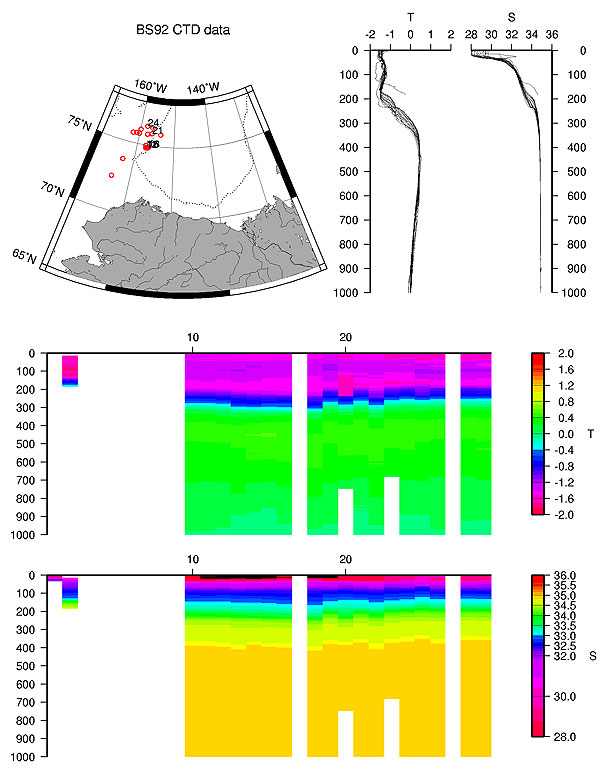
Figure 5. Locations, profiles, and sections of IOS 1992 CTD data.
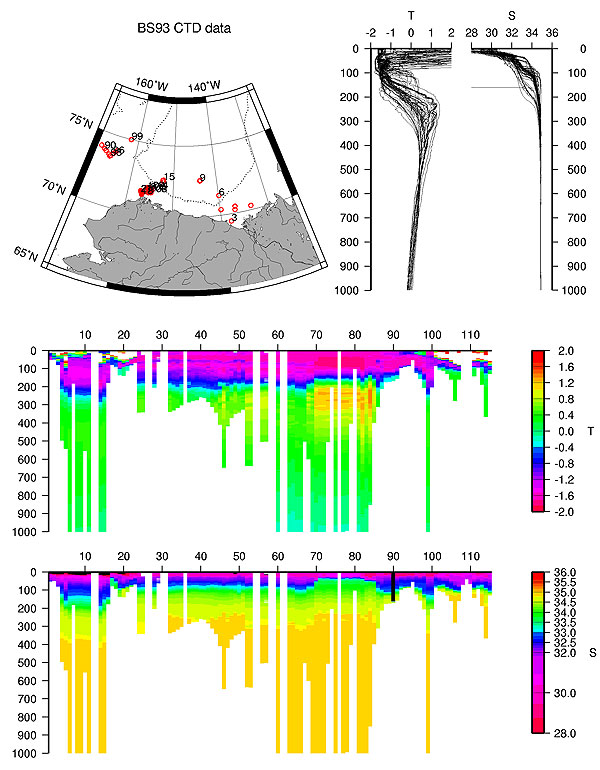
Figure 6. Locations, profiles, and sections of IOS 1993 CTD data.
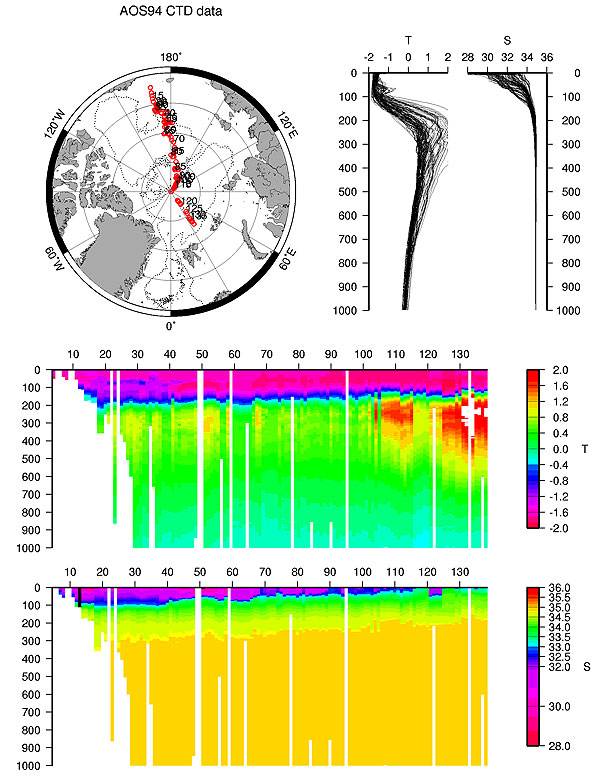
Figure 7 Locations, profiles, and sections of AOS 1994 CTD data.
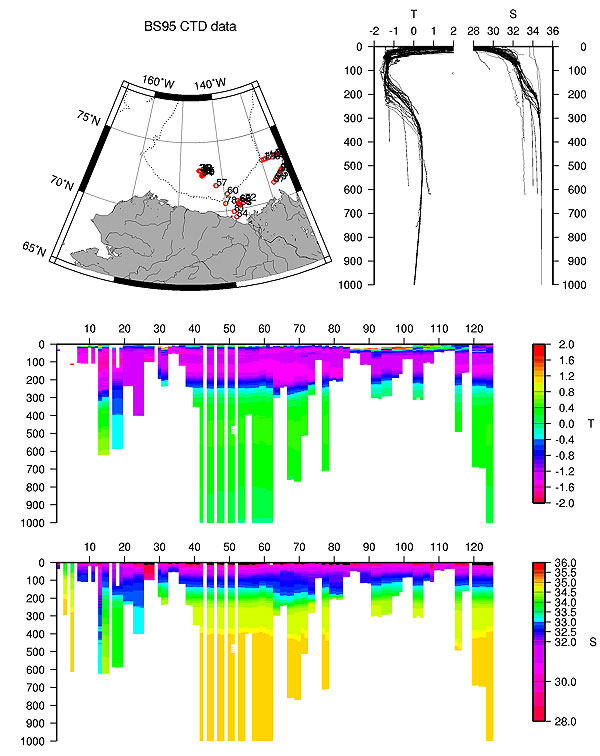
Figure 8. Locations, profiles, and sections of IOS 1995 CTD data.
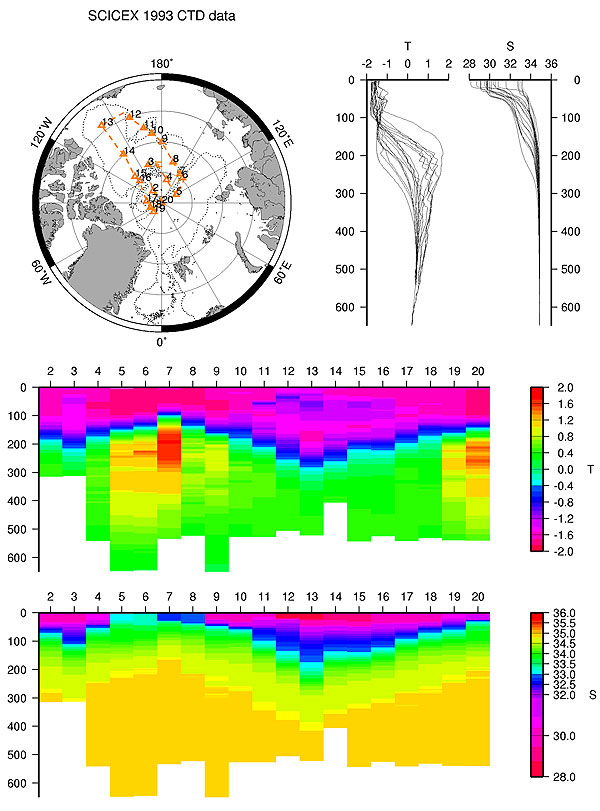
Figure 9. Locations, profiles, and sections of SCICEX 1993 CTD data.
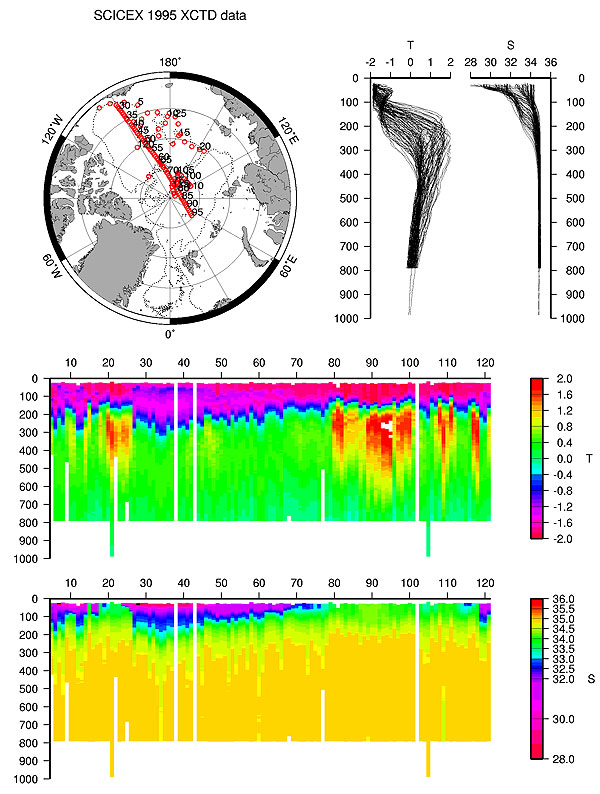
Figure10. Locations, profiles, and sections of SCICEX 1995 SSXCTD data.
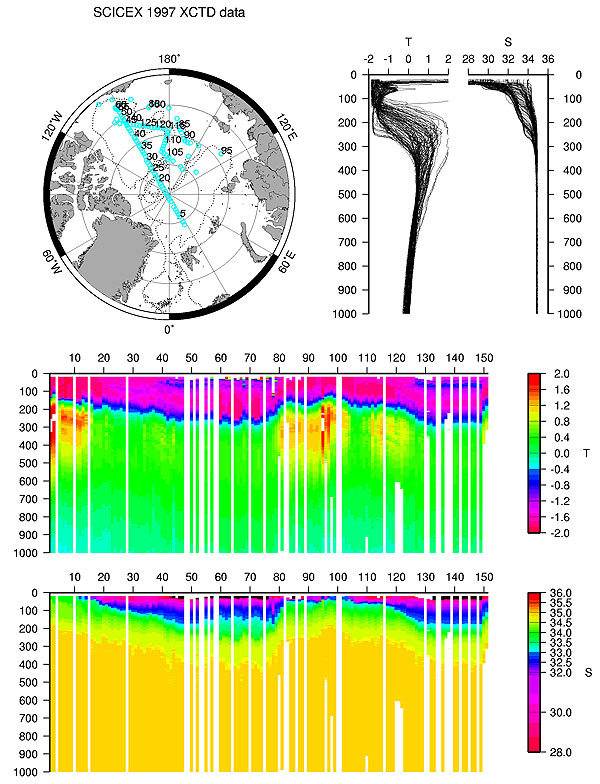
Figure 11. Locations, profiles, and sections of SCICEX 1997 SSXCTD data.
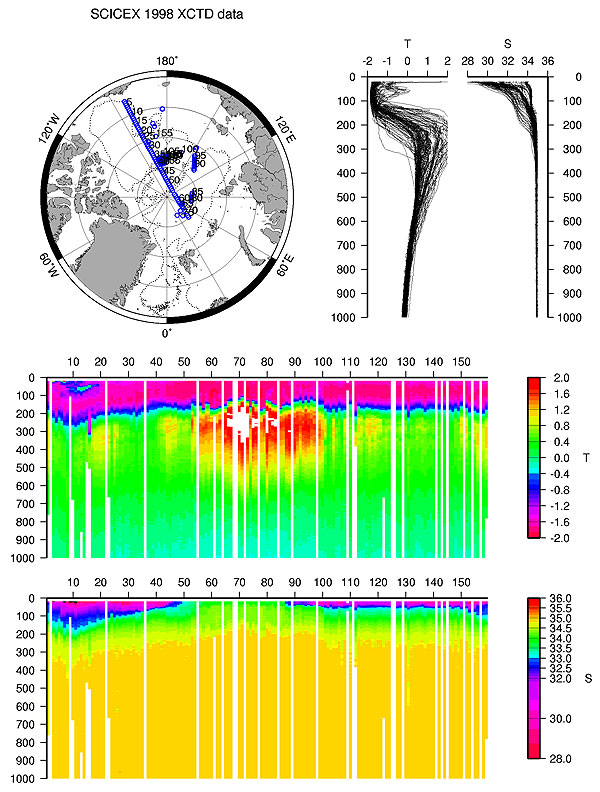
Figure 12. Locations, profiles, and sections of SCICEX 1998 SSXCTD data.
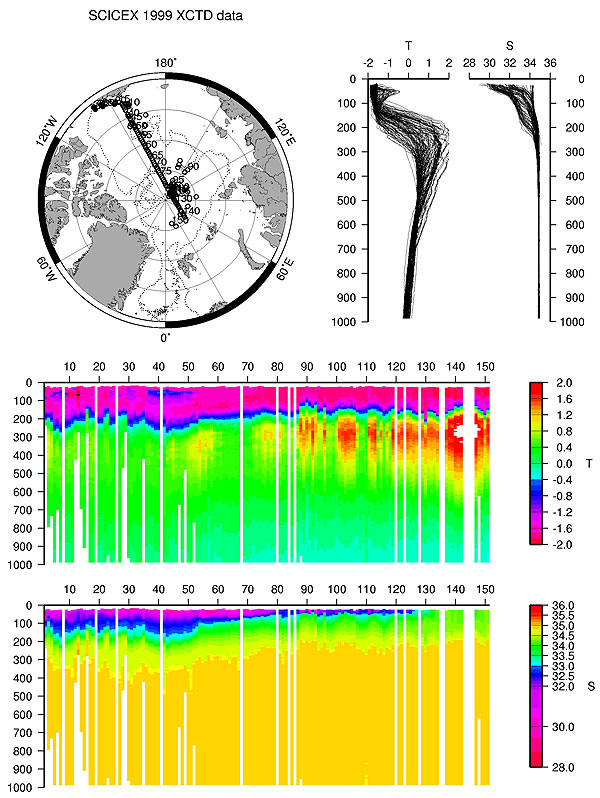
Figure 13. Locations, profiles, and sections of SCICEX 1999 SSXCTD data.
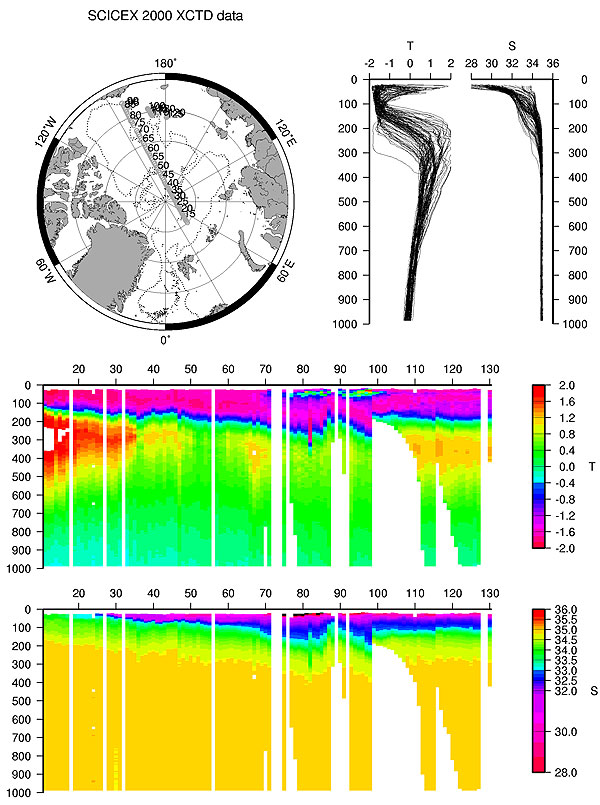
Figure 14. Locations, profiles, and sections of SCICEX 2000 SSXCTD data.
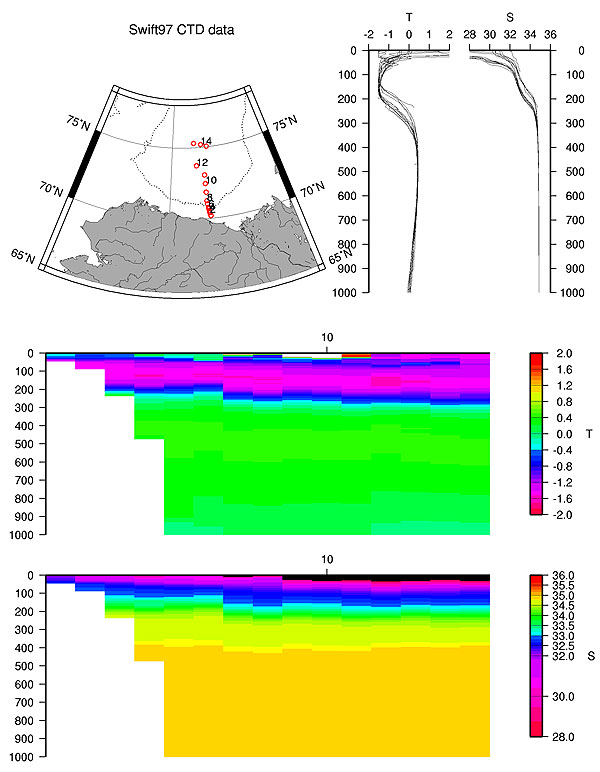
Figure 15. Locations, profiles, and sections of Swift 1997 CTD data.
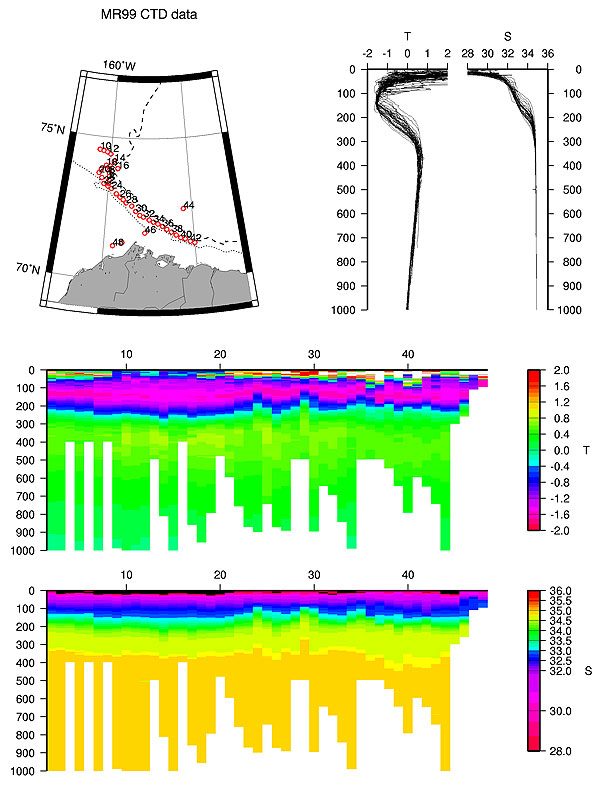
Figure 16. Locations, profiles, and sections of Mirai 1999 CTD data.
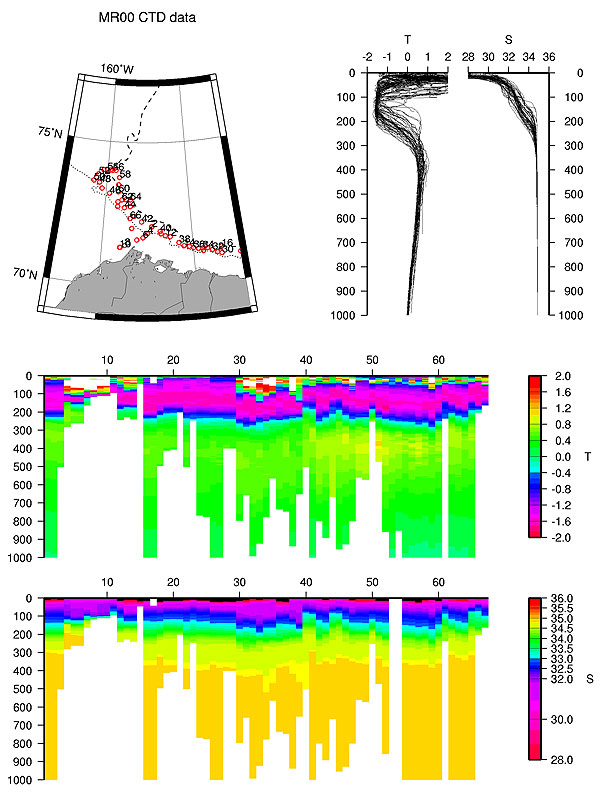
Figure 17. Locations, profiles, and sections of Mirai 2000 CTD data.
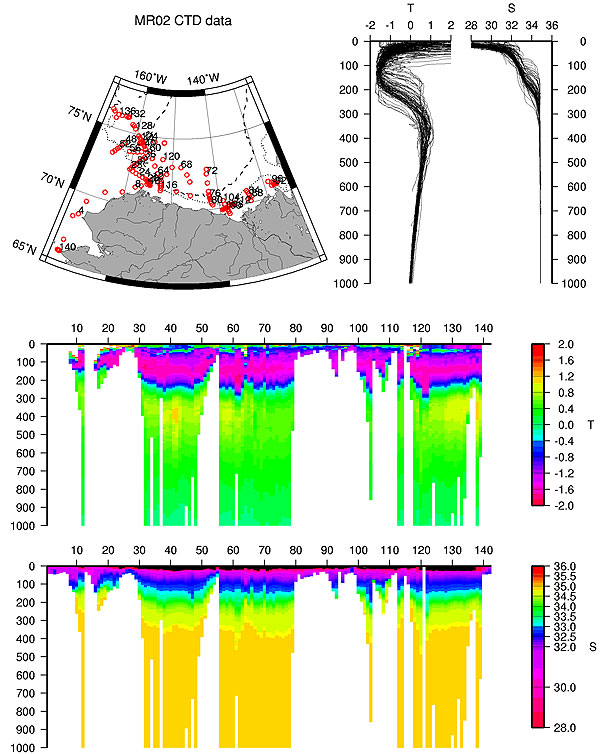
Figure 18. Locations, profiles, and sections of Mirai 2002 CTD data.
Figure 19. Locations, profiles, and sections of JWACS 2002 CTD data.
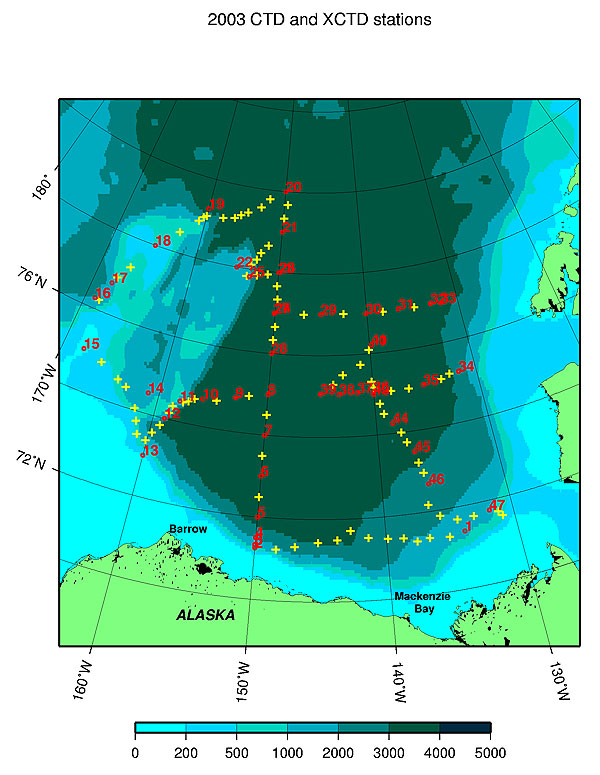
Figure 20. Locations of JWACS 2003 CTD data.
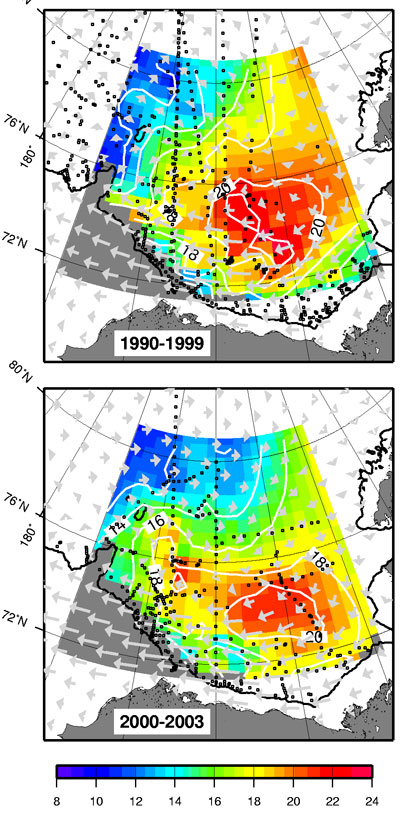
Figure 21. MStation locations and interpolated FWC contours (in m) from observed hydrographic profiles in the 1990s (top) and early 2000s (bottom).
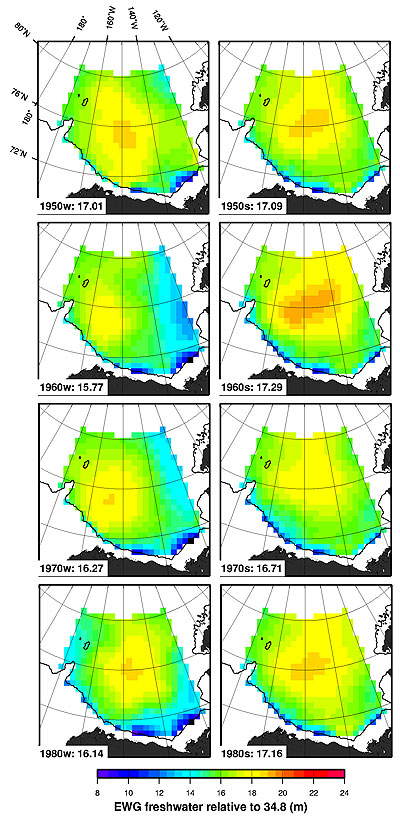
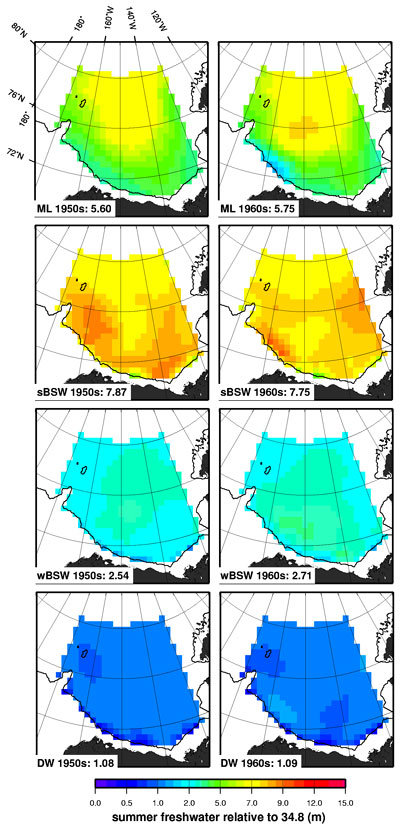
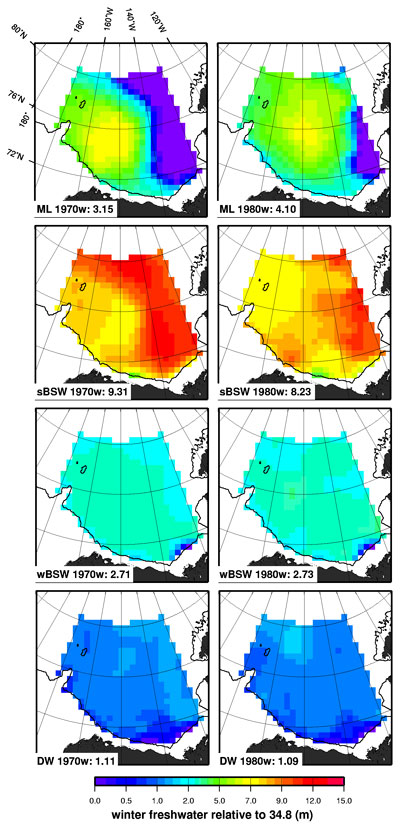
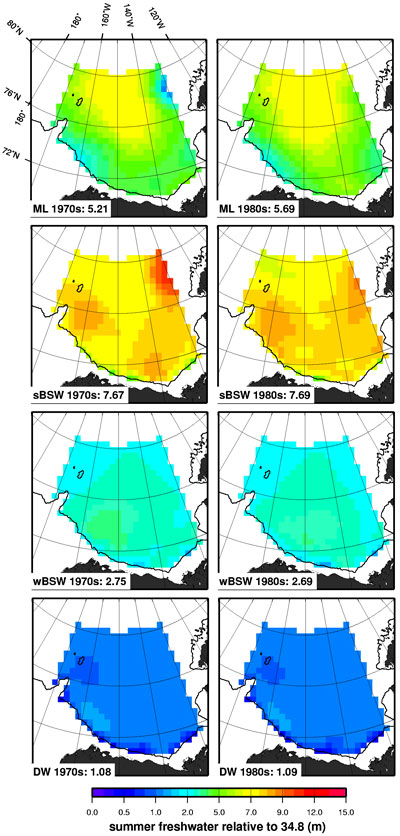
Figure 22. FWC from EWG decadal grids for winter (left) and summer (right) seasons.
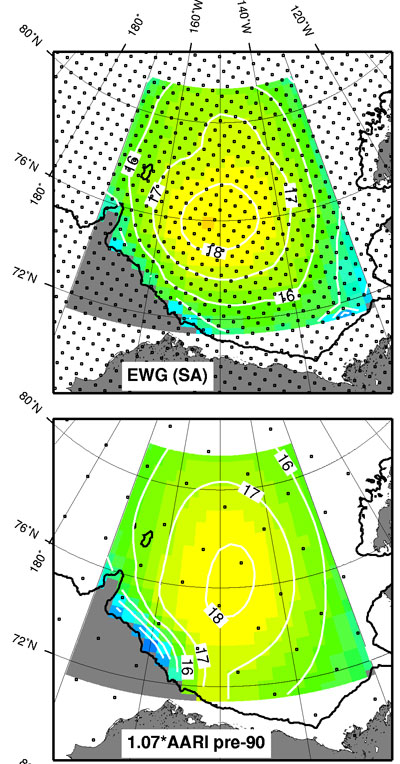
Figure 23. 40-year average FWC from EWG (top) and corrected AARI grids (bottom).
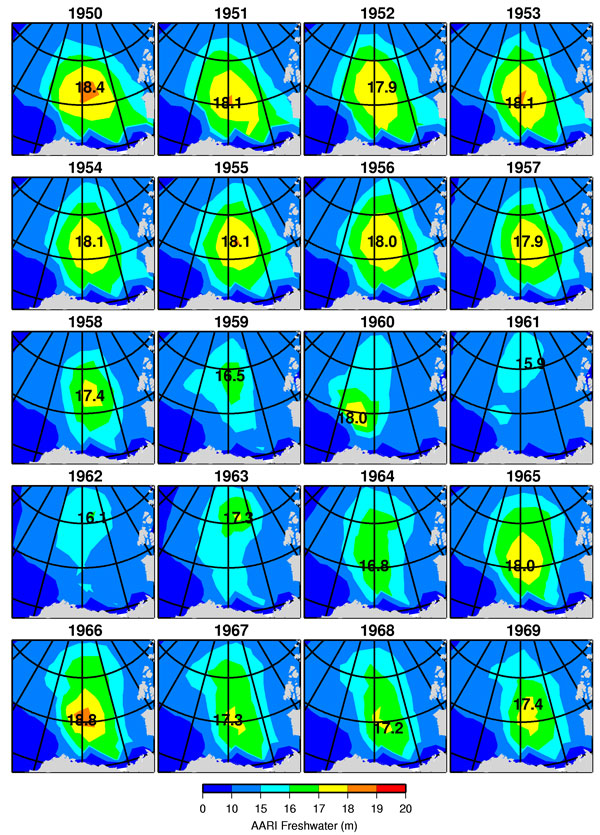
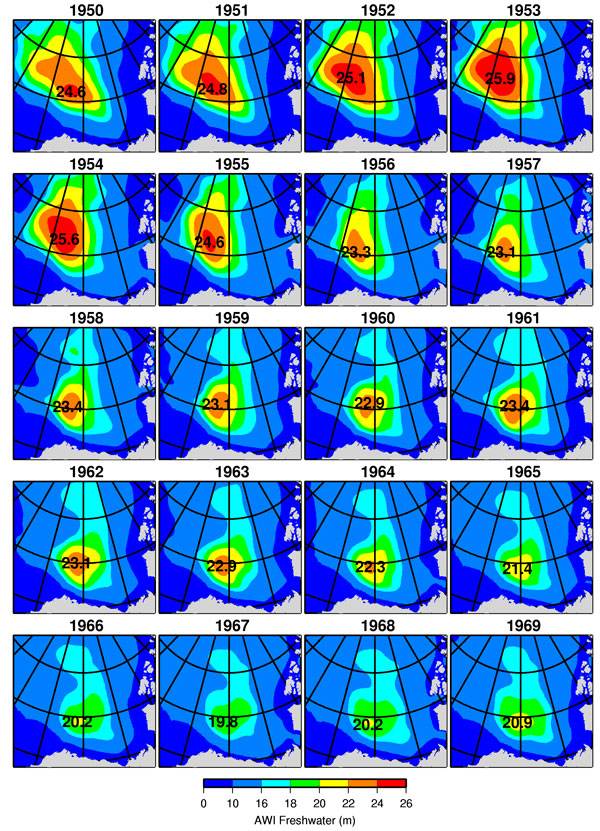
Figure 24. 1950-1969 annual FWC from AARI grids with maximum value of center indicated.
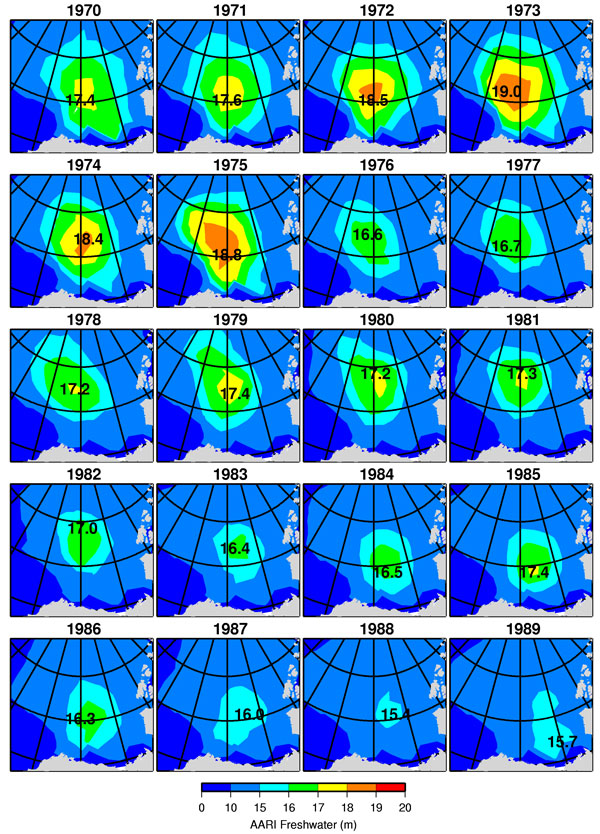
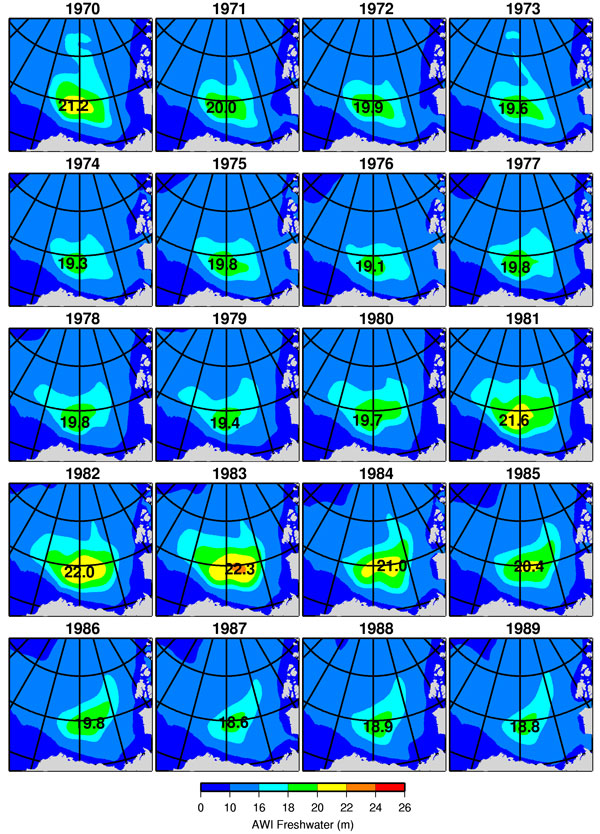
Figure 25. 1970-1989 annual FWC from AARI grids with maximum value of center indicated.
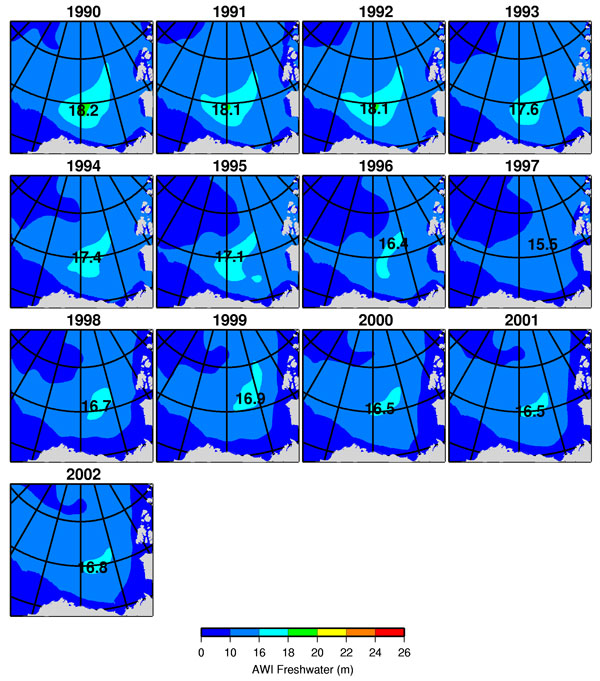
Figure 26. 1990-1993 annual FWC from AARI grids with maximum value of center indicated.
Figure 27. 1950-1969 annual FWC from AWI model with maximum value of center indicated.
Figure 28. 1970-1989 annual FWC from AWI model with maximum value of center indicated.
Figure 29. 1990-2002 annual FWC from AWI model with maximum value of center indicated.
Figure 30. Decadal parameters of the Beaufort Gyre system.
Figure 31. Decadal changes of parameters in the Beaufort Gyre system.
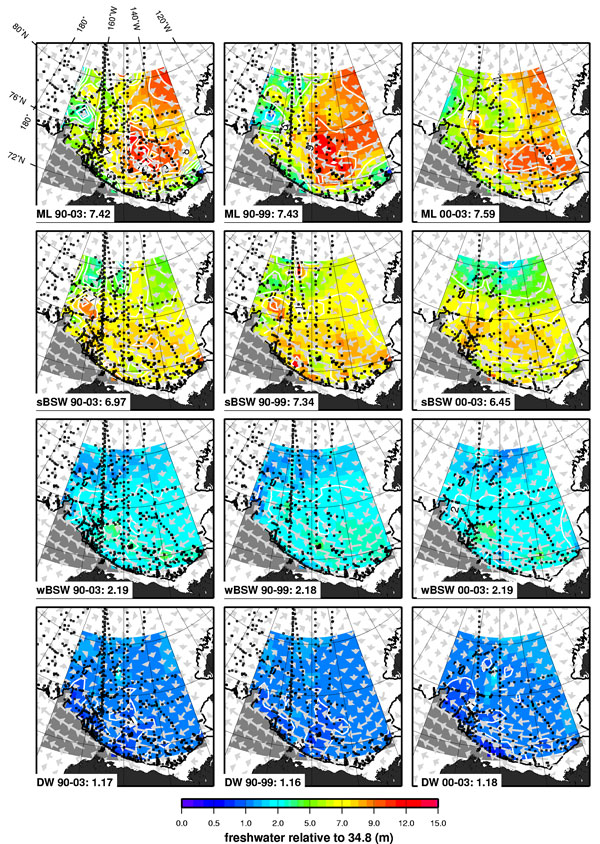
Figure 32. FWC described by salinity ranges from observations.
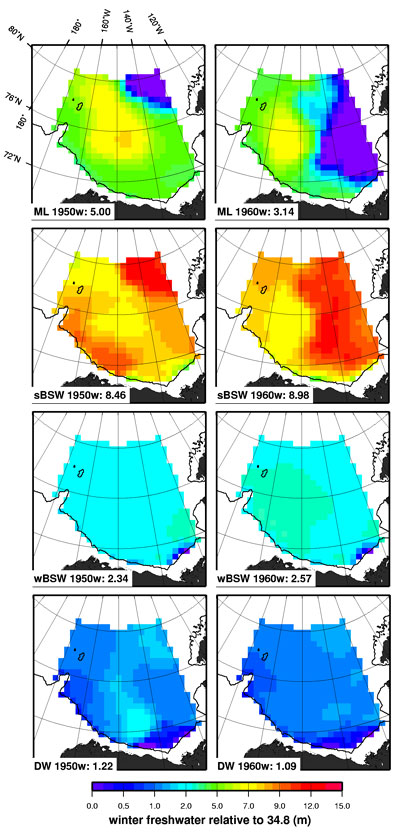
Figure 33. FWC by salinity ranges from winter 1950 and 1960 EWG.
Figure 34. FWC by salinity ranges from summer 1950 and 1960 EWG.
Figure 35. FWC by salinity ranges from winter 1970 and 1980 EWG.
Figure 36. FWC by salinity ranges from summer 1970 and 1980 EWG.
List of Tables
Table 1. Hydrographic profiles used to determine FWC in 1990s and 2000.
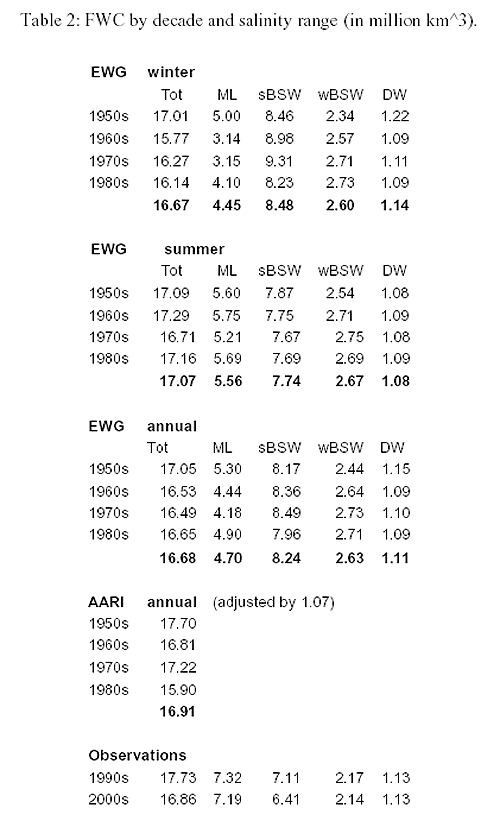
Table 2. FWC by decade and salinity range (in million km^3).
Introduction:
Data from hydrographic sections in the 1990s and 2000s are analyzed for freshwater content in the Beaufort Gyre region, and also used for steric height calculations. Historical freshwater and height for the decades from the 1950s to 1980s are determined from the EWG Atlas and interannually from the AARI database. Differences between decades indicate pronounced changes have occurred in the state of the Beaufort Gyre system (Proshutinsky et al., submitted to GRL). Results from upper ocean models are compared to the observational databases, but do not adequately describe the changes in freshwater content.
Methods:
a. Freshwater Content (FWC)
FWC is defined as the integrated salinity fraction above 34.8 and described in m:
FWC = sum [ dz * (s-34.8) / 34.8]
where dz is the vertical layer thickness, and s is the mean salinity for the layer.
When freshwater is calculated from CTD or XCTD profiles, the data are first averaged in 1 m bins vertically beginning at 1 m. If the first depth with data is below 1 m, then the mixed layer is filled with data from the first depth below 1 m. Consequently, surface values are never used in the freshwater calculations (because they are too unreliable, and influenced by local processes). This extrapolation procedure fixes the mixed layer at a constant determined below the surface. This is particularly significant in the case of SSXCTD (submarine XCTDs used during the SCICEX cruise) data, where the uppermost depth of the profile is usually between 20-30 m below the surface.
Below the mixed layer, the data are linearly interpolated, and FWC is summated from 1m to the first depth where salinity is greater than or equal to 34.8, or to the bottom of the profile. The depth where the salinity equals 34.8 is almost always between 100 and 500 m, and usually is located between 300 and 400 m. Consequently, most of the freshwater is located in the upper layers of the ocean: the mixed layer, and summer and winter Pacific water types.
In order to quantify the amount of freshwater in the upper layers of the ocean, FWC was calculated between different salinity ranges selected to correspond to different water types: mixed layer (ML) is defined where salinity is less than 31, summer Pacific (or Bering Sea) water (sBSW) is defined where salinity is between 31 and 33, winter Pacific water (wBSW) is defined where salinity is between 33 and 34, and deeper waters (DW) are defined where salinity is greater than 34 (to 34.8).
b. Steric height
Steric height is calculated from each profile, based on a reference depth of 300m. Geostrophic velocity of the upper ocean is calculated from the gradients of height.
c. Grid conversions
The FWC and steric height data are converted to a Lambert equal-area grid centered around 150 W longitude. To avoid aliasing, the data are averaged in 100 km square blocks, and least-squares surfaces are determined at 50 km spacing. The resulting grid points each occupy 2500 km of area. The Beaufort Gyre region is bounded on the south by 70.5 N, on the north by 80.5 N, on the west by 170 W, and the east by 130 W. The shelf regions (bathymetry < 300 m) are removed from the data, and not included in freshwater volume calculations. Altogether 409 grid points totalling 1.0225 M km^2 make up the Beaufort Gyre region in this report.
d. Errors
The measurement error in salinity, vertical profile spacing, and normal sampling errors affect the accuracy of the FWC estimates. Based on the sample variance, the 95% confidence limits of the true decadal means of FWC from the sample decadal averages is +/- 0.15 m for the 1990s and 2000s, and +/- 0.3 m for prior decades.
Observed profile data:
In order to determine FWC in the Beaufort Gyre in recent decades (1990 to 2003) CTD, XCTD, and SSXCTD profiles were obtained from many sources (Table 1). A large portion of the raw data from this region in the 1980s to the present were acquired by the Institute of Ocean Sciences (IOS, Canada), and the Melling, NOGAP and AOS data were available from the National Snow and Ice Data Center (NSIDC) in dataset ARCSS077 "Physical and Chemical Properties from Selected Expeditions in the Arctic Ocean." In addition, IOS data from 1990 through 1993, 1995, and 2002 to 2003 (JWACS) were obtained directly from IOS. SCICEX data were obtained from the NSIDC in datasets ARCSS064 "SCICEX Hydrographic Data, 1993" and ARCSS072 "SCICEX Hydrographic Data, 1997 and 1998" and at the website. The Swift 1997 CTD data were obtained from the "Atlas of Ocean Sections, version 2.0" CD-ROM, and Mirai 1999, 2000, and 2002 were obtained from the JAMSTEC website . Including a single cast during an IOEB buoy deployment was also obtained in the data-poor northeast Beaufort Gyre in 1997 by JAMSTEC and WHOI scientists, these sources of data provided 2785 raw hydrographic profiles. 770 stations remain after removing shallow stations (< 300 m), stations outside of the Beaufort Gyre region (70-80 N, 130 to 170 W), and stations where FWC or steric height to 300 m could not be confidently calculated.
From the WOD01 database from the National Oceanographic Data Center (NODC), 2845 CTD stations were identified in the Beaufort Gyre region, 1012 of these did not duplicate the data described above, of which 224 stations deeper than 300 m were used for FWC and steric height calculations. Altogether, 994 stations outlasted the processing: 501 in the 1990s, and 306 from 2000-2003 (Table 1). The data available in the 1980s were located solely around the periphery of the Beaufort Gyre, so were not used in the analysis.
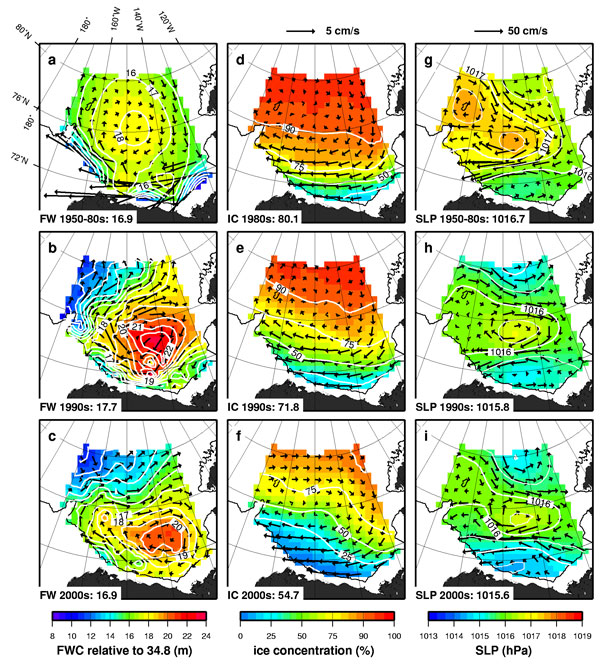
Based on the observations, the FWC maximum in the Beaufort Gyre in the 1990s and early 2000s exceeds 20-21 m and is centered around 74 N, 140 W. This is displaced from the traditional center of the Beaufort Gyre which is typically depicted as located around 78 N, 150 W from buoy and ice drift information. In order to quantify the changes, the observed FWC grids are compared to FWC grids constructed from Russian and western climatological data.
Historical climatological data:
a. EWG atlas
The US-Russian Environmental Working Group (EWG) Atlas is based upon all available data before the 1990s. On the EWG CD-ROM, decadal averages of temperature and salinity at standard depths are given using different averaging schemes. In the present study, the SA grids were selected for the calculations.
FWC is calculated from the standard depth data at the original locations given in the EWG, after removing the surface salinity, interpolating to 1 m, and filling the mixed layer. On average, the low vertical resolution is responsible for 0.1-0.2 m more error in each FWC computation than using the modern high resolution CTD and XCTD data.
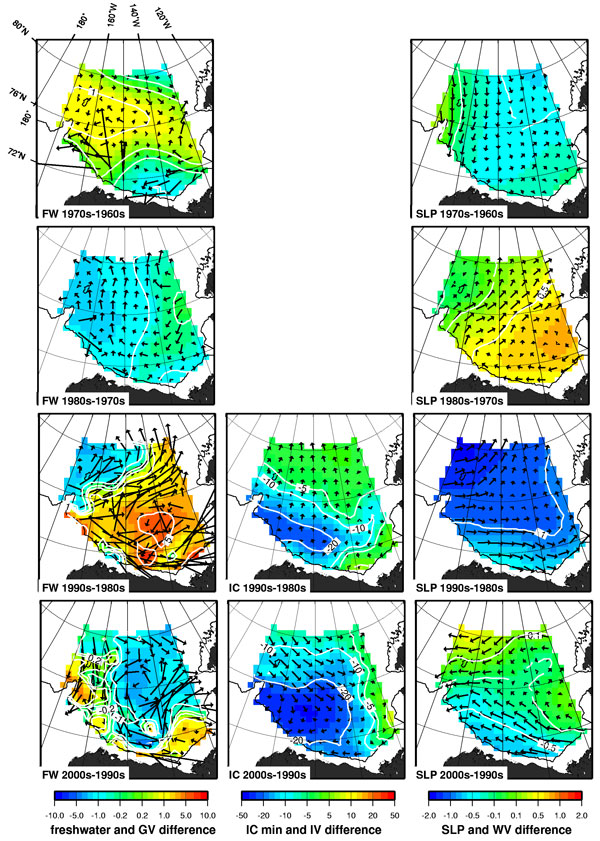
Winter and summer averages of FWC for each decade from the EWG are plotted in Figure 22. The historical data suggests that the volume of freshwater in the Beaufort Gyre region has varied between 16.1 and 17.3 million km^3 (+/- 0.3 million km^3), but does not indicate any clear trend. Furthermore, data from the 1980s was sparse compared to previous and later years, so it is unclear how representative the results are for that decade.
b. AARI database
The same hydrographic database that was used to produce the EWG is maintained at AARI, and was used to produce SA annual grids of FWC beginning in the 1950s. However, the uppermost 5 m of the water column was neglected in these calculations, and a comparison with FWC calculated using the EWG Atlas indicated that a correction of about 7% is required to the AARI annual FWC in order to be the same magnitude as the EWG FWC.
Model data:
a. AWI model
FWC determined from the results of the Alfred Wegener Institute (AWI) model (Karcher) are examined from 1950 to 2002. While decadal averages from observations indicated only a moderate change in total strength in recent decades, an overall decrease and southeastward shift of the Beaufort Gyre maximum occurs in the model.
b. NASA model (Hakkinen)

