Dispatch 24: The Turbulent and Chaotic World Under Sea Ice
Sam De Abreu
October 7, 2023
Dispatch 24: The Turbulent and Chaotic World Under Sea Ice
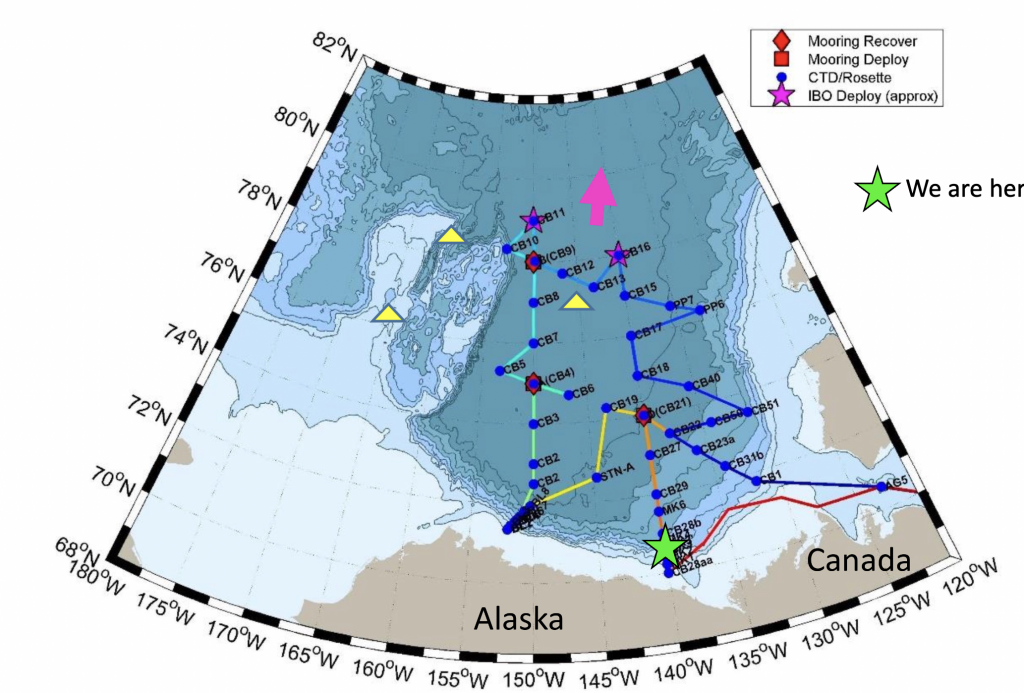
It has been a week since our last two ice stations where we deployed multiple different buoys on the sea ice. Each is equipped with numerous sensors to measure ocean properties deep in the Arctic Ocean with some able to measure directly under the sea ice. Observations directly under the sea ice are extremely important for understanding and quantifying the fluid dynamics in a region known as the Ice-Ocean Boundary Layer (IOBL). When sea ice is moving relative to the ocean, it drags the upper layer of the ocean along with it. The region of water that is moving with the sea ice is the IOBL. The IOBL is a host for many weird phenomena (with most due to us being on a rotating planet) like, for example, sea ice moving in a direction 45° to the right of wind.
The dynamics in the IOBL largely vary (like incredibly) because sea ice doesn’t have a smooth bottom. In fact, many floes (especially older ice) contain multiple ridges called keels consisting of various shapes (triangular, wedge, etc.) and sizes (some have been reported to reach depths beyond 30 meters!). These random structures act like obstacles that the water must traverse around or under, leading to chaotic turbulence and complex internal waves that can pull heat and nutrients from the deeper ocean.
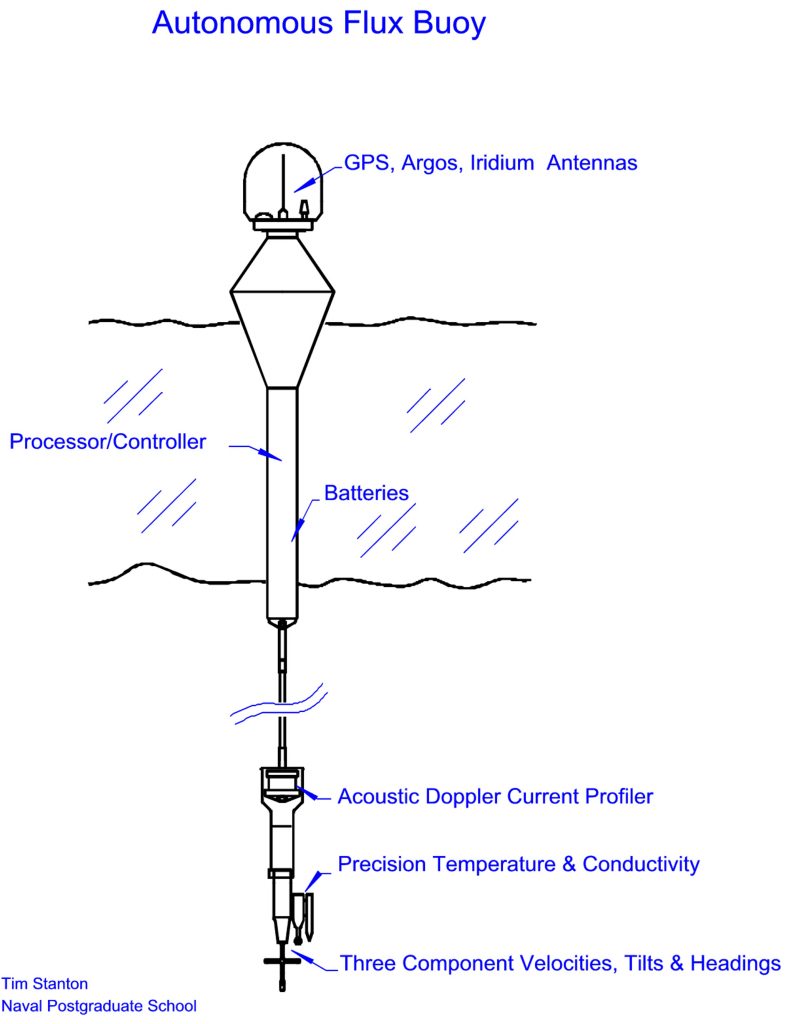
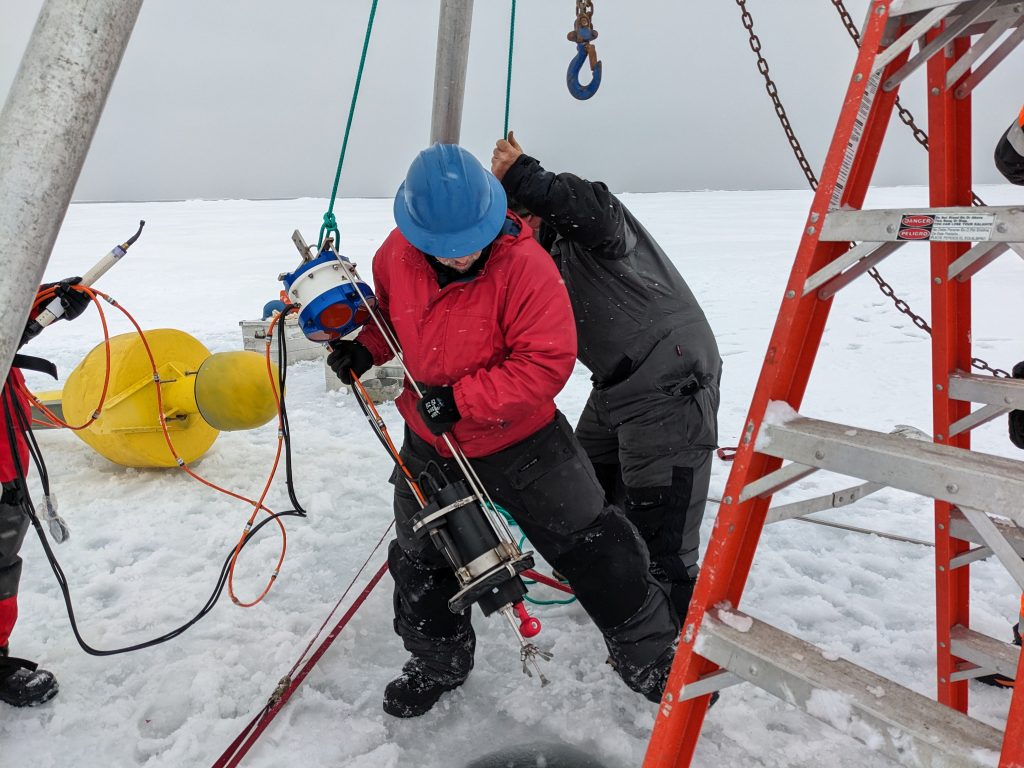
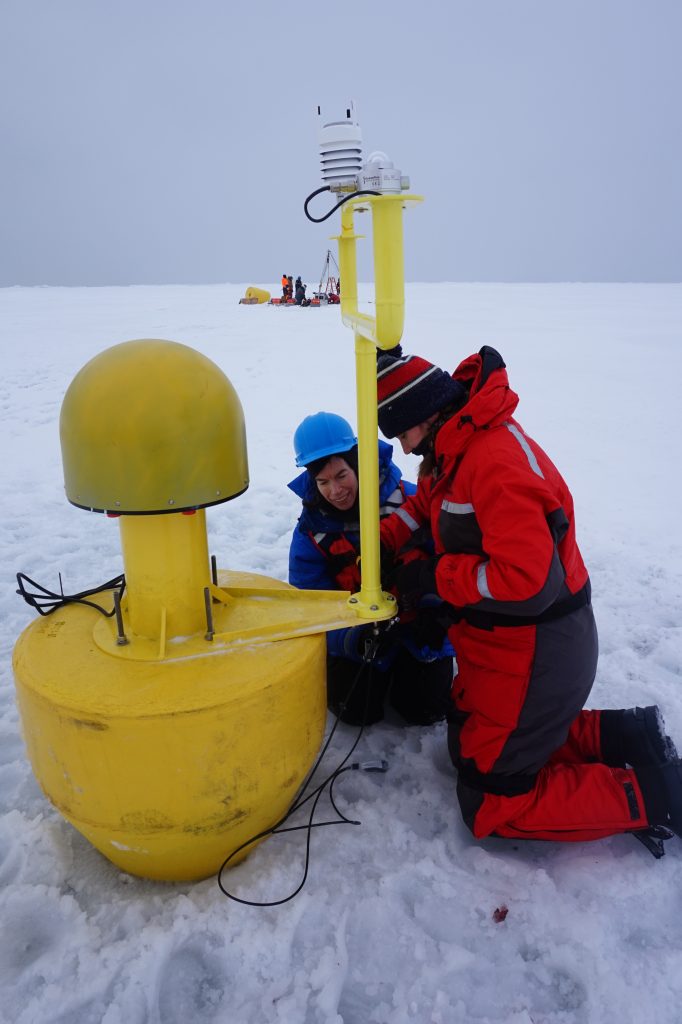
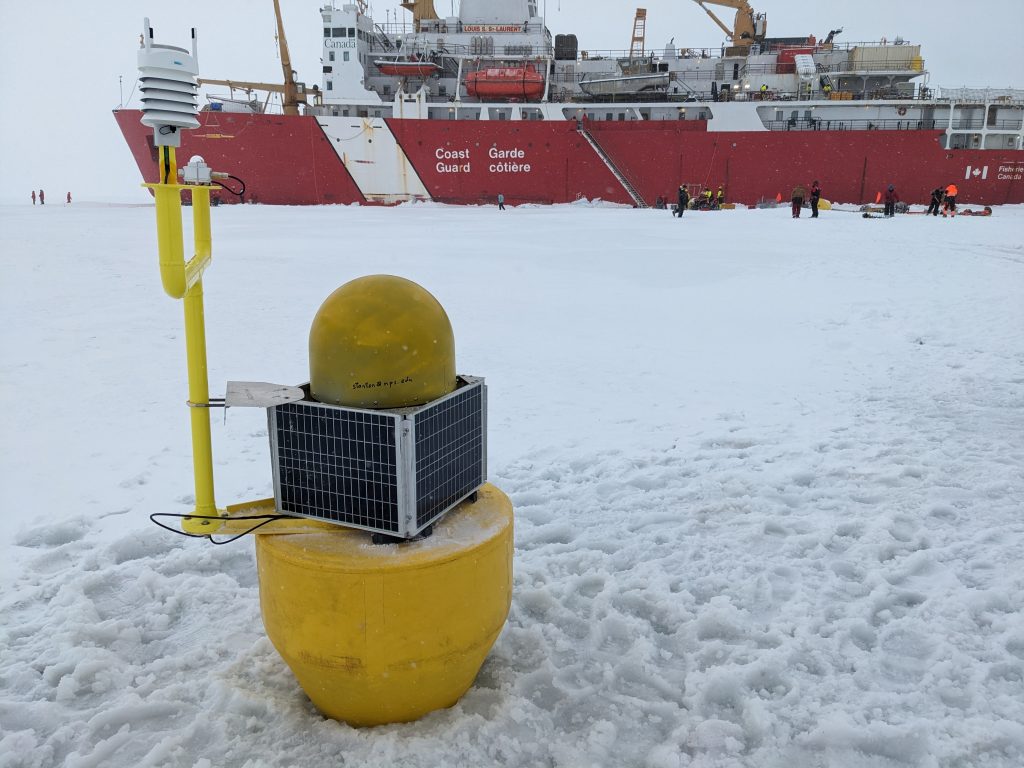
One source of IOBL measurements come from the Autonomous Ocean Flux Buoy (AOFB), one of the buoys we deployed at the ice stations, which was developed by Tim Stanton and colleagues at the Naval Postgraduate School. The device consists of a surface buoy (lies on top of the sea ice) and an instrument package (below the sea ice) that sits at a fixed depth of roughly 4.5 meters, taking measurements twice a second. These measurements are then transmitted via wire to the surface buoy where last-minute statistical calculations are made and then sent out by satellite twice a day. The data consist of temperature, salinity, pressure (for depth), and velocity. One example of the statistical calculations is the covariance of salinity and temperature with velocity, which allows one to determine the transport (flux) of these quantities in the IOBL. The AOFB is also equipped with a GPS, giving us the ability to track where the measurements are being made.
To predict the future of the Arctic Ocean and its sea ice, it is necessary to measure and understand the dynamics in the IOBL, making expeditions like these highly important for deploying instruments like the AOFB.
All AOFB data are available online, and the data from the buoy we deployed on this expedition can be accessed here: https://www.oc.nps.edu/~stanton/fluxbuoy/deploy/buoy55.html.
