Collaborative Research: U.S. Crossroads – Connectivity of the Deep Western Boundary Current through the Subpolar-Subtropical Transition Zone
A. Bower and H. Furey (WHOI), X. Xu and E. Chassignet (FSU)
Overview:
The subpolar-subtropical transition zone in the western North Atlantic has been identified as potentially key to Atlantic Meridional Overturning Circulation (AMOC) variability on decadal time scales. At this crossroads of the AMOC, the southbound Deep Western Boundary Current (DWBC) meets the northbound North Atlantic Current (NAC), and their interaction sets the properties of the deep waters exported to the rest of the Atlantic Ocean and beyond. Most attention has to date been focused on Labrador Sea Water (LSW) export and its impact on AMOC variability, revealing weak connectivity across the subpolar-subtropical boundary. Modeled particle trajectories suggest a greater connectivity for the deeper overflow waters (lower NADW) passing through the transition zone via the DWBC compared to LSW, but equivalent Lagrangian observations in overflow waters are lacking. Crossroads is an effort to build on previous observational and modeling work with new float observations of overflow water pathways and new particle simulations using state-of-the-art, high-resolution, multi-decade North Atlantic simulations. U.S. Crossroads is highly synergistic with two concurrent European-led programs with similar aims and complementary tools, namely “Explaining and Predicting the Overturning Circulation” (EPOC) and “French Crossroads.”
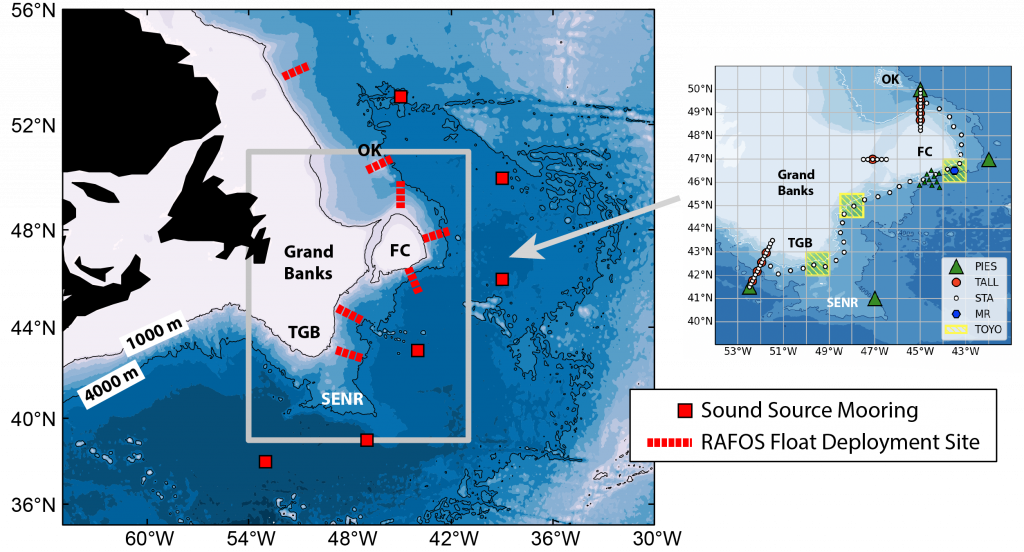
Figure: (left) Map of the US Crossroads RAFOS float deployment sites and sound source mooring locations. RAFOS deployment sites are schematic only—actual sites will be customized for each deployment site based on current structure from available in situ observations and local bathymetry. The French Crossroads/EPOC study area (shown at right) is outlined in gray. (left) Map of field work for French Crossroads and Grand Banks component of EPOC. Legend includes ‘PIES’ (both large and small green triangles): Pressure-equipped Inverted Echo Sounder; TALL: tall moorings; STA: lowered CTD station; MR: MicroRiyo (Moored VMP); TOYO: towed CTD site.
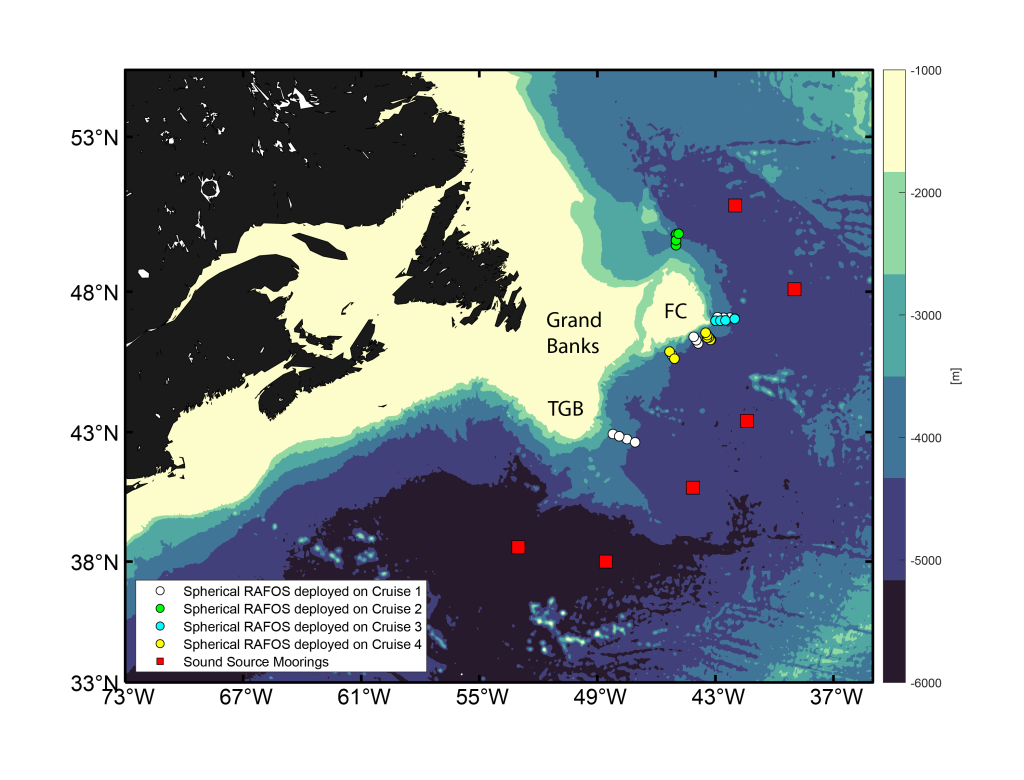
Figure: Map of the positions of the sound source moorings and the launch locations of the spherical RAFOS which were deployed in Summer 2025, Fall 2025, and Summer 2026.
Last updated July 10, 2026.
Reports:
Exley, A., 2026. Crossroads Cruise Report 6026 R/V Atlantic Explorer, July 24-August 8 2025.
Furey, H. 2026. Crossroads Cruise Report AR102-01 R/V Armstrong June 7-July 16, 2026.
Publications:
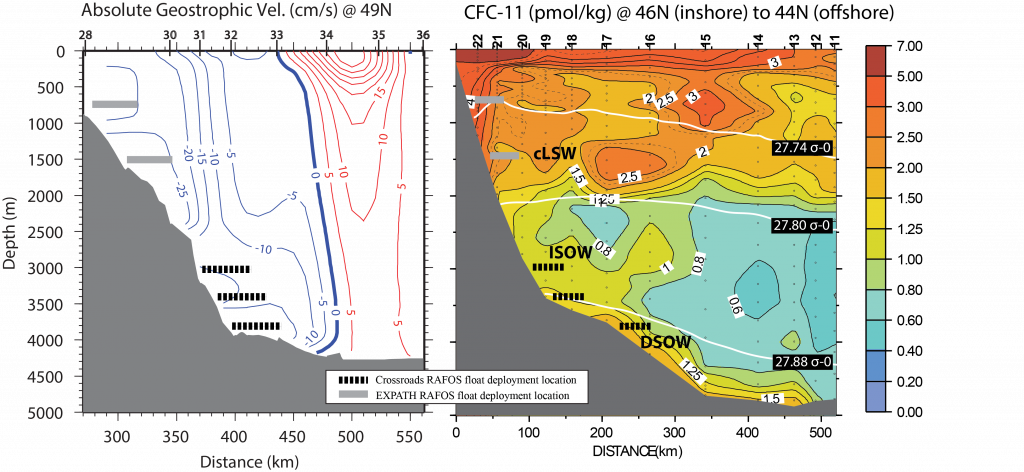
Figure: (left) Absolute geostrophic velocity across the slope at the eastern side of the Flemish Cap, blue lines indicate southward velocity, red, northward (~49°N; data courtesy of R. Pickart, WHOI). Note how the NAC extends all the way to the sea floor. (right) Vertical section of CFC-11 (from Smethie et al., 2000). Isopycnals estimated bounding the CLSW, ISOW, and DSOW layers are drawn in white, and water masses are labelled. US Crossroads float deployment locations are indicated by hatched black and white bars; gray bars indicate depths of previous float deployments at LSW levels in 2003-2006 (trajectories shown in Fig. 3).
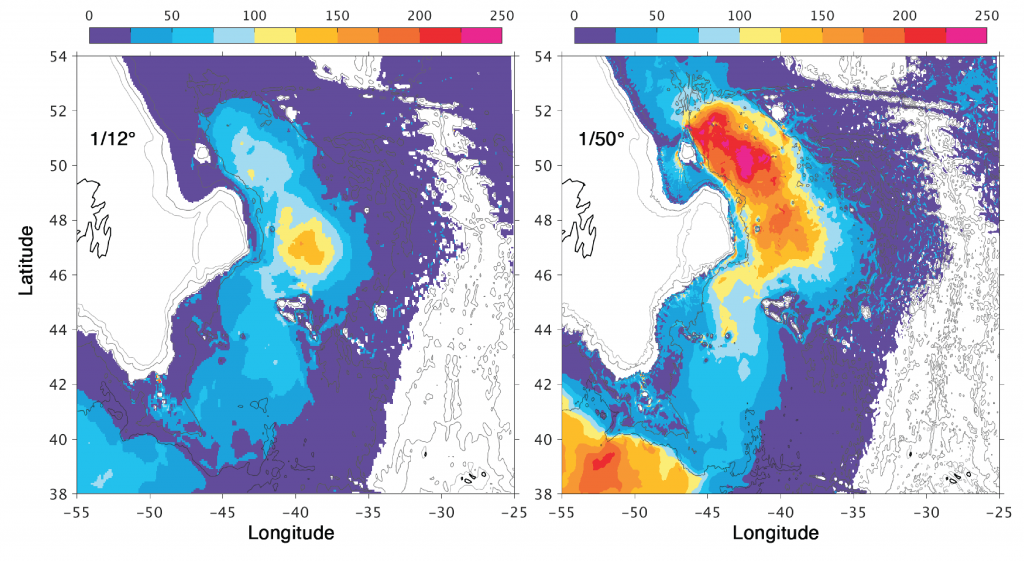
Figure: The 5-year mean EKE (in cm2/s2) of the modeled DSOW layer (3500-4000 m) in two HYCOM simulations, 1/12° (right) and 1/50° (left). The gray contours are model bathymetry from 1000 to 5000m at 1000m intervals.
FUNDING
This project is generously funded by the National Science Foundation Grant OCE-2318947.