Data
Data sets for specific projects may be found here. Please contact Heather Furey with any data accessibility issues.
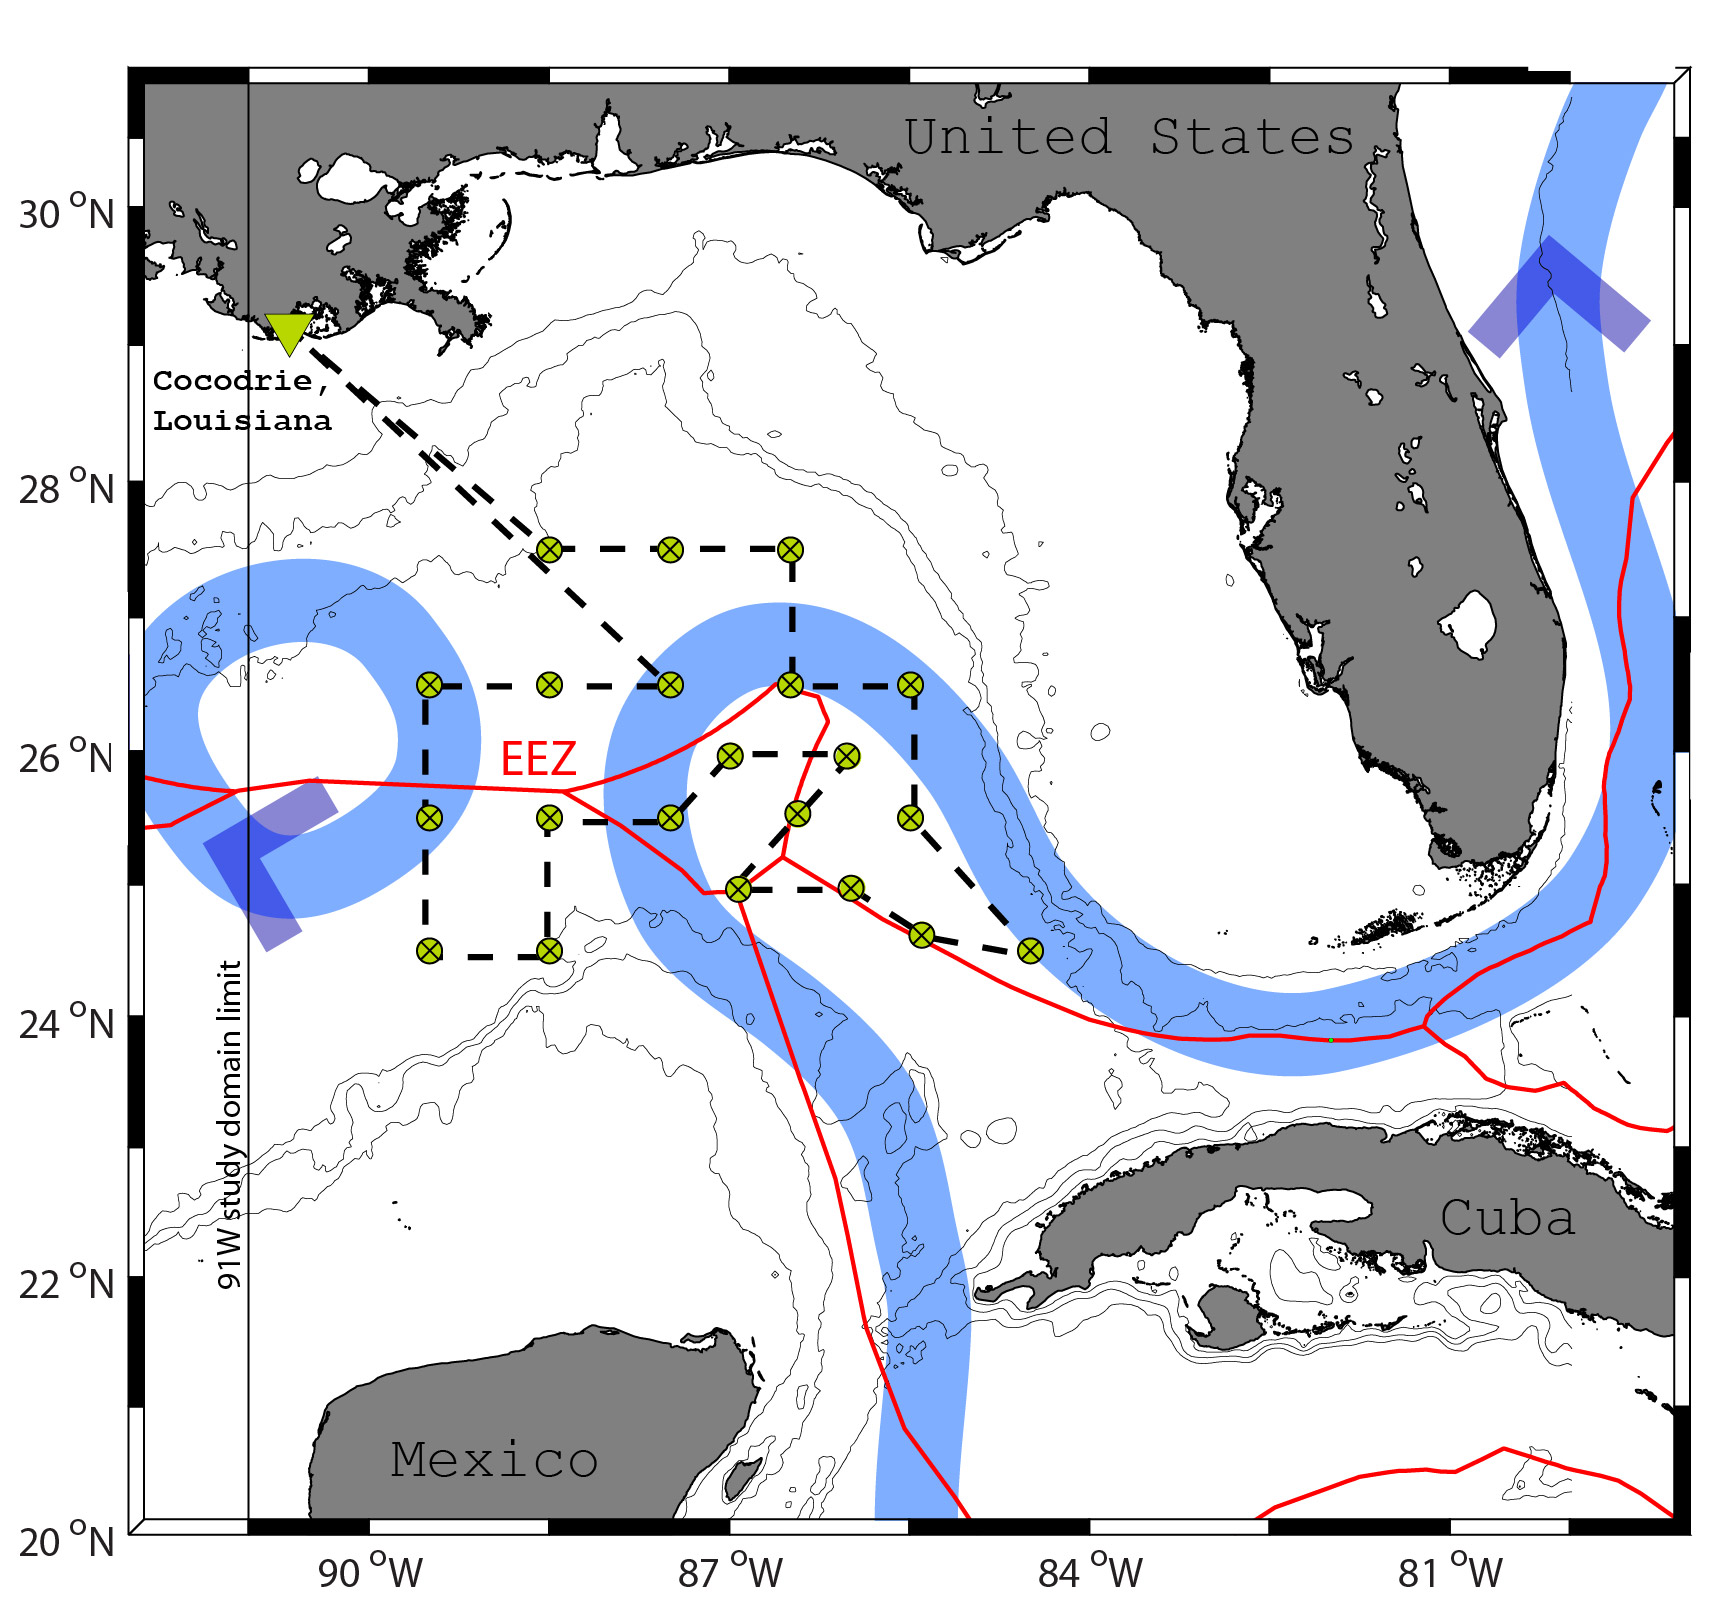
UGOS: GODEEP and LC-Floats
Argo position and profile data are available in the global DACs GODAE and Coriolis. A list of platforms and associated data links may be found here.
WHOI-Argo Group webpages of the floats deployed to date:
7491 7492 7540 7541 7542 7544 7545 7568 / 7495 7499 7513 7518 7556 7557 7559 7560 7561 7577 7584 7586 / 7519 7543 7538 7549 / 7618 7622 7623 7624 / 7690 7700 7701 7703-(dud) 7726 7729 7742 7755 / 7771 7772 7776 7779 7796 7801 7802 7877 7861 7873 7878 7879 7880 7882 7883 7884
GRIIDC Gulf Science Data Repository:
Bower, Amy S., Furey, Heather H., & Jayne, Steven R., UGOS S2A (SOLO) Profiling Float Data, doi: 10.7266/d4ehecf
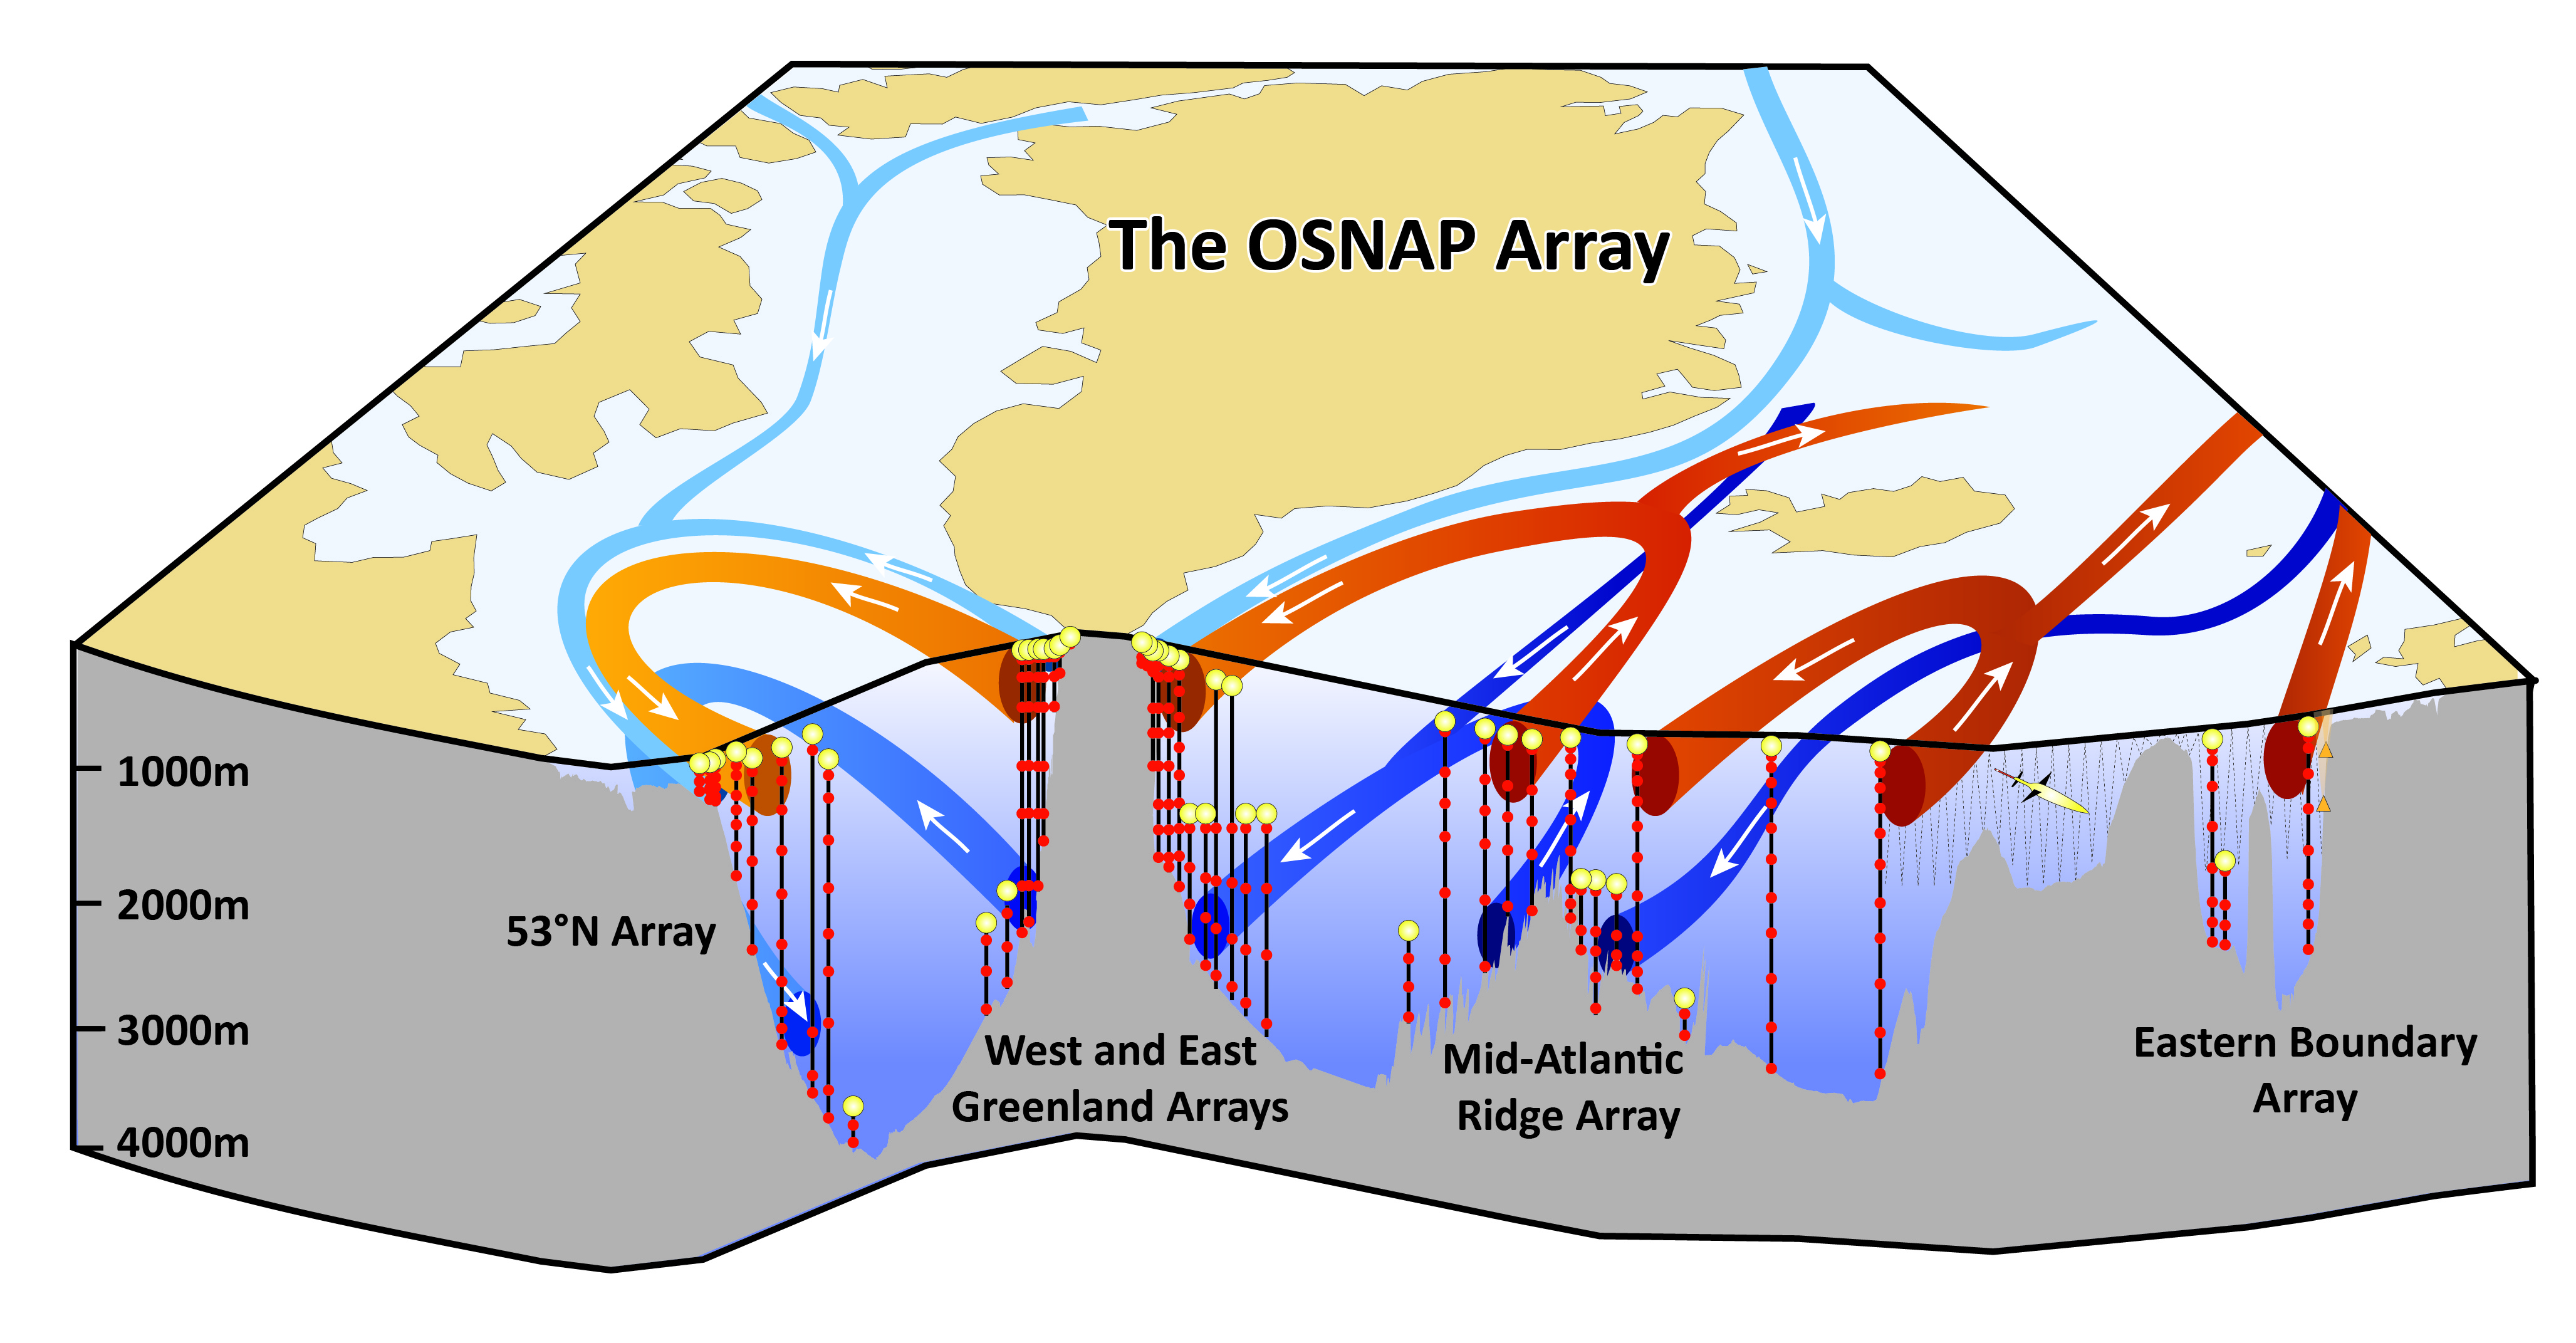
OSNAP GDWBC mooring data
A complete set (from 2014 onward) Greenland Deep Western Boundary Current Mooring data are available at OSNAP Data.
2018-2020 Dataset: Bower, A., Straneo, F. Furey, H., Biló, T., Bahr, F. "Overturning in the Subpolar North Atlantic Program (OSNAP) moored current meter, temperature, conductivity, salinity and pressure data collected on subsurface moorings M1, M2, M3 and M4 between June 2018 and August 2020." 2023-06. DOI:10.26025/1912/66314
2020-2022 Dataset: Houk, A., Bower, A. "Greenland Deep Western Boundary Current (GDWBC) Mooring Data 2020-2022." 2024-05. DOI: 10.26025/1912/69370
Bight Fracture Zone
Dataset: Furey, H., Ramsey, A. L., & Bower, A. (2024). Bight Fracture Zone Experiment Moored Instrument Data [Data set]. Woods Hole Oceanographic Institution. doi.org/10.26025/1912/69268
Report: Furey, H., Ramsey, A., & Bower, A. (2024). Bight Fracture Zone Experiment: Moored Instrument Data Report, July 2015 - July 2017. Woods Hole Oceanographic Institution. doi.org/10.1575/1912/69315
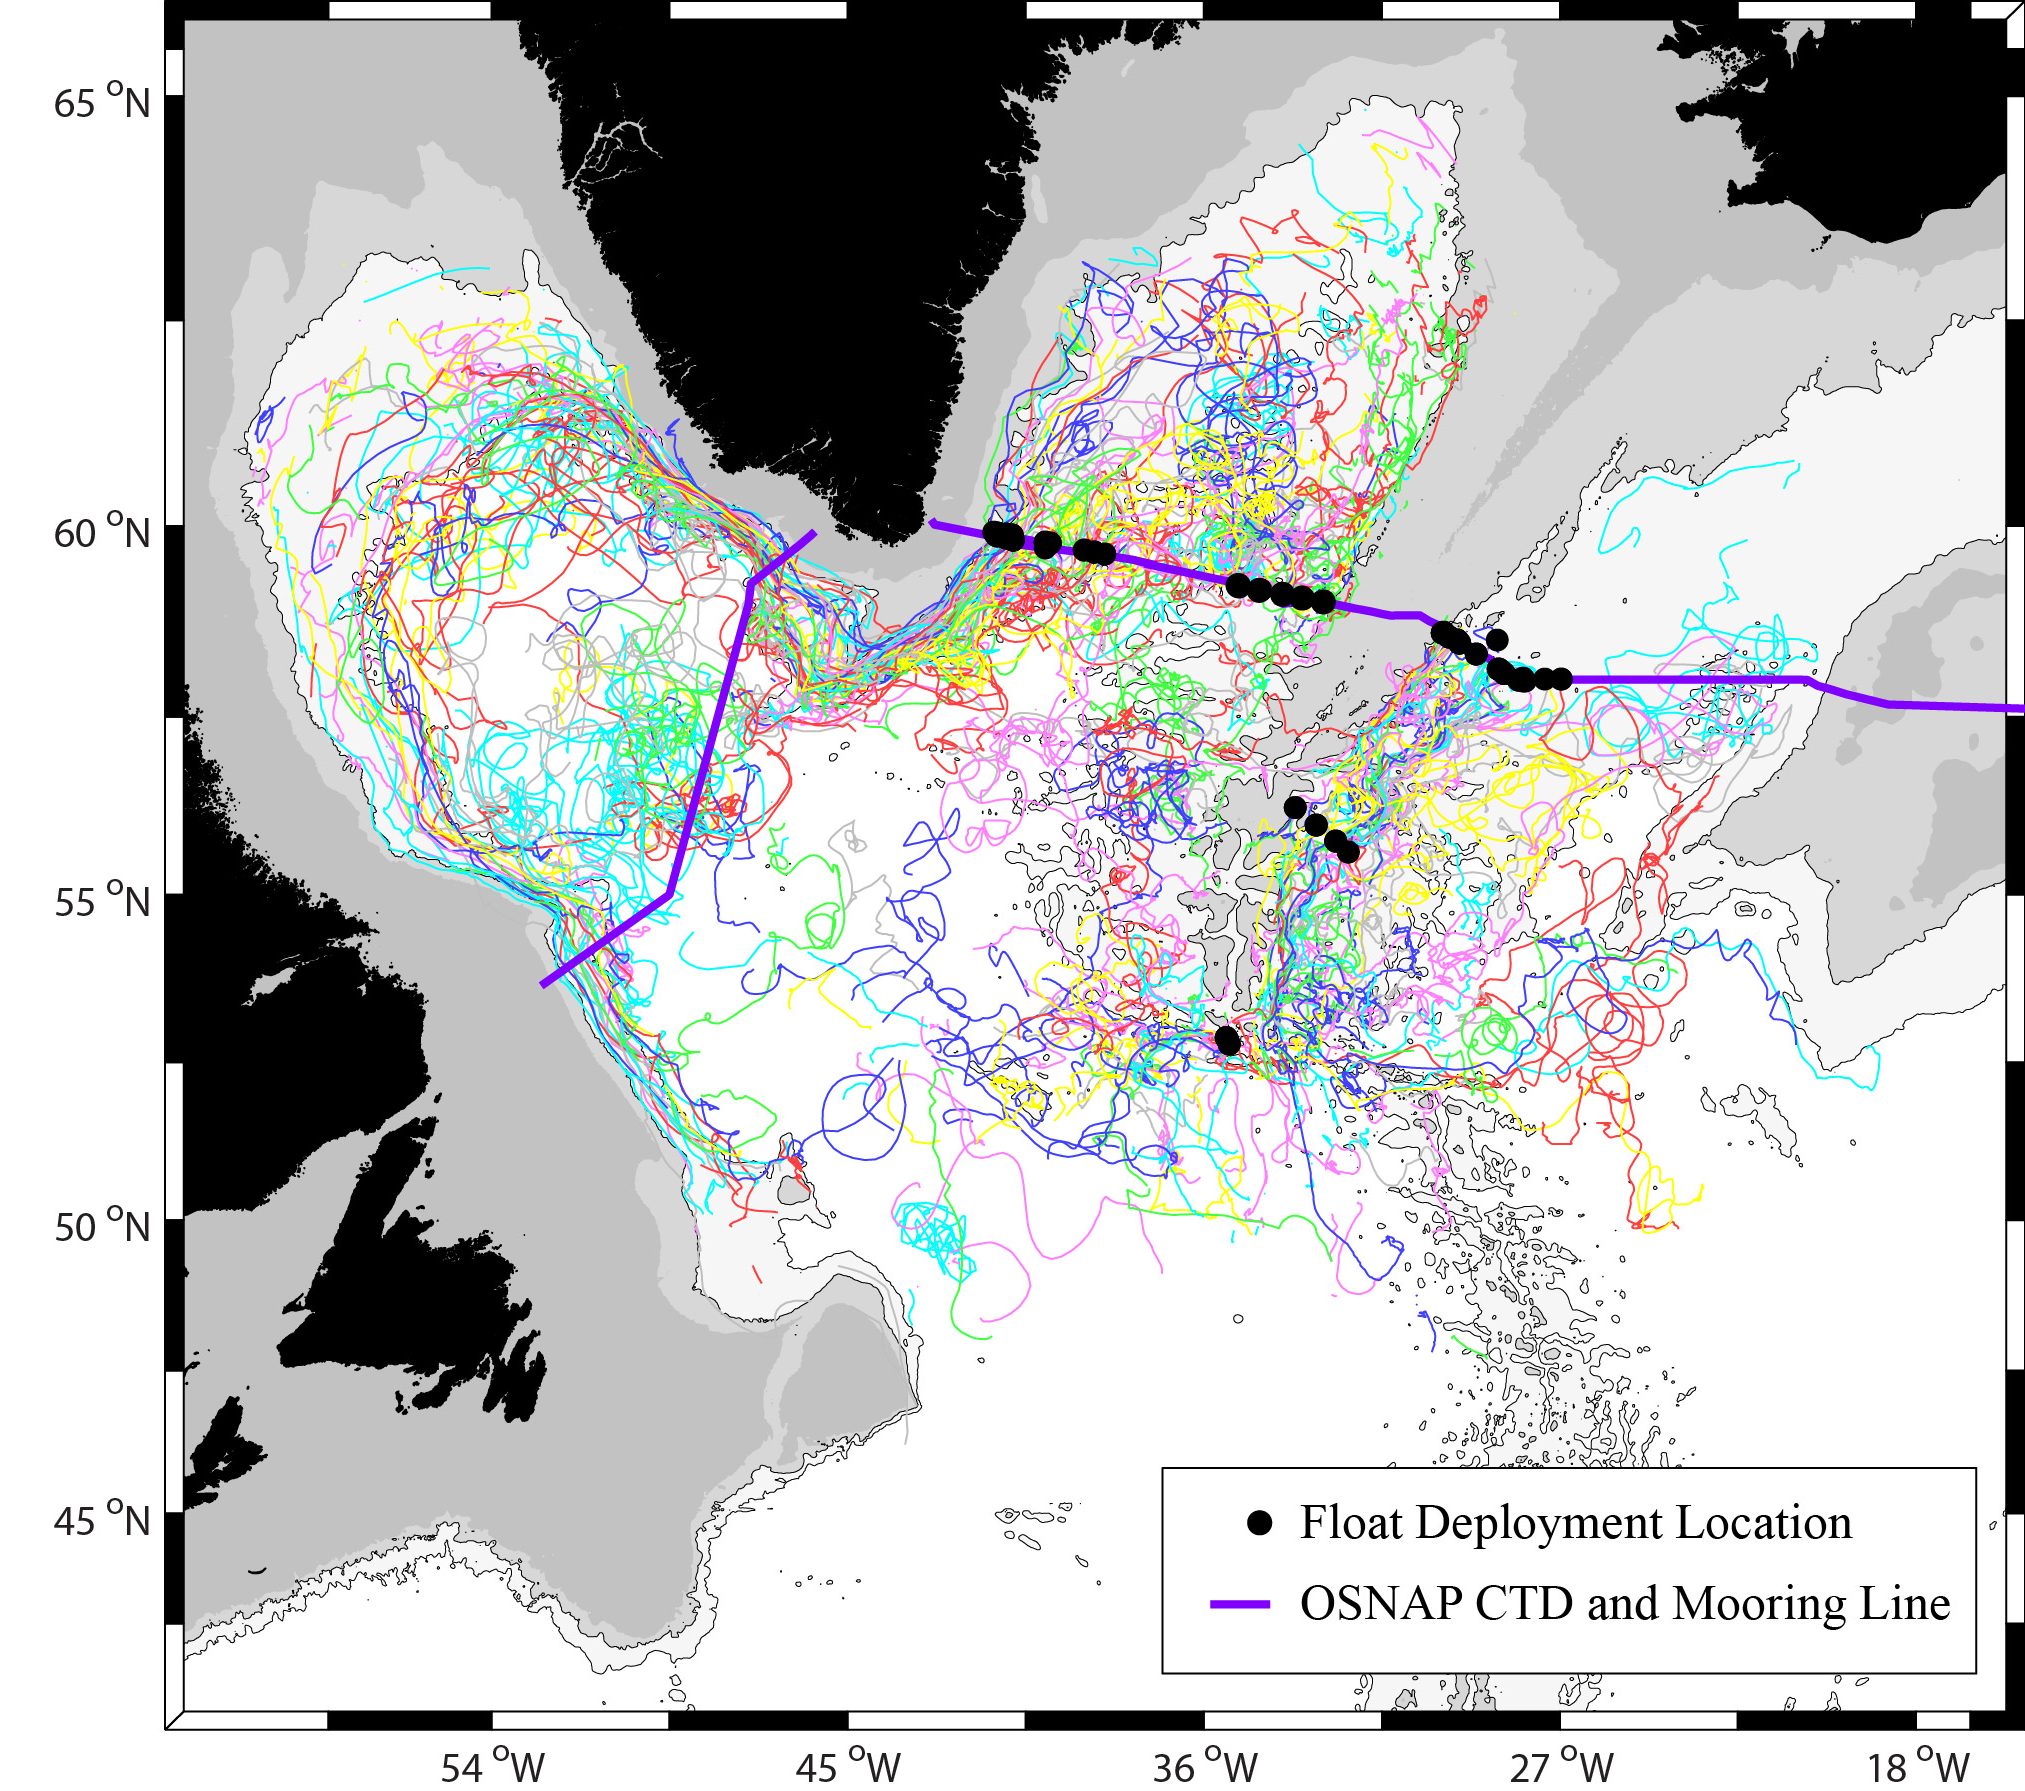
OSNAP RAFOS float data
Dataset: Furey, Heather H., Ramsey, Andrée L., "Overturning in the Subpolar North Atlantic Program (OSNAP) RAFOS Float Data collected between June 2014 to January 2019", 2019-08, DOI:10.26025/1912/24388.
Ramsey, A., H. Furey, and A. Bower, 2020. Overturning of the Subpolar North Atlantic Program (OSNAP): RAFOS Float Data Report, June 2014 - January 2019.Woods Hole Oceanographic Institution Technical Report, WHOI-2020-06; doi:10.1575/1912/26515.
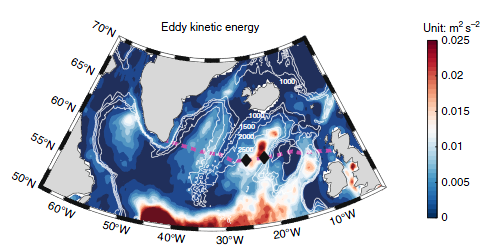
OSNAP WHOI-OUC glider data
The WHOI-OUC glider data are available at OSNAP Data.
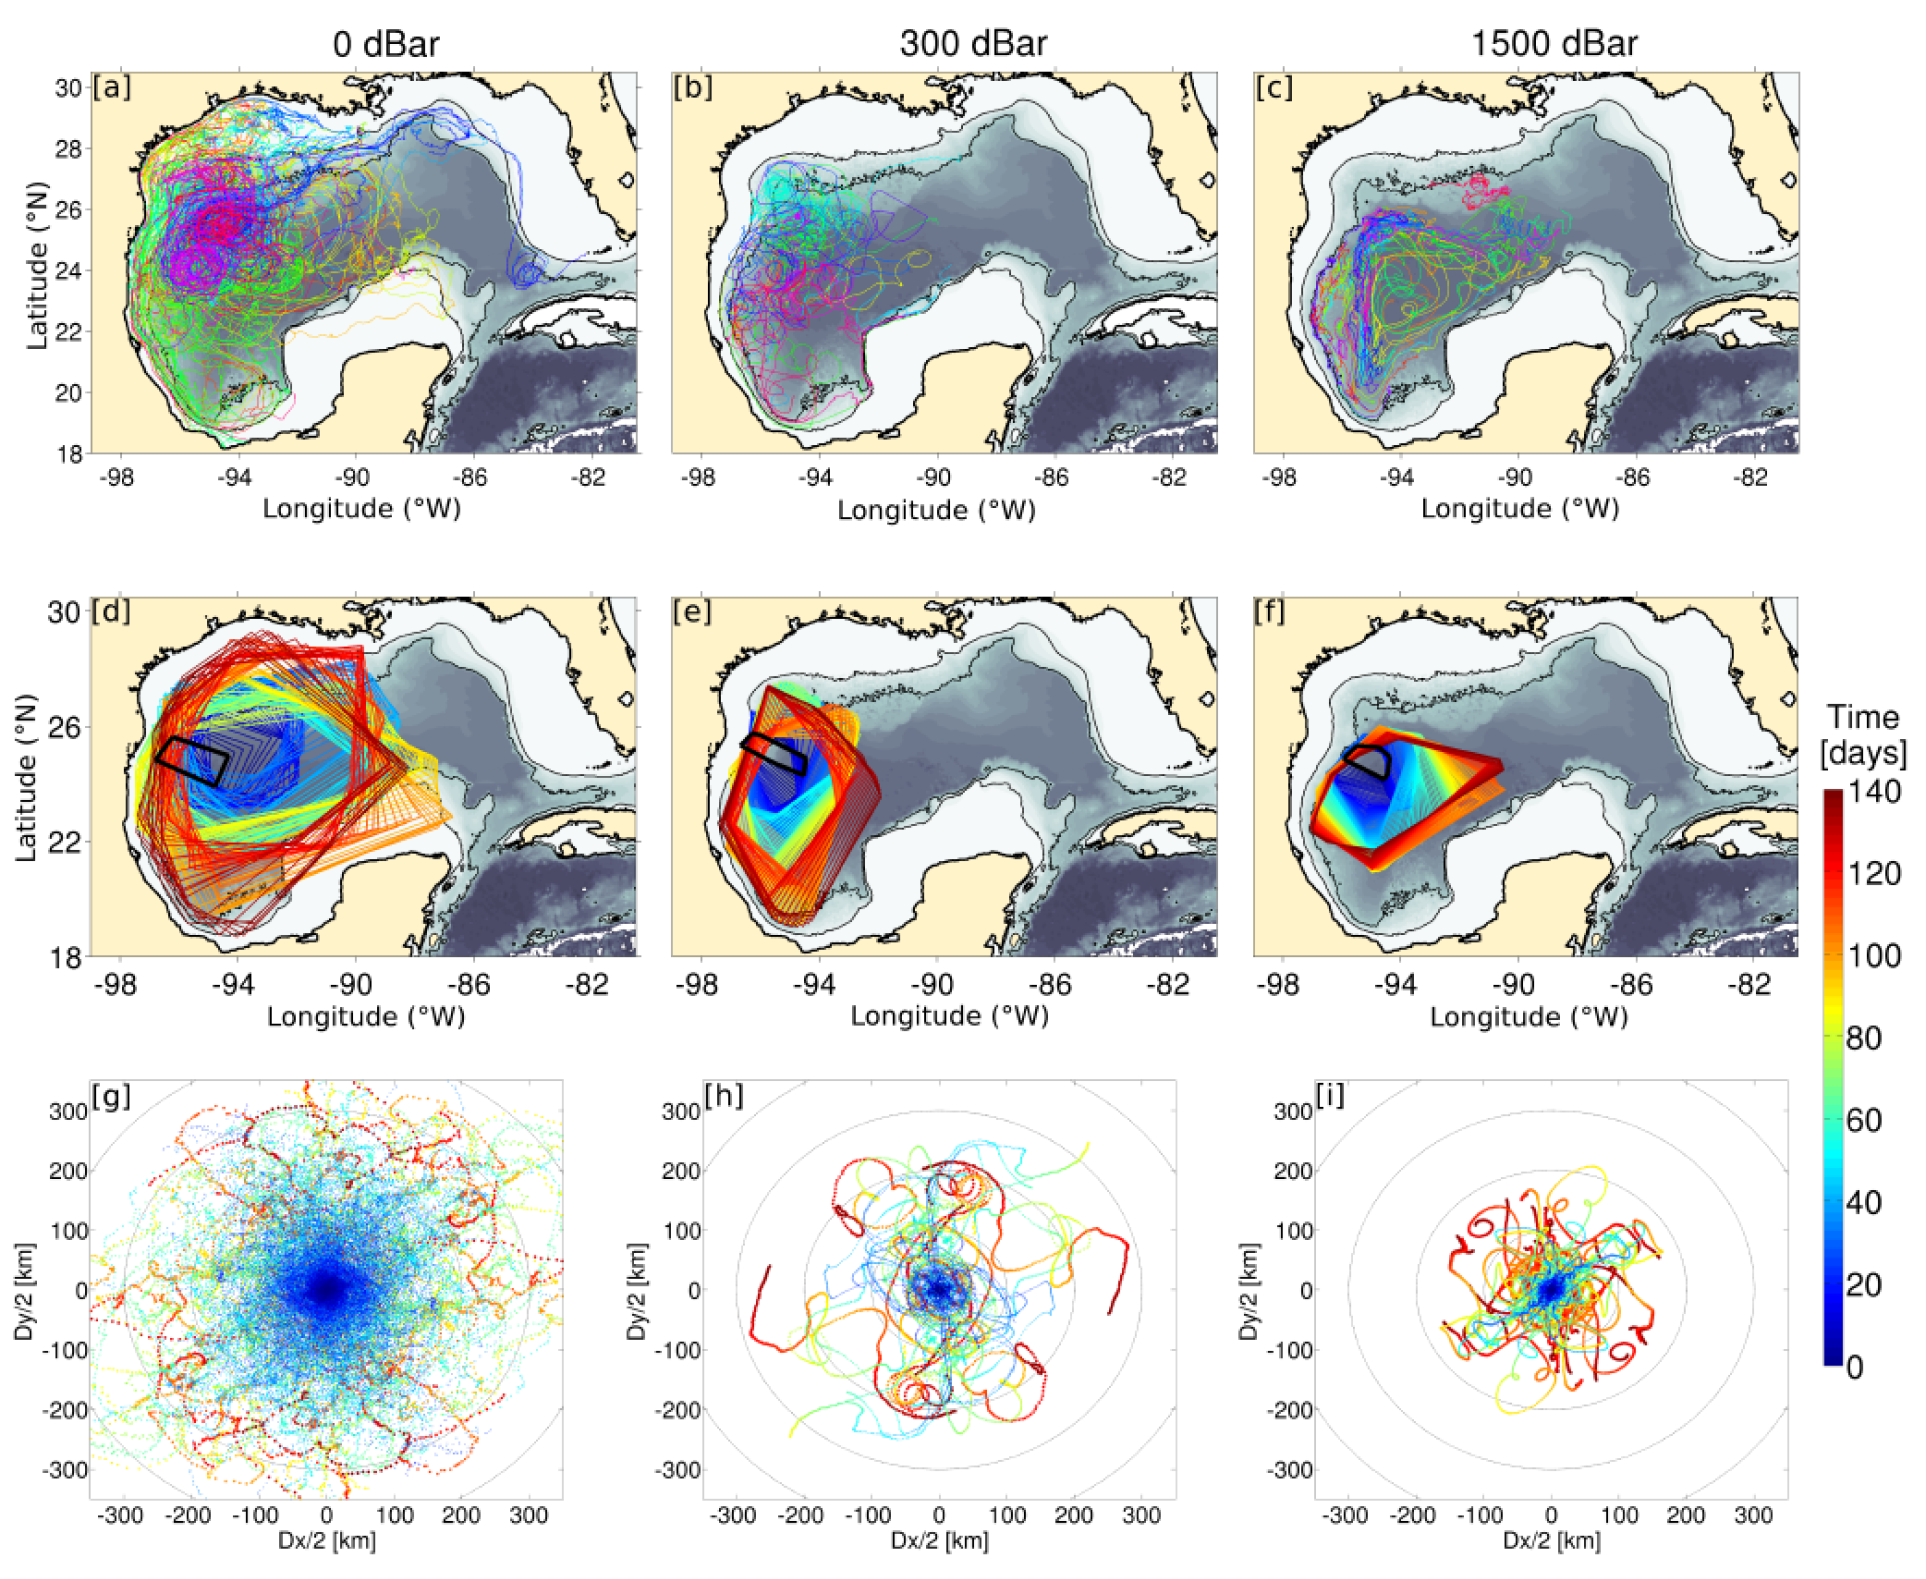
Deep Water Dispersion Experiment (DWDE) RAFOS float data
The RAFOS float dataset is available here: DWDE RAFOS Float Data on ZENODO.
Ramsey, A., H. Furey, A. Bower, P. Pérez Brunius, and P. García Carrillo, 2019. The Deep Water Dispersion Experiment: RAFOS Float Data Report, June 2016-January 2019. Woods Hole Oceanographic Institution Technical Report, WHOI-2020-01. doi:10.1575/1912/25273

Iceland Sea North Icelandic Jet RAFOS float data
Isobaric RAFOS floats ballasted for 800-dbar deployed 2014-2016 northeast of Iceland to trace the pathways of the East Greenland Current. PIs Femke de Jong, Henrik Soiland, and Amy Bower. The RAFOS data are available at NOAA Physical Oceanography Division's Global Drifter Program.
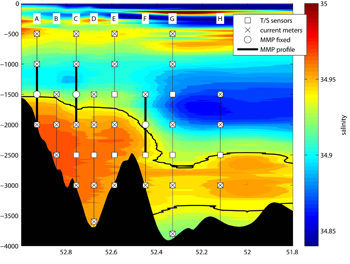
Charlie-Gibbs Fracture Zone
Eight moorings were deployed 2010-2012 across the Charlie Gibbs Fracture Zone. Instrumentation included microcats, current meters, and moored profilers, and data may be found at NODC.
Furey, H., L. Trafford, and Bower, A. S., 2014. A Crossroads of the Atlantic Meridional Overturning Circulation: The Charlie-Gibbs Fracture Zone Data Report, August 2010-June 2012. – August 2014. WHOI Technical Report WHOI-2014-04, 145 pp
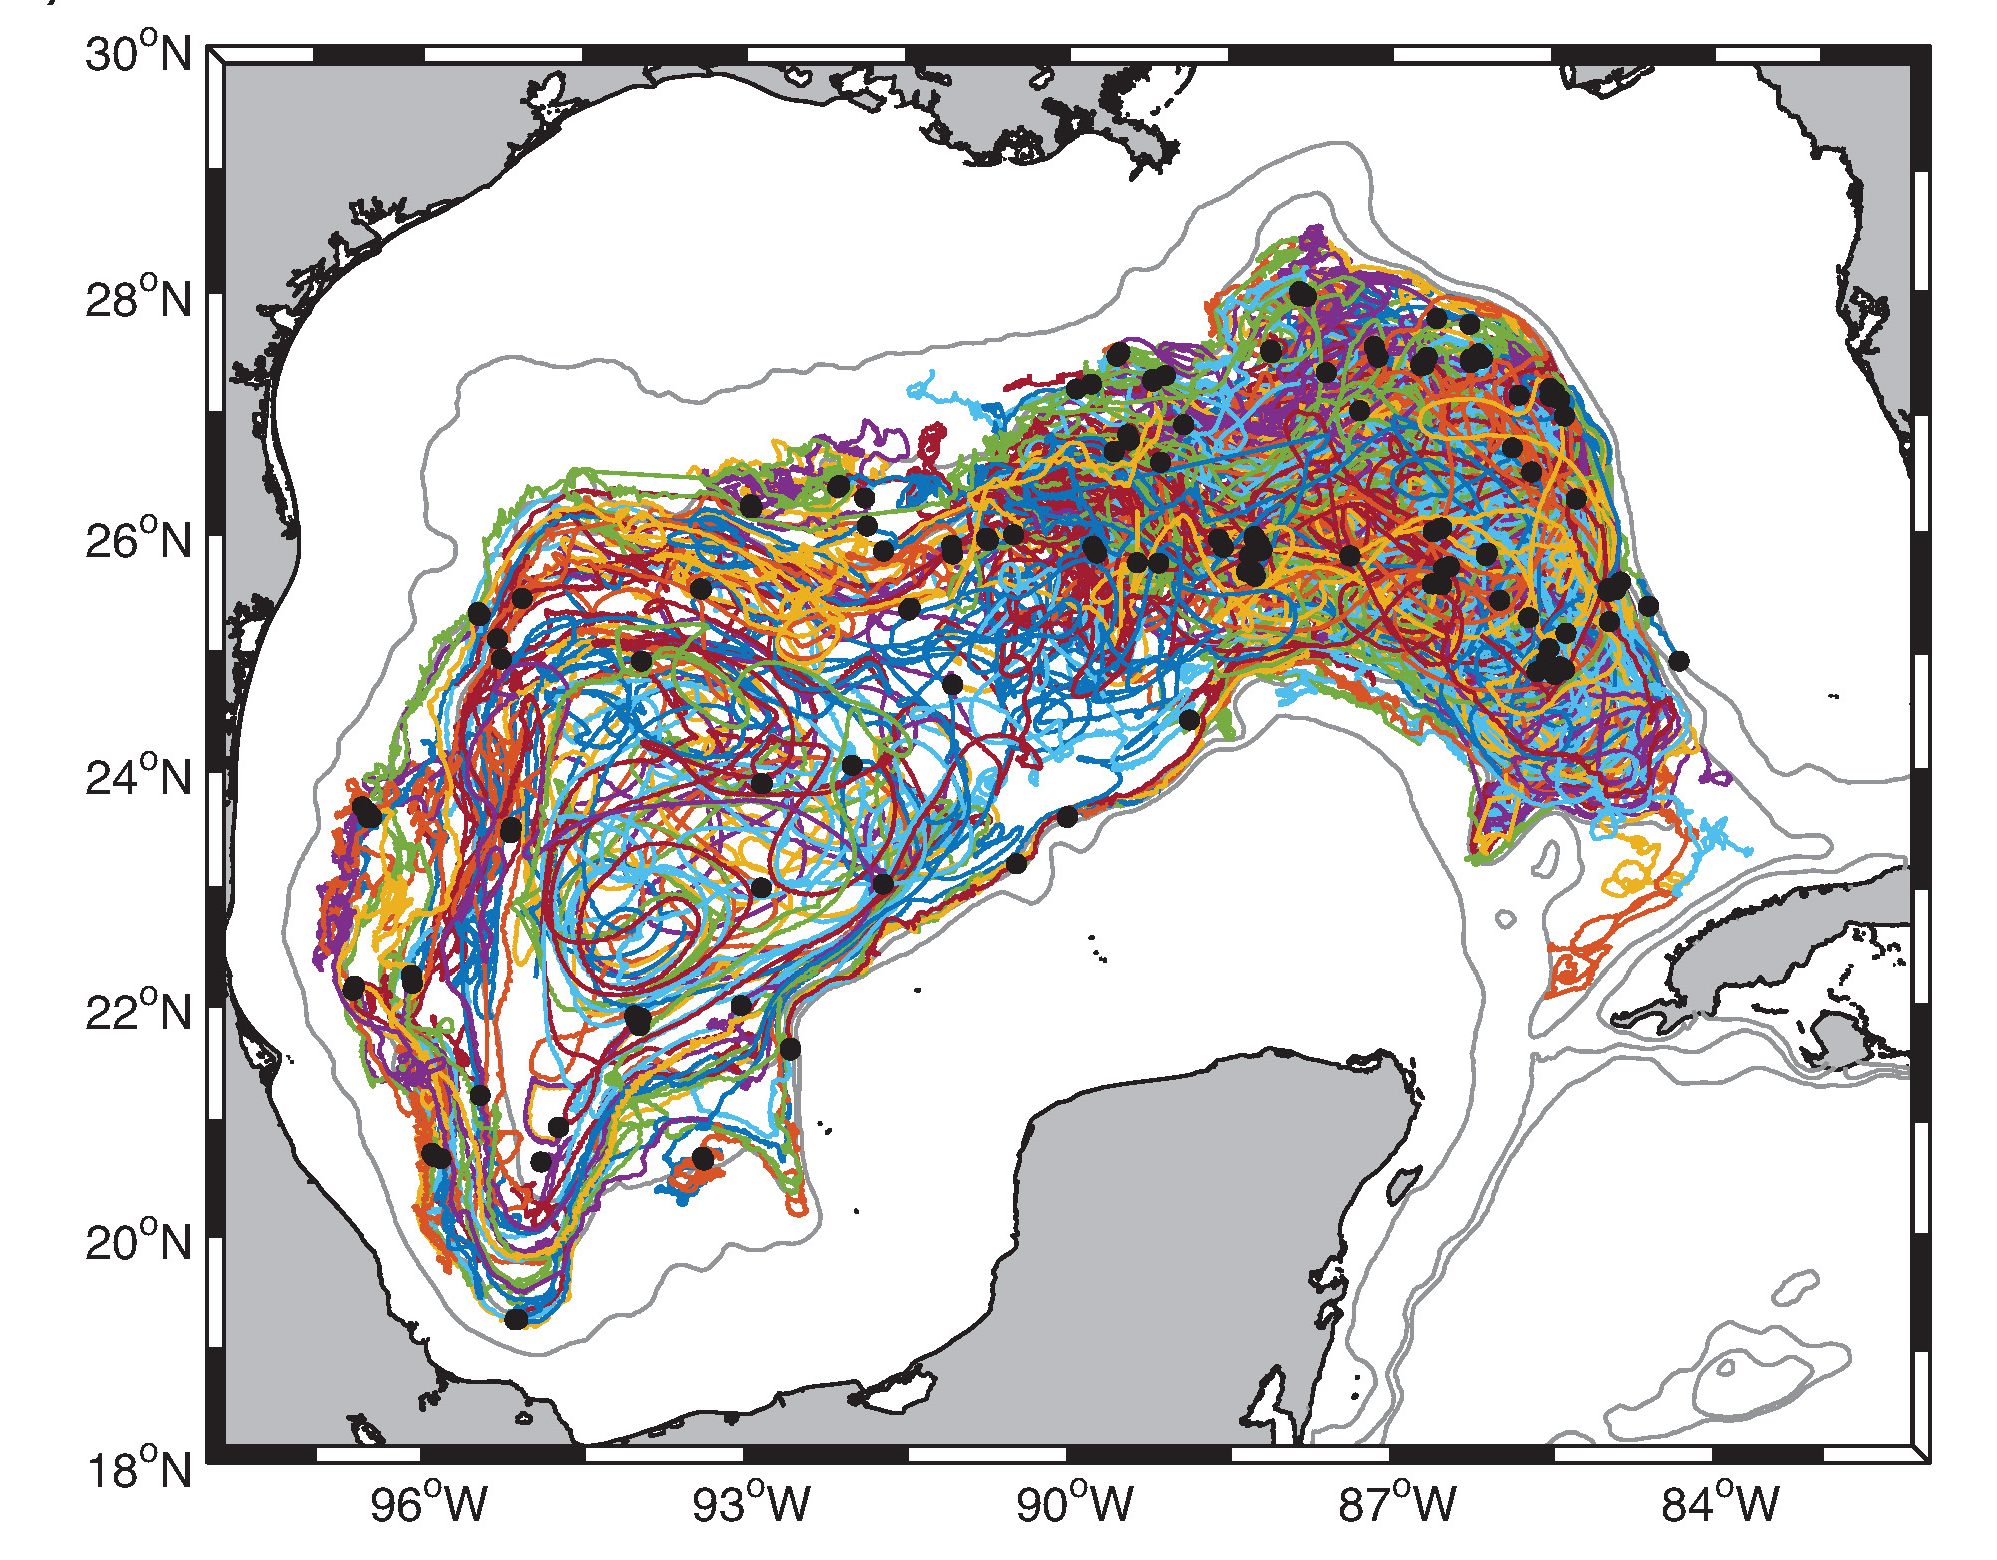
Deep Circulation in the Gulf of Mexico: A Lagrangian Study RAFOS and APEX data
One hundred fifty-two isobaric RAFOS floats ballasted for 1500- and 2500-dbars from 2011 to 2015 are available at NOAA Physical Oceanography Division's Global Drifter Program. APEX profiling float data may be found at GODAE.
Hamilton, P. A. Bower, H. Furey. R. Leben, and P. Perez-Brunius, 2016. Deep Circulations in the Gulf of Mexico: A Lagrangian Study. U.S. Department of the Interior, Bureau of Ocean Energy Management, Gulf of Mexico OCS Region, New Orleans, LA. OCS Study BOEM 2016-081, 289 pp.
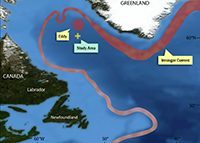
Irminger Rings Experiment mooring and profiling float data
One microcat/current meter mooring was mooring in the central Labrador Sea in the pathway of newly pinched Irminger Rings. The mooring was additionally equipped with two SALP carousels which launched APEX floats into passing Irminger Rings. The IR mooring data is available at NODC.
Furey, H. H., T. McKee, M. F. de Jong, P. E. Robbins and Bower, A. S., 2013. Impact of Irminger Rings on Deep Convection in the Labrador Sea: Mooring Instrument, Cruise CTD, and APEX Data Report, September 2007 – September 2009. WHOI Technical Report WHOI-2013-05, 103 pp.
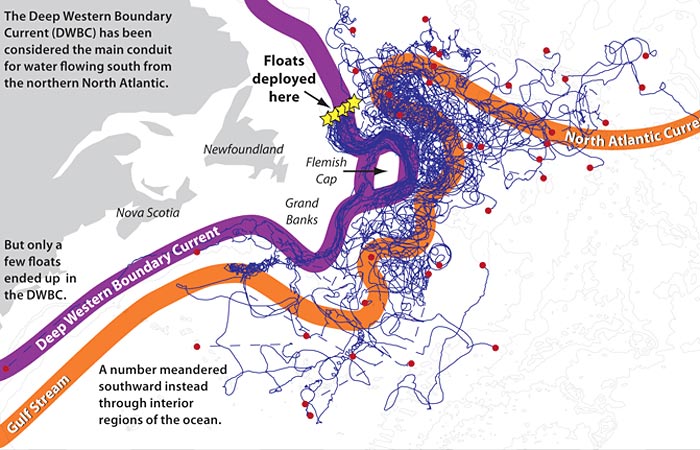
Export Pathways RAFOS float data
Nine deployments of isobaric RAFOS floats ballasted for 700 and 1500 decibars were launched across the shelf upstream of the Orphan Knoll, to target the Deep Western Boundary Current as it left the Labrador Sea. The RAFOS data are available at NOAA Physical Oceanography Division's Global Drifter Program.
Furey, H. H., and A. S. Bower, 2009. Export Pathways from the Subpolar North Atlantic: DLD2 RAFOS Float Data Report July 2003--November 2008. WHOI Technical Report WHOI-2009-06, 166 pp.
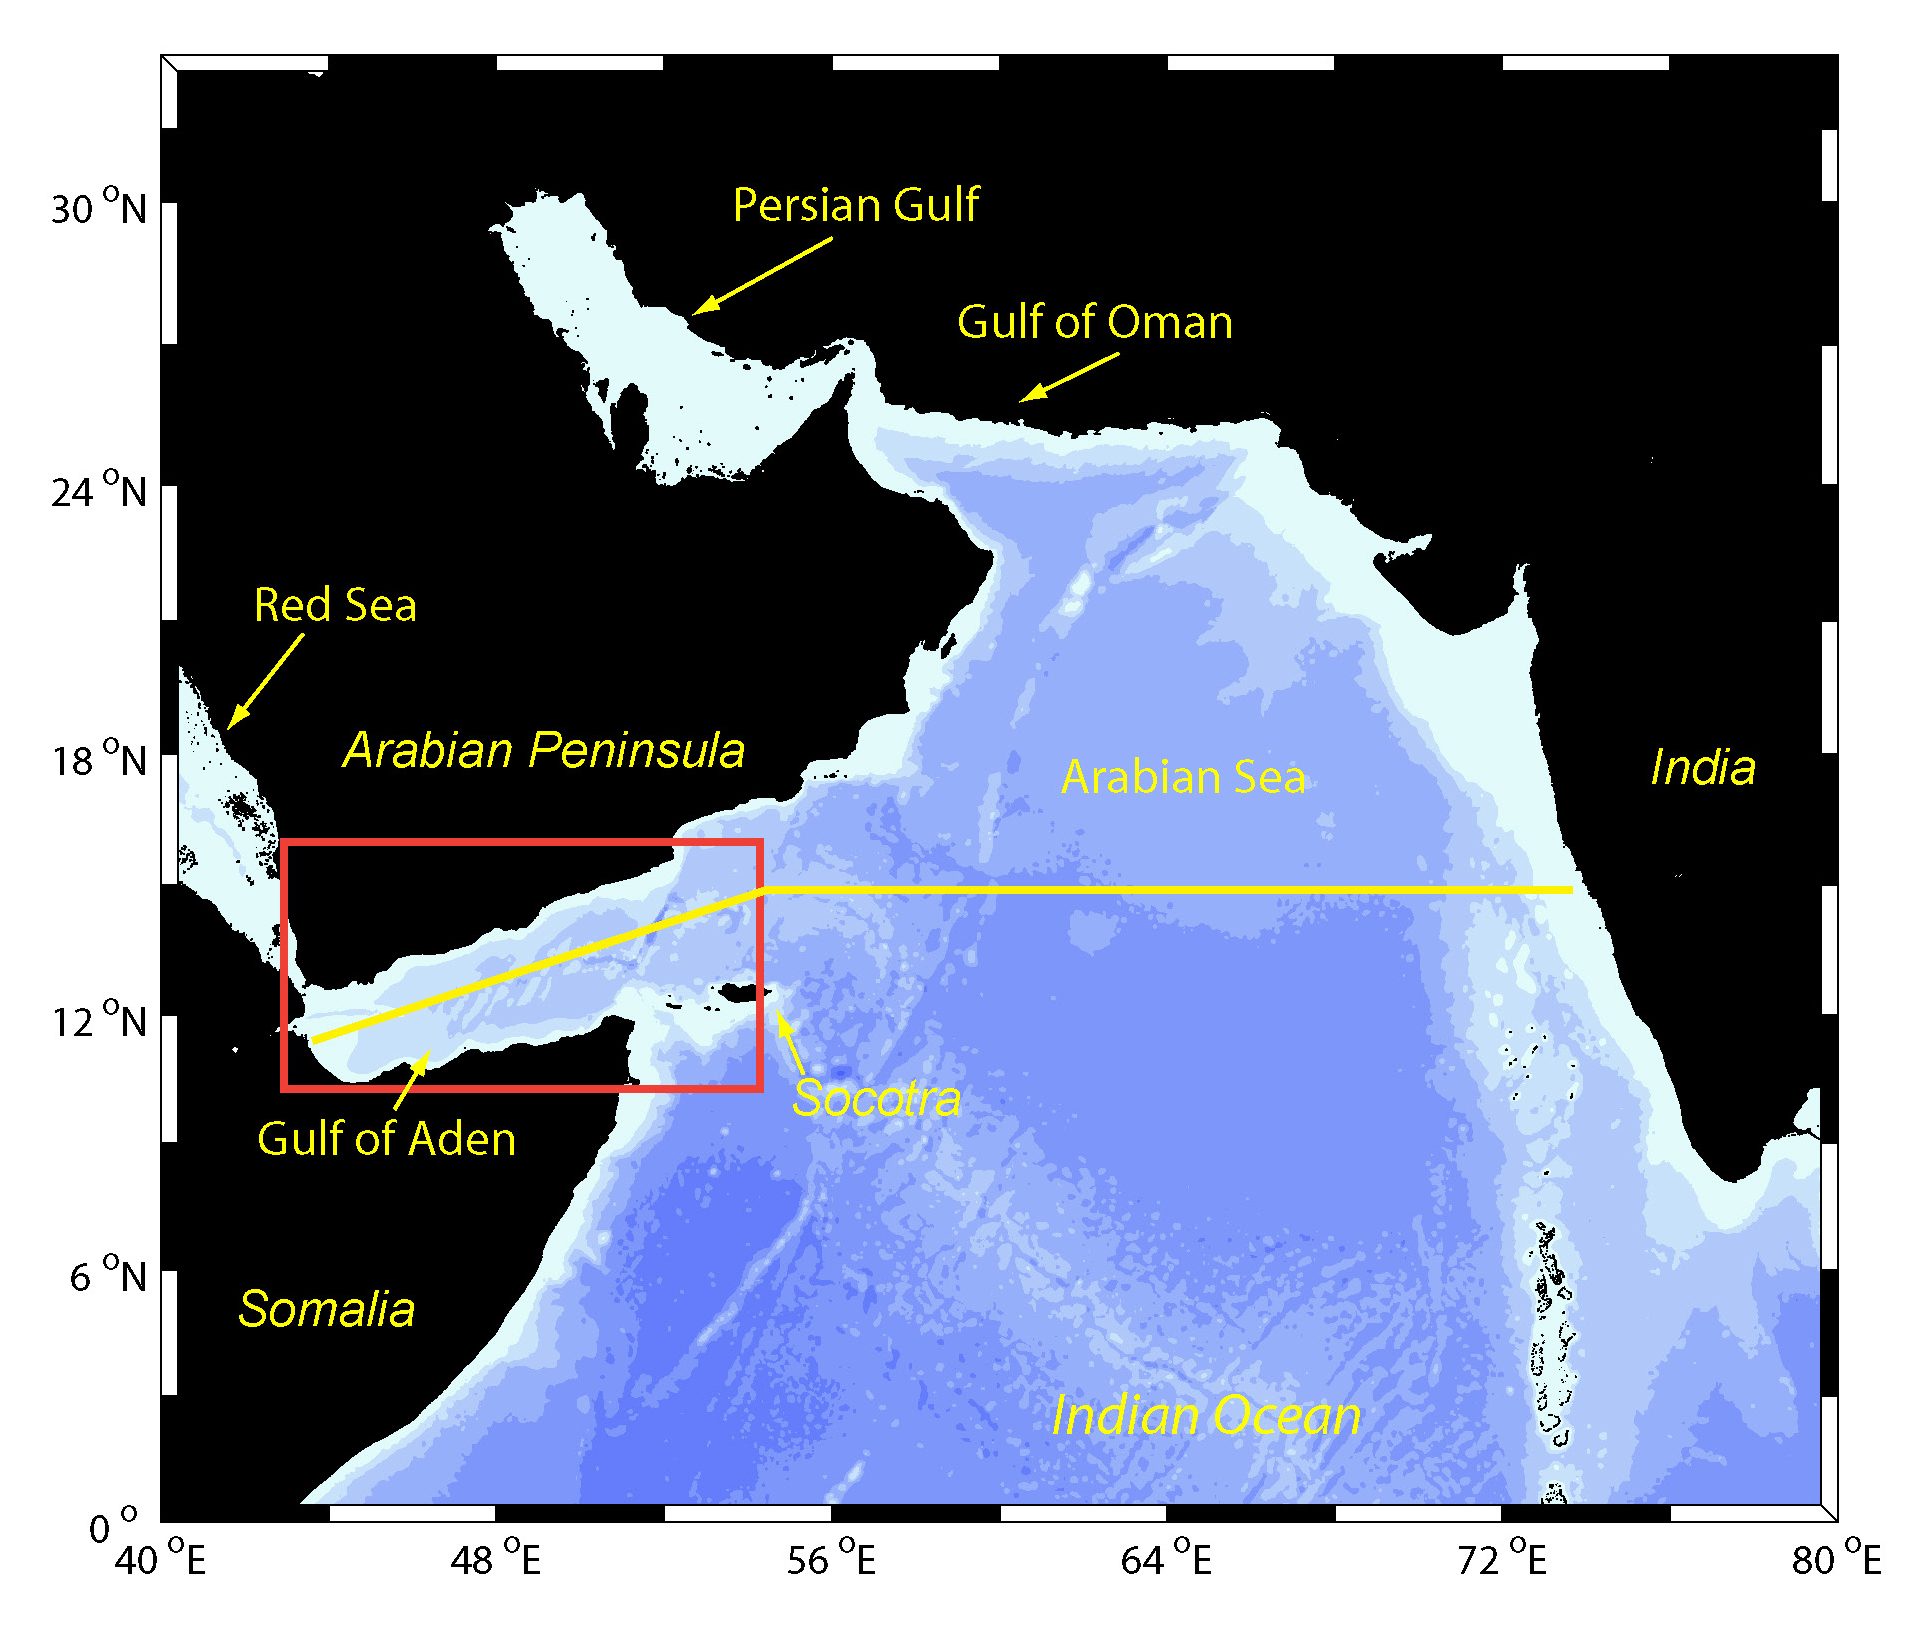
Red Sea Outflow Experiment (REDSOX) CTD survey and RAFOS float data
Two CTD surveys of the Gulf of Aden are available at NODC. Isobaric RAFOS float data ballasted for the Red Sea Outflow Water level at 650 dbars are available at NOAA Physical Oceanography Division's Global Drifter Program.
Furey, H., A. Bower, and D. Fratantoni, 2005. Red Sea Outflow Experiment (REDSOX): DLD2 RAFOS Float Data Report, February 2001--March 2003. WHOI Technical Report WHOI-2005-01, 137 pp.
Johns, W., H. Peters, R. Zantopp, A. Bower, and D. Fratantoni, 2001. CTD/O2 Measurements collected aboard the R/V Knorr, February-March 2001: REDSOX-1. University of Miami RSMAS Technical Report 2001-01, 499 pp.
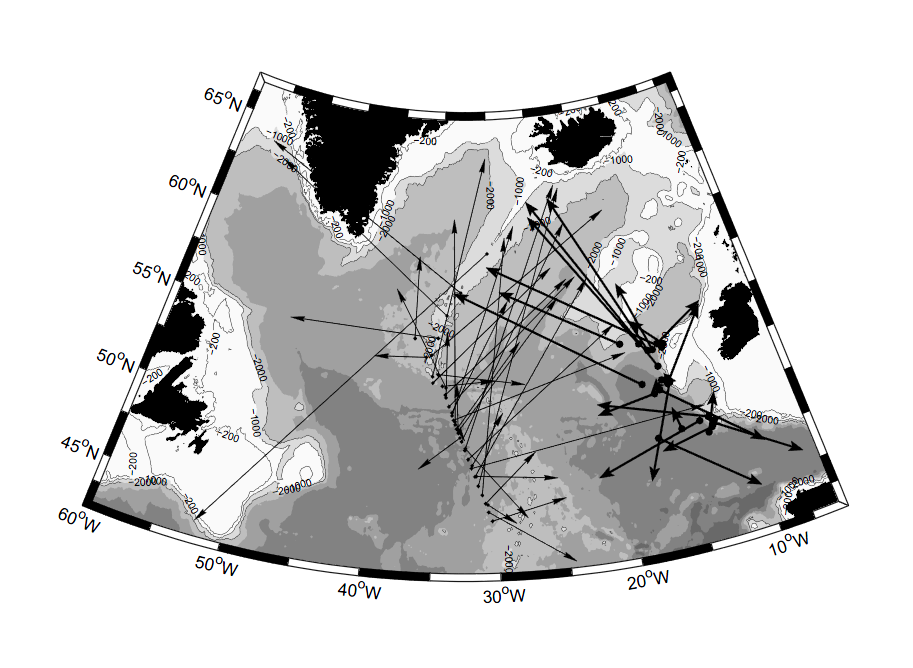
Warm Water Pathways in the Northeastern North Atlantic Atlantic Circulation and Climate Experiment (ACCE) RAFOS float data
Isopycnal RAFOS float data ballasted for 27.5 sigma-t surface (~100-800 meters depths), 1996-1999, are available at NOAA Physical Oceanography Division's Global Drifter Program.
Furey, H. H., A. S. Bower, and P. L. Richardson, 2001. Warm Water Pathways and Intergyre Exchange in the Northeastern North Atlantic: ACCE RAFOS Float Data Report, November 1996-November 1999. WHOI Technical Report WHOI-01-17, 153 pp.
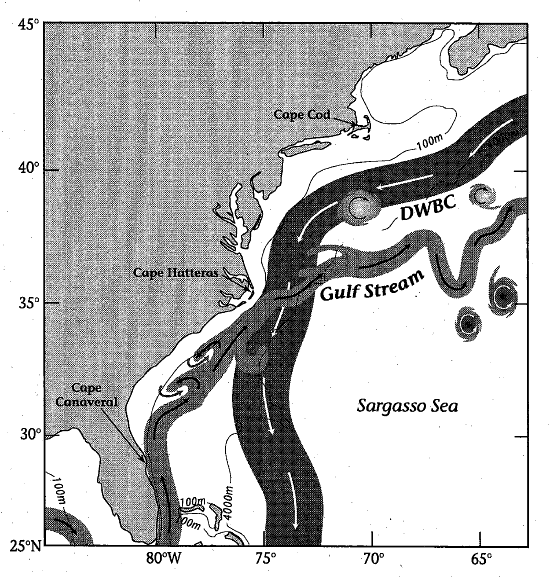
Boundary Current Experiment (BOUNCE) RAFOS float data
Fifteen isopycnal RAFOS floats data ballasted for 27.73 sigma-t surface (~800 meters depths) and fifteen isobaric RAFOS floats ballasted for 3000 dbars, were deployed west of Cape Cod from 1994-1997, to follow the Upper Labrador Sea Water and Nordic Overflow Water components of the Deep Western Boundary Current as it traveled along the western subtropical Atlantic, passing underneath the Gulf Stream. These data are available at NOAA Physical Oceanography Division's Global Drifter Program.
Hunt, H. D., and A. S. Bower, 1998. Boundary Current Experiment I & II RAFOS Float Data Report 1994--1997. WHOI Technical Report WHOI-98-06, 105 pp.
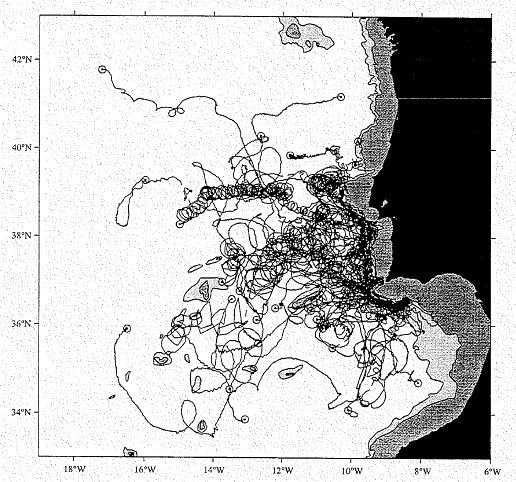
A Mediterranean Undercurrent Seeding Experiment (AMUSE) RAFOS float data
Fourty-nine isobaric RAFOS floats data ballasted for 1100and 1200 dbars, were deployed at Cape St. Vincent, Portugal, from 1993-1995, to seen the Mediterranean Outflow as it exited the Mediterranean Sea and formed Meddies. These data are available at NOAA Physical Oceanography Division's Global Drifter Program.
Bower, A. S., J. Pallant, and C. L. Chandler, 1997. A Mediterranean Undercurrent Seeding Experiment (AMUSE): Part I: Program Description and Hydrographic Measurements. WHOI Technical Report WHOI-01-97, 269 pp.
Hunt, H. D., C. M. Wooding, C. L. Chandler, and A. S. Bower, 1998. A Mediterranean Undercurrent Seeding Experiment (AMUSE): Part II: RAFOS Float Data Report May 1993 - March 1995. WHOI Technical Report WHOI-98-14, 131 pp.