Dispatch 5: Science Plan
Isabela Le Bras
August 25, 2021
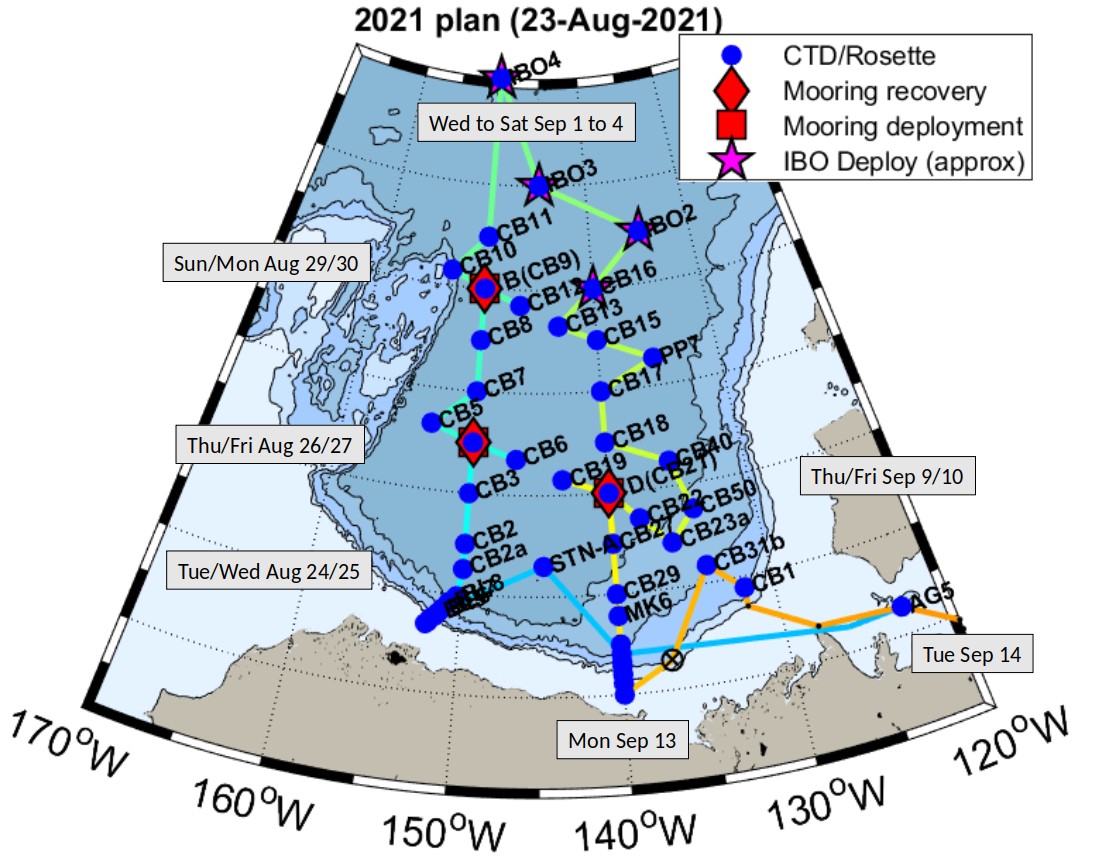
There are few vessels capable of transiting in the central Beaufort Gyre, let alone carry out scientific research, so our expedition is packed with science. As we steamed out from Cambridge Bay into the central Beaufort Gyre, we analyzed available sea ice charts and images as well as weather reports to chart a cruise track that optimized our time. Given that a tongue of thick and concentrated sea ice was impeding the eastern side of our research area, we decided to complete our expedition in a clockwise pattern to maximize time spent in areas that were clearer. The sea ice in the east is expected to melt back, at least in the southern area, so that we can complete work that we skipped over on the way back. Of course, it is always possible that the wind will blow more sea ice into our study area – we will likely have to adjust as the cruise goes on!
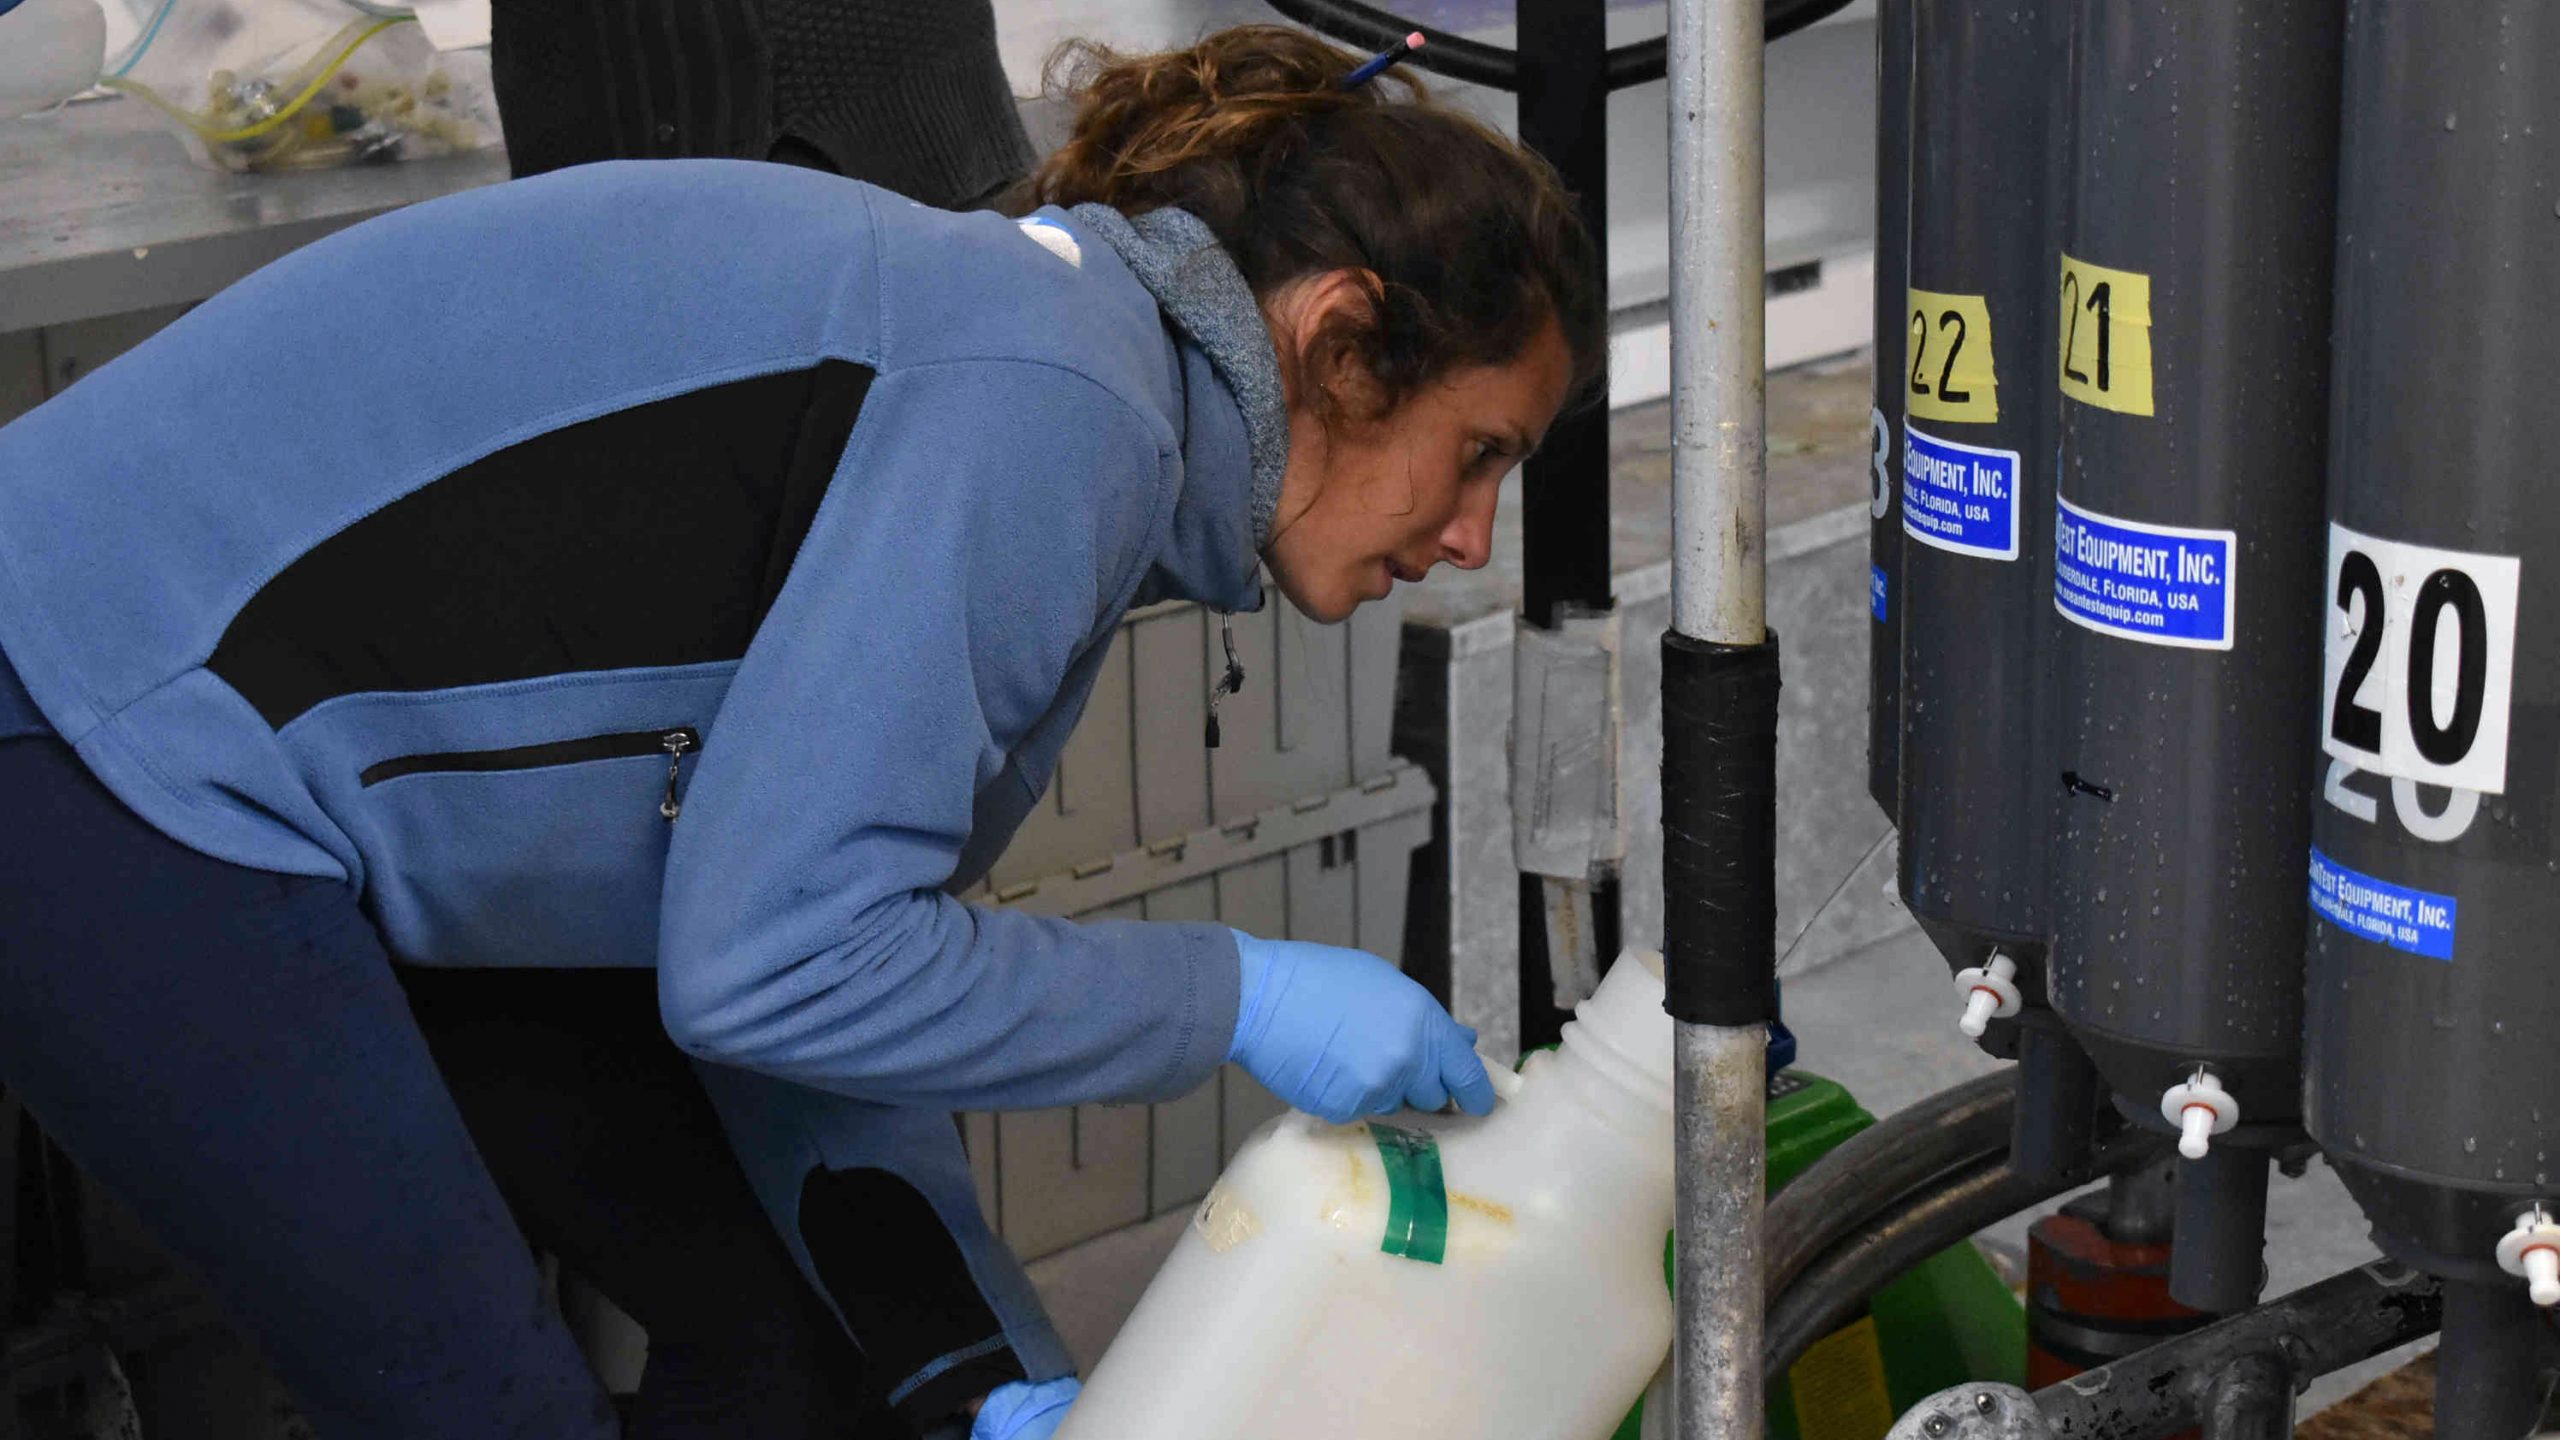
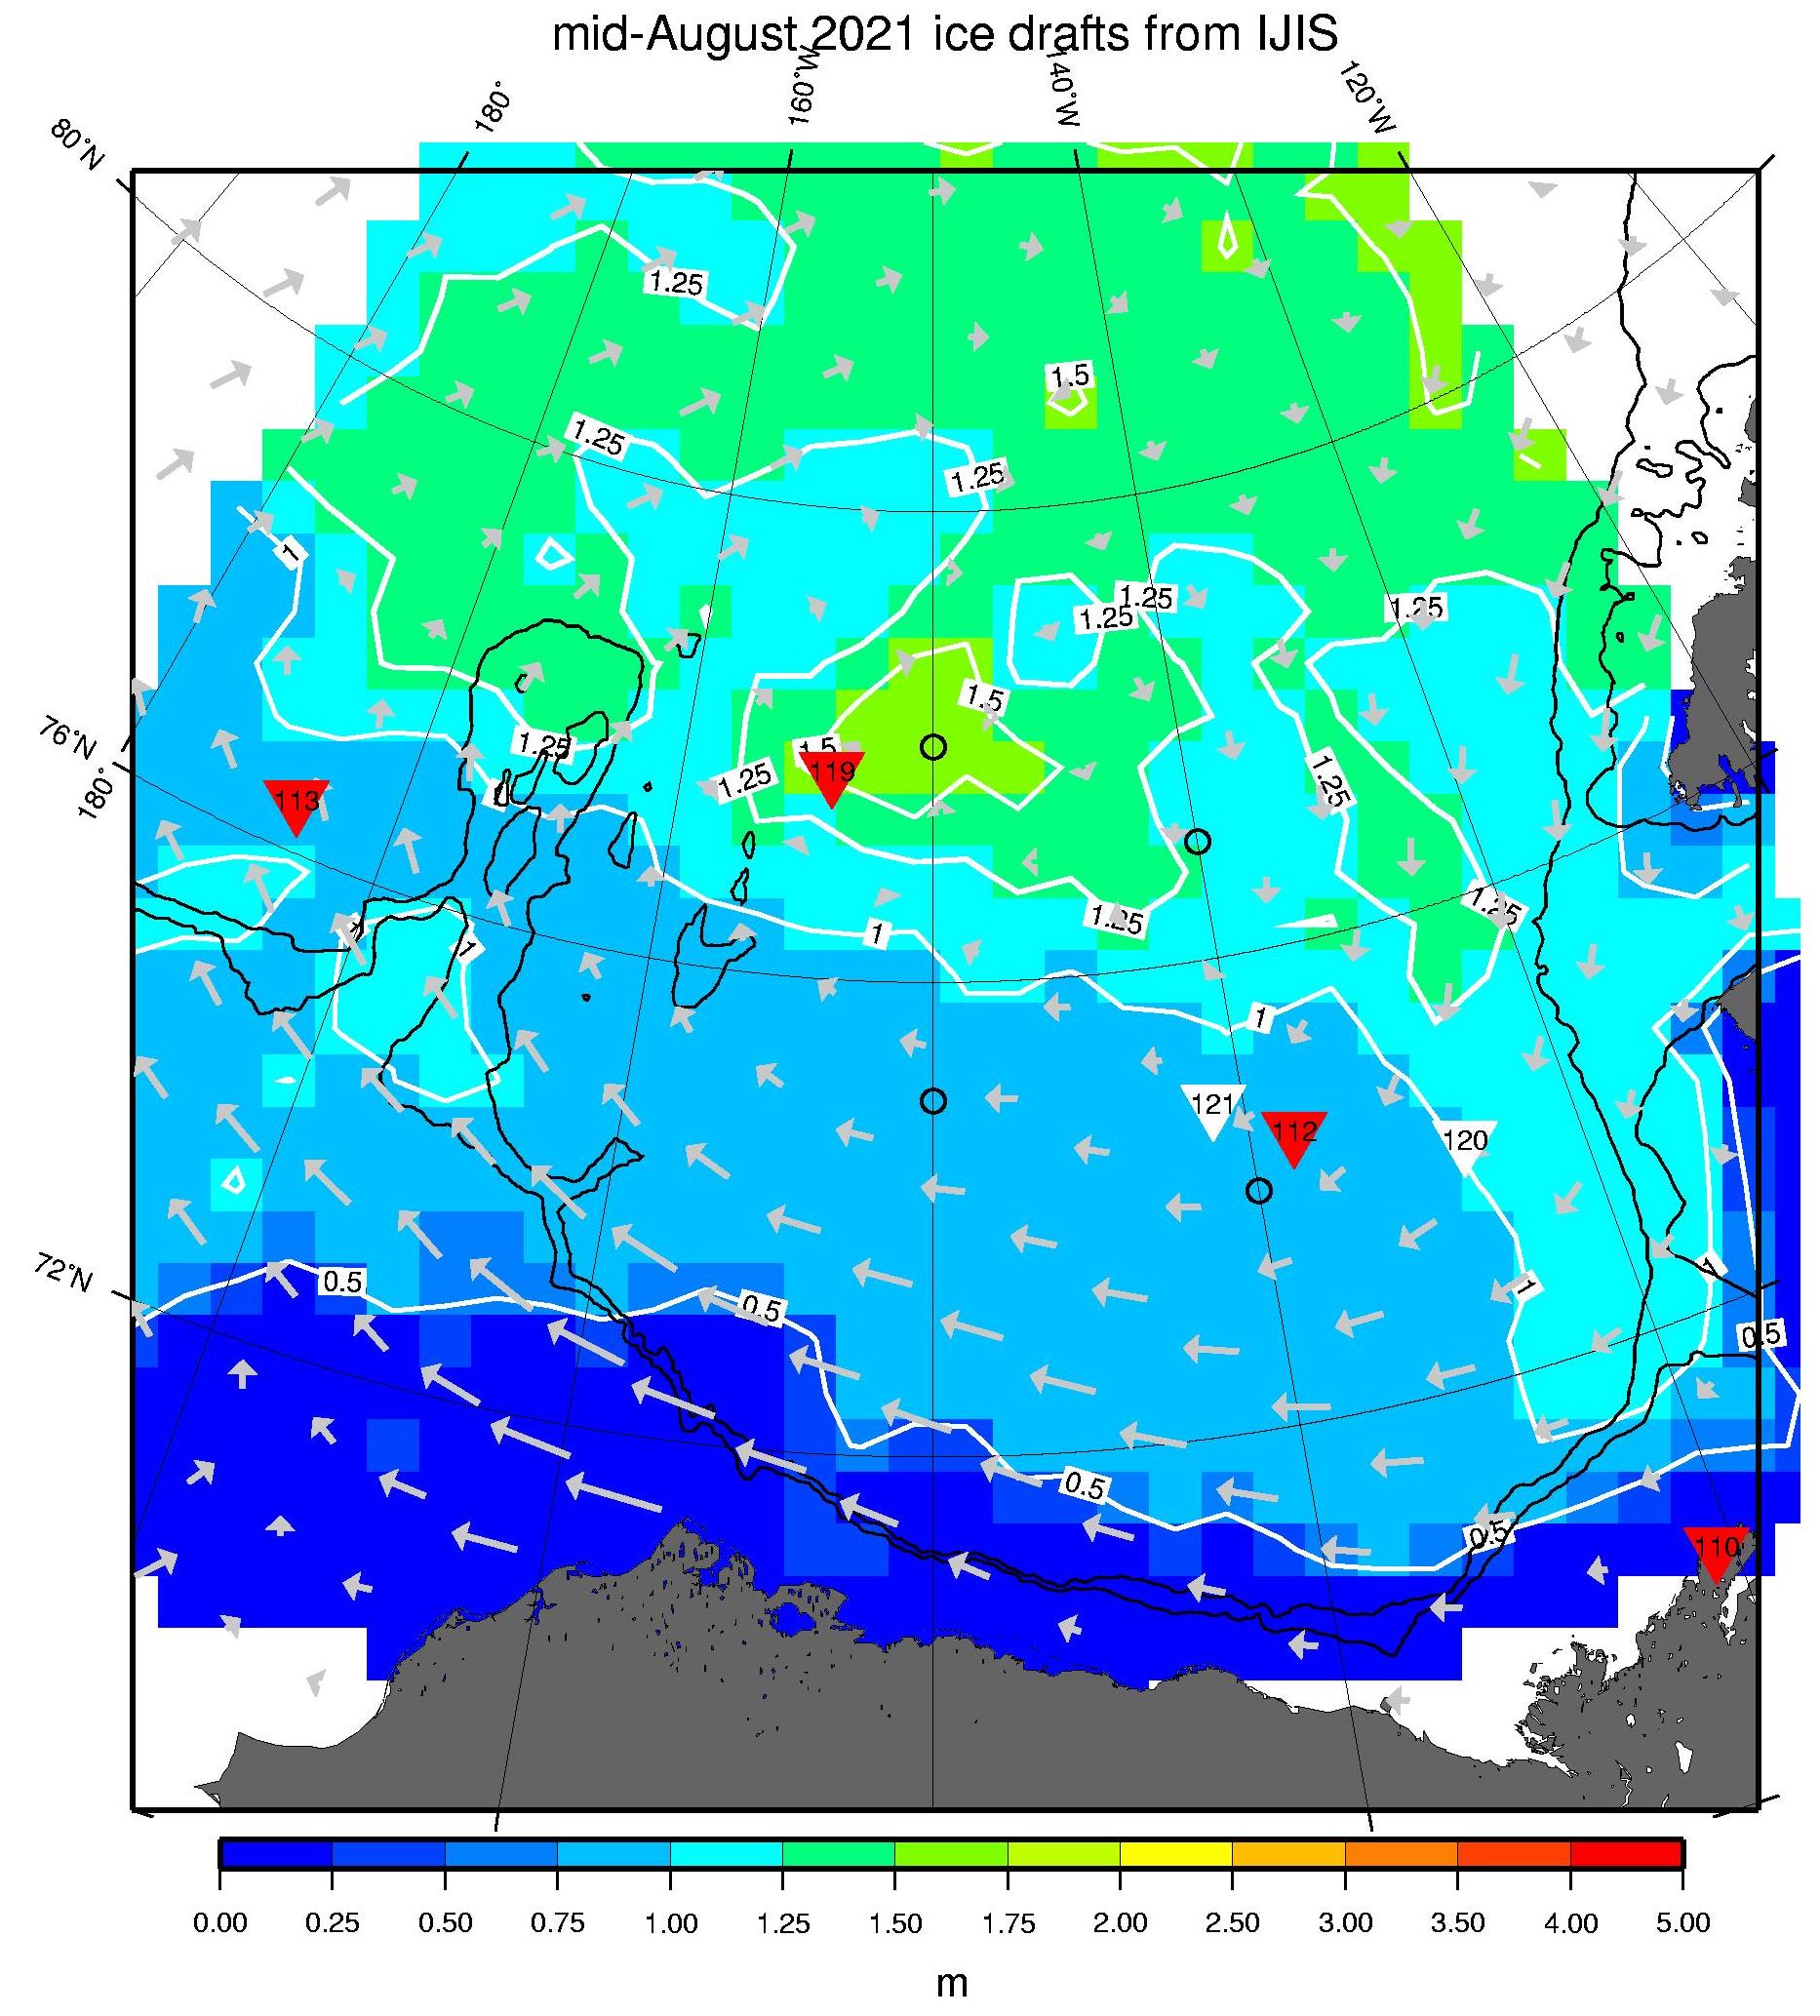
The three major components of our expedition are (1) a CTD survey of the region, (2) mooring recovery and re-deployment, and (3) sea ice stations. The CTD stations are arranged in a tic-tac-toe-like pattern covering the deep Beaufort Basin, where Arctic freshwater accumulates in the clockwise Beaufort Gyre. CTD station is in fact a bit of an understatement as this is one the most sampled CTD rosettes I have seen! Not only are we sampling an exceptionally full suite of biogeochemical variables, there is also a team looking at DNA/RNA in the water column. Many CTD stations also include bongo net tows for zooplankton and between CTD stations XCTDs are deployed to fill in the measurement grid.
At three of the intersections of the tic-tac-toe grid there are moorings that will be recovered and re-deployed. The ice stations will be deployed in suitable northern locations, where there are larger and thicker sea ice floes. Chief Scientist Sarah Zimmerman drew up a science plan (see above) that takes into account transit and operation times for all of these different cruise components with approximate dates marked for the Barrow and Mackenzie Lines in the south, mooring operations, ice stations (IBO) in the north, as well as an on-time arrival back in the Archipelago for our flight back home.
Having completed AG5, STN-A, and the Barrow Line, we are now working our way north at 150W. Next up is our first mooring recovery and re-deployment at mooring “A” (150W, 75N). These operations will each take a full day’s work. This is especially exciting for me as part of the WHOI team since the recovery of these moorings was delayed due to COVID last year. All of our fingers and toes are crossed that these important measurements will surface on Friday after 3 years under the surface!
