Dispatch 5: Dissolved Oxygen Samples
Ashley Arroyo
September 20, 2022
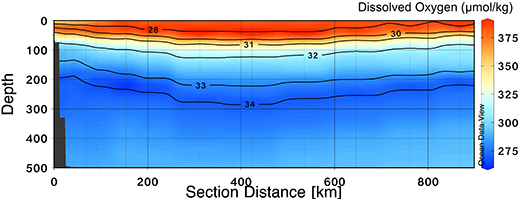
One of the important quantities that we sample here on the Louis S. St-Laurent is dissolved oxygen! Dissolved oxygen is a valuable water-column property that can provide insight on the biology, pathways, and evolution of the different water masses in the Arctic Ocean. The dissolved oxygen concentrations are originally set when waters are at the surface and exposed to the atmosphere, allowing for air-sea interactions. During atmospheric equilibrium, the dissolved oxygen concentrations depend on the surface water properties, i.e., temperature, and salinity. For example, cooler and fresher water can absorb more oxygen from the atmosphere than warmer and saltier water can. Dissolved oxygen concentrations can be further modified by biological activity; dissolved oxygen is produced during photosynthesis and consumed through organic matter respiration (i.e., breakdown of organic matter). In the Arctic, sea-ice concentrations also affect dissolved oxygen concentrations, as the presence of sea-ice can inhibit air-sea interactions. High resolution dissolved oxygen data are collected via a SeaBird Electronics 43 sensor that is equipped on the rosette during CTD casts, which quantifies the flux of oxygen molecules that diffuse through a membrane. To convert from the sensor data to oxygen concentrations, a calibration algorithm, incorporating water temperature, salinity, pressure, calibration coefficients, and correction constants, is applied. Lower resolution data are collected at discrete depths in the Niskin bottles, which are later analyzed onboard.
Sampling the dissolved oxygens from the Niskin bottles requires the scientists to be very careful to avoid contamination from atmosphere exposure. As soon as the CTD cast is complete and the rosette is back on board, the dissolved oxygens are the first of the properties to be sampled from the bottles. As soon as the samples are collected in glass flasks, two substances (manganous chloride and alkaline iodide) were added to the sample to “preserve” it, so that no dissolved oxygen can enter or escape prior to analysis.
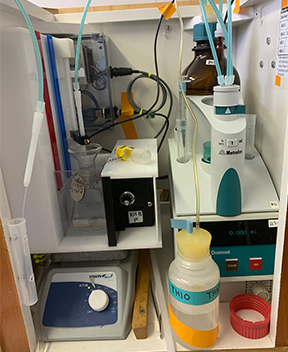
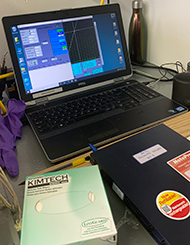
Once the dissolved oxygen samples are safely transported to the oxygen shack, Erinn Raftery, one of the scientists onboard, is responsible for analyzing the samples using a titration technique. Right before Erinn begins analyzing the sample, sulfuric acid (H2SO4) is added, which reacts with the manganese chloride and alkaline iodide that were added to preserve the oxygen concentrations, causing the sample to turn an orange/yellow color. Next, a titration (like the ones typically done in high school chemistry class) is performed by slowly adding thiosulphate to the sample until it turns colorless. During this process, the voltage of the sample, which is used as a measure for how “colorless” the sample is, is being measured with each amount of thiosulphate that is being added. As the titration progresses, the voltage increases as the volume of thiosulphate is added, until a point where the voltage stops increasing and the titration is complete. The total volume of thiosulphate added at the completion of the titration is then used with stoichiometry to calculate the dissolved oxygen concentration from the bottle sample in mL/L.
Since the dissolved oxygen concentrations are measured using two separate methods (i.e., the dissolved oxygen sensor on the rosette and the Niskin bottle data analysis), it is important to ensure that the concentrations using the different methods are comparable within a certain range. If any of the samples that Erinn has analyzed are not within the range, there is likely something wrong with the dissolved oxygen sensor on the rosette, which is something the scientists would then address.
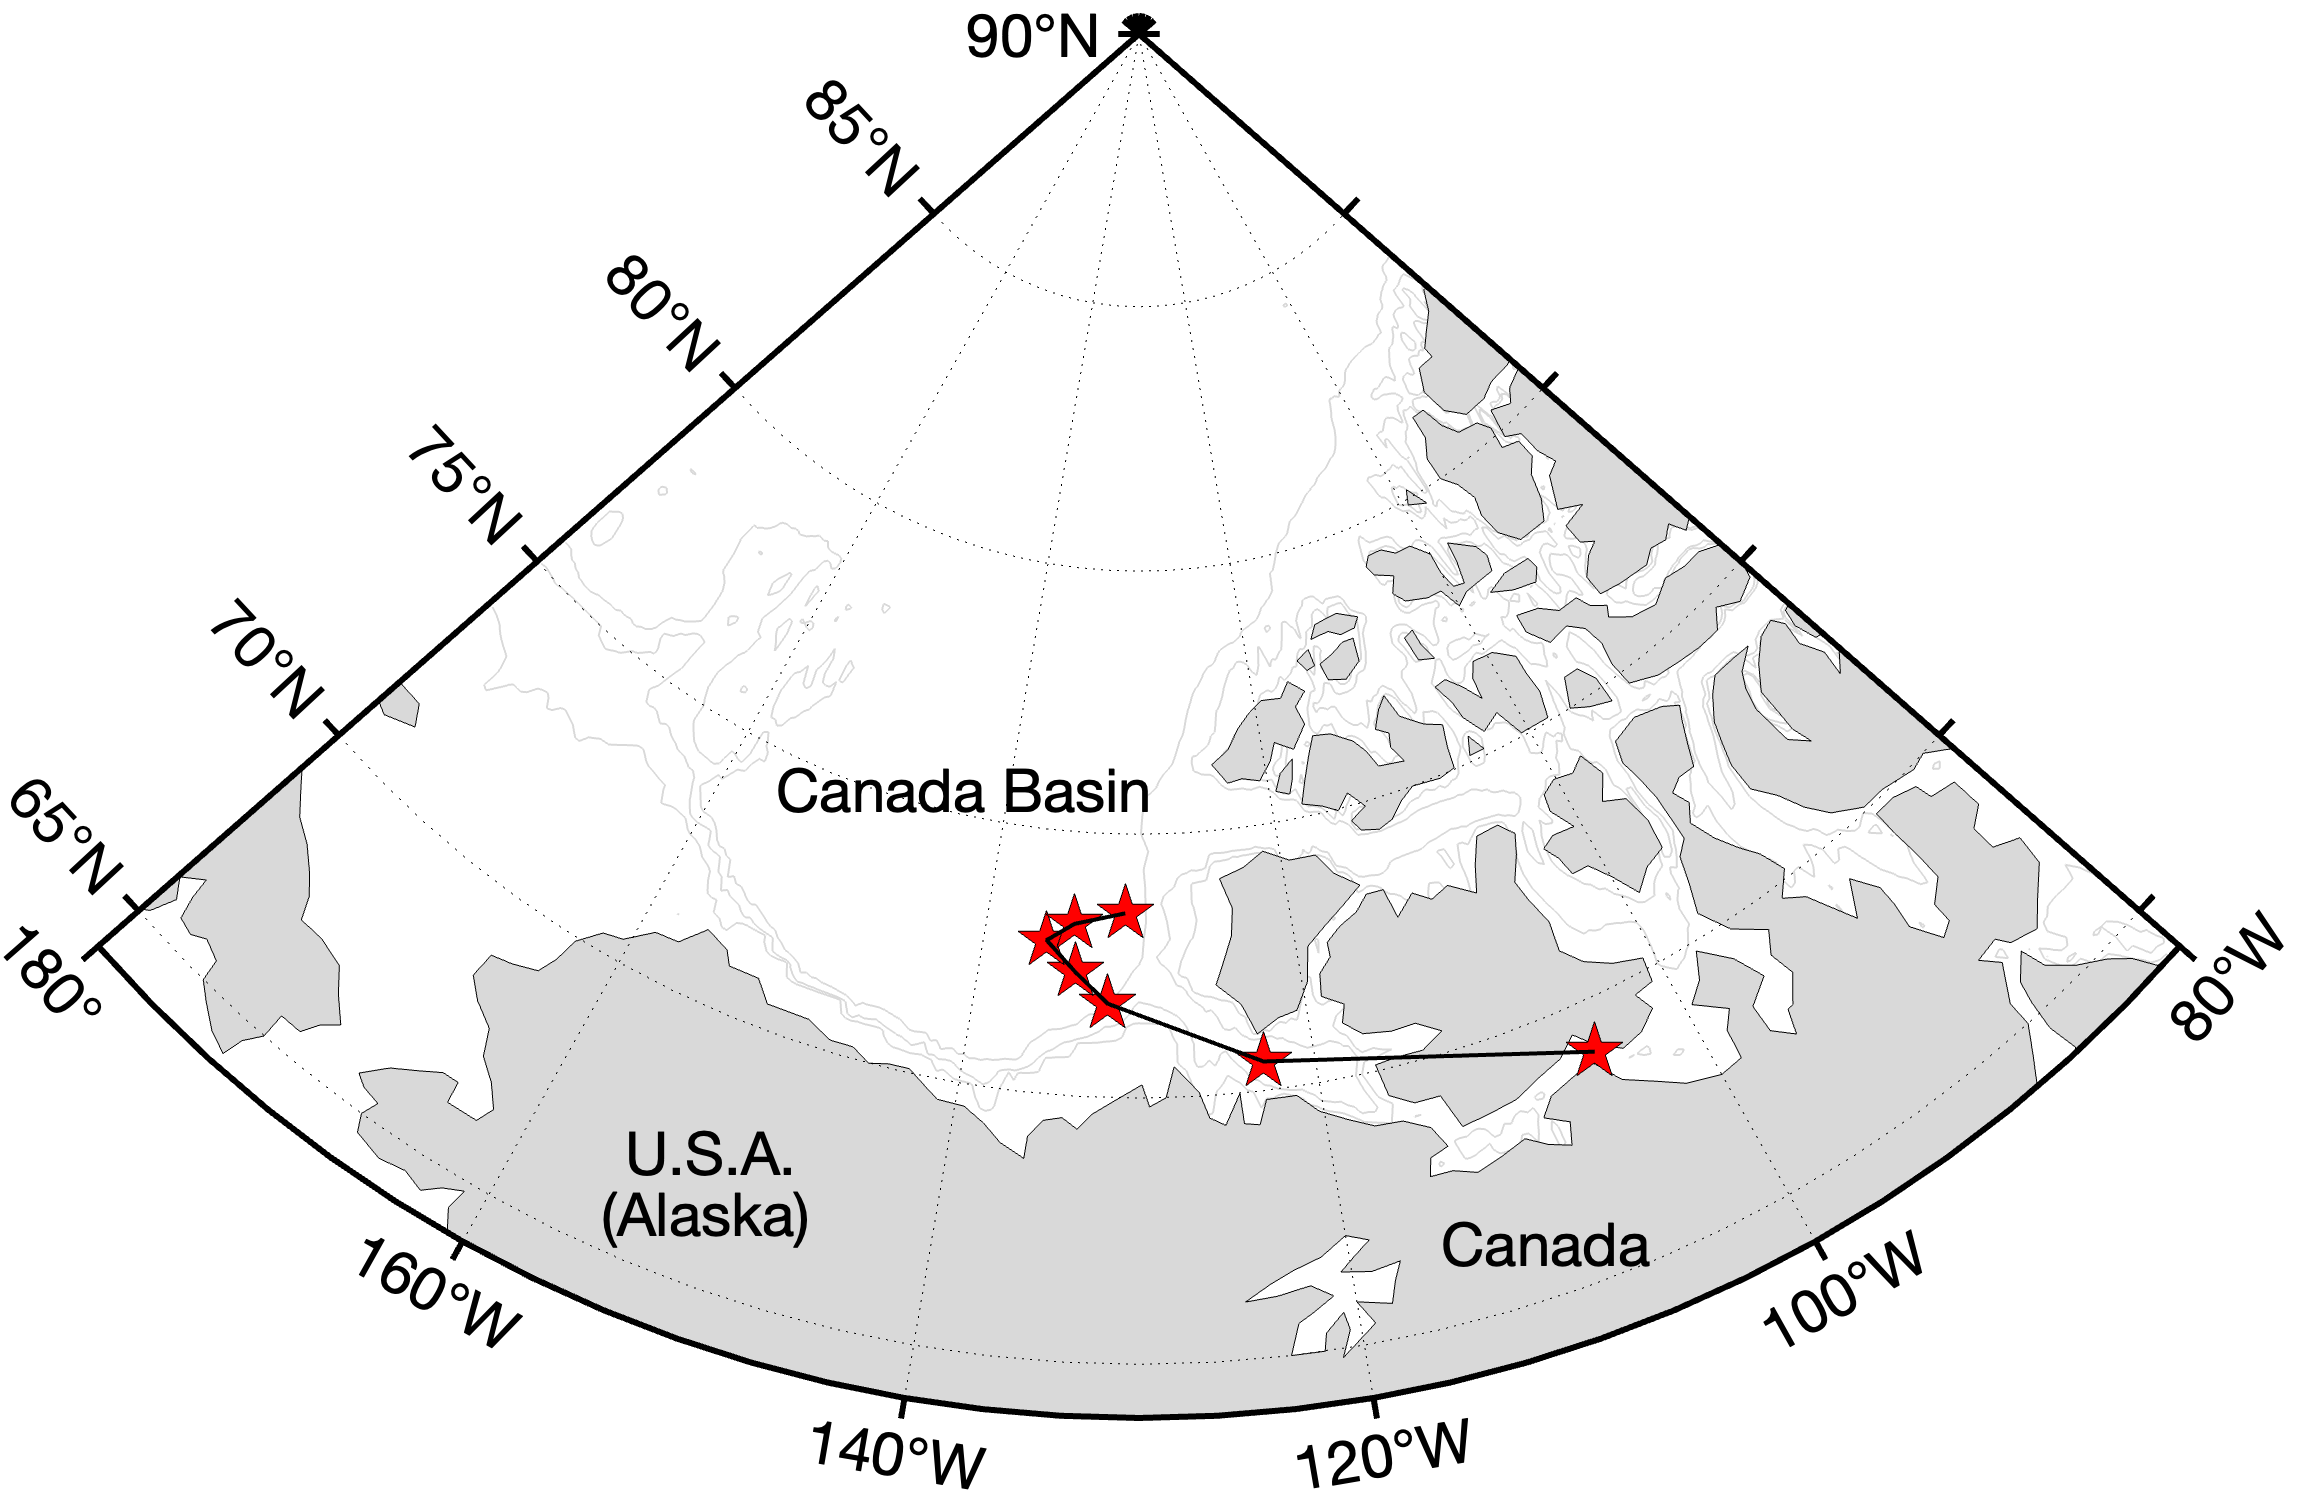
It is important to continue monitoring biogeochemical properties like dissolved oxygen in the Beaufort Gyre region to help us understand how the water column is evolving, both physically and biologically. Dissolved oxygen concentrations largely influence ecosystems, habitats, and nutrient cycling, so it is crucial that we are keeping track of them!


