River-Runoff Forcing Data
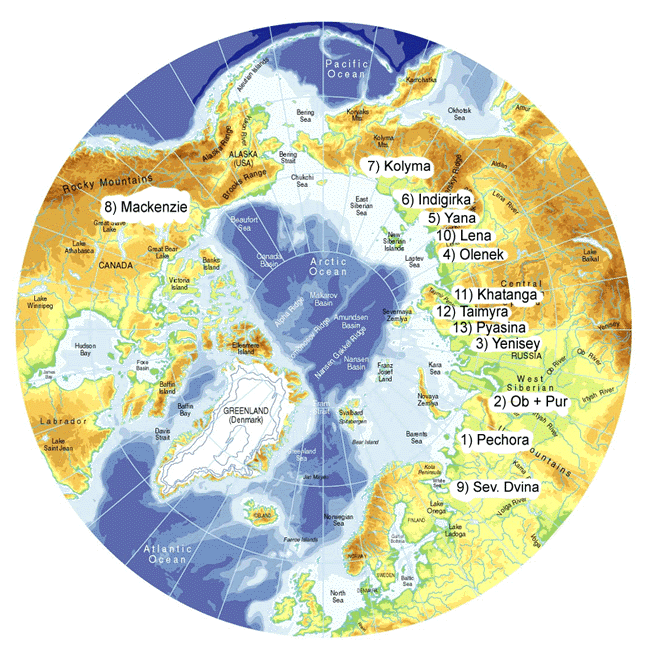
The river-runoff forcing data set is a climatology from AWI (Prange, 2001, 2002) which is based on raw data from the Global River Data Center (GRDC) in Koblenz, Germany. The data set contains monthly runoff for thirteen major arctic rivers. The river names and locations are illustrated on a map.
R-ArcticNET
The Global Runoff Data Center (GRDC) provides river discharge data for all major rivers of the world. Using that database and other sources, Lammers et al. (2000) have put together a hydrological database for river runoffs into the Arctic Ocean. Spatially, their database covers the entire AOMIP-Grid domain and temporally spans most of the current century. The product is known as R-ArcticNET.
AWI
In an analogous fashion, Prange (2002) at the AWI has put together a data base of arctic river runoff. That database has been chosen for intial use in the AOMIP coordinated experiment.
Related Links
Composite Runoff Fields V1.0 (UNH/GRDC)
Global Runoff Data Center (GRDC, Koblenz-Berlin)
R-ArcticNET V2.0 (Univ. New Hampshire)
Total Runoff Integrating Pathways (TRIP, Univ. Tokyo)
Gauged Volume Flux
The annual gauged volume flux is 2456 km3 a-1. The spatial and temporal variation of this flux in units of m3 s-1 is given in a table. To convert the values in the table to units of km3 a-1 multiply by 0.0315.
| Index | River | Jan | Feb | Mar | Apr | May | Jun | Jul | Aug | Sep | Oct | Nov | Dec |
|---|---|---|---|---|---|---|---|---|---|---|---|---|---|
| 1 | Pechora | 959.400 | 773.800 | 695.400 | 950.200 | 15502.6 | 17126.4 | 5534.20 | 3227.80 | 3917.00 | 4197.60 | 1894.40 | 1277.40 |
| 2 | Ob + Pur | 4986.72 | 4120.23 | 3635.81 | 3697.96 | 15122.7 | 36715.9 | 31694.8 | 23122.7 | 14747.4 | 11000.7 | 6695.36 | 5734.18 |
| 3 | Yenisey | 6038.57 | 6022.93 | 5983.87 | 6001.32 | 27533.5 | 77386.6 | 26586.8 | 17485.4 | 16896.1 | 13969.2 | 6855.90 | 5839.77 |
| 4 | Olenek | 7.00000 | 3.20000 | 2.10000 | 1.65000 | 306.850 | 7160.00 | 2203.50 | 846.100 | 1050.45 | 308.900 | 78.7500 | 25.1000 |
| 5 | Yana | 2.47059 | 0.47058 | 0.00000 | 0.05882 | 424.059 | 4280.18 | 3058.59 | 2609.47 | 1583.18 | 242.412 | 54.1176 | 13.4118 |
| 6 | Indigirka | 36.3455 | 18.7636 | 11.4909 | 7.74545 | 301.255 | 5648.65 | 5418.40 | 4318.36 | 2600.09 | 528.564 | 132.818 | 72.2182 |
| 7 | Kolyma | 260.000 | 191.765 | 190.706 | 162.647 | 1739.24 | 13996.6 | 7527.12 | 6011.70 | 4804.71 | 1646.18 | 436.059 | 340.647 |
| 8 | Mackenzie | 3814.35 | 3605.90 | 3349.00 | 3384.45 | 13218.8 | 21413.0 | 17854.7 | 13984.2 | 11268.7 | 9038.15 | 4756.00 | 3595.00 |
| 9 | Sev. Dvina | 1033.45 | 826.596 | 724.880 | 2415.08 | 13839.4 | 7029.66 | 2943.84 | 2149.40 | 2320.42 | 2912.38 | 2362.98 | 1400.69 |
| 10 | Lena | 2783.04 | 2136.78 | 1651.78 | 1350.20 | 6235.90 | 73917.4 | 39683.4 | 27340.0 | 24126.0 | 13771.7 | 3502.06 | 2927.86 |
| 11 | Khatanga | 0.00000 | 0.00000 | 0.00000 | 0.00000 | 0.00000 | 13378.5 | 5766.38 | 3241.54 | 2825.38 | 0.00000 | 0.00000 | 0.00000 |
| 12 | Taimyra | 131.992 | 131.992 | 0.00000 | 0.00000 | 0.00000 | 1319.92 | 4883.71 | 3167.82 | 2243.87 | 1055.94 | 263.985 | 158.391 |
| 13 | Pyasina | 501.115 | 501.115 | 501.115 | 501.115 | 501.115 | 7516.72 | 10022.3 | 2818.77 | 3758.36 | 4071.56 | 1252.79 | 689.033 |
Ungauged Volume Flux
The annual ungauged volume flux is estimated at 700 km3 a-1. For AOMIP experiments, the ungauged river inflow is to be distributed among each of the thirteen major rivers in proportion to their gauged inflow. To incorporate the ungauged runoff into the gauged runoff we therefore multiply the gauged runoff by the factor 1.3 (i.e, 1 + 700/2456).
Total (Gauged + Ungauged) Volume Flux
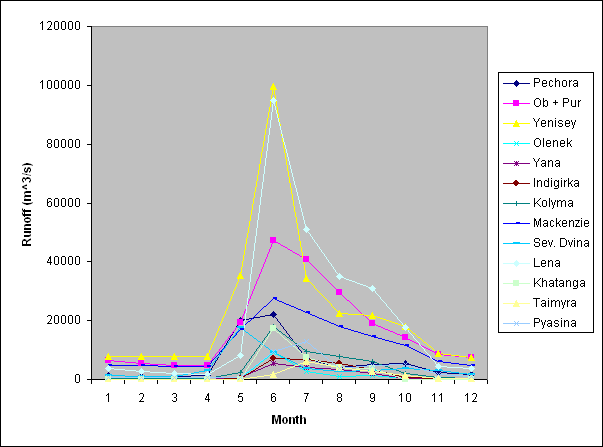
Using the above estimate of ungauged flow, the total (gauged + ungauged) volume flux is about 3200 km3 a-1, and is in good agreement with current estimates (Aagaard and Carmack, 1989). The spatial and temporal variation of this flux in units of m3 s-1 is given in a table and as a line chart.The total volume fluxes are to be inputted at the model grid box closest to the model's river mouth. Distributing the runoff at several model grid points, in the proximity of the mouth, is also acceptable practice.
| Index | River | Jan | Feb | Mar | Apr | May | Jun | Jul | Aug | Sep | Oct | Nov | Dec |
|---|---|---|---|---|---|---|---|---|---|---|---|---|---|
| 1 | Pechora | 1232.86 | 994.365 | 893.618 | 1221.04 | 19921.4 | 22008.1 | 7111.67 | 4147.85 | 5033.50 | 5394.09 | 2434.38 | 1641.51 |
| 2 | Ob + Pur | 6408.14 | 5294.66 | 4672.16 | 4752.03 | 19433.3 | 47181.4 | 40729.1 | 29713.6 | 18951.0 | 14136.3 | 8603.81 | 7368.66 |
| 3 | Yenisey | 7759.81 | 7739.71 | 7689.52 | 7711.94 | 35381.7 | 99445.0 | 34165.1 | 22469.4 | 21712.1 | 17951.0 | 8810.11 | 7504.35 |
| 4 | Olenek | 8.99529 | 4.11213 | 2.69858 | 2.12031 | 394.315 | 9200.90 | 2831.59 | 1087.27 | 1349.87 | 396.949 | 101.197 | 32.2545 |
| 5 | Yana | 3.17481 | 0.60471 | 0.00000 | 0.07558 | 544.933 | 5500.21 | 3930.41 | 3353.27 | 2034.45 | 311.509 | 69.5433 | 17.2347 |
| 6 | Indigirka | 46.7054 | 24.1120 | 14.7662 | 9.95322 | 387.125 | 7258.75 | 6962.87 | 5549.27 | 3341.22 | 679.226 | 170.676 | 92.8034 |
| 7 | Kolyma | 334.110 | 246.426 | 245.065 | 209.008 | 2234.99 | 17986.2 | 9672.66 | 7725.28 | 6174.25 | 2115.41 | 560.354 | 437.745 |
| 8 | Mackenzie | 4901.60 | 4633.73 | 4303.60 | 4349.16 | 16986.7 | 27516.6 | 22944.0 | 17970.2 | 14480.7 | 11614.4 | 6111.66 | 4619.72 |
| 9 | Sev. Dvina | 1328.02 | 1062.21 | 931.501 | 3103.47 | 17784.2 | 9033.40 | 3782.95 | 2762.06 | 2981.83 | 3742.53 | 3036.52 | 1799.95 |
| 10 | Lena | 3576.32 | 2745.85 | 2122.61 | 1735.06 | 8013.39 | 94986.9 | 50994.8 | 35133.0 | 31002.9 | 17697.3 | 4500.29 | 3762.42 |
| 11 | Khatanga | 0.00000 | 0.00000 | 0.00000 | 0.00000 | 0.00000 | 7191.93 | 7410.04 | 4165.51 | 3630.73 | 0.00000 | 0.00000 | 0.00000 |
| 12 | Taimyra | 169.615 | 169.615 | 0.00000 | 0.00000 | 0.00000 | 1696.15 | 6275.77 | 4070.78 | 2883.46 | 1356.92 | 339.231 | 203.539 |
| 13 | Pyasina | 643.953 | 643.953 | 643.953 | 643.953 | 643.953 | 9659.30 | 12879.0 | 3622.23 | 4829.65 | 5232.12 | 1609.88 | 885.436 |
River Mouth Locations
The location of river mouth in a model will depend on details of the arctic coastline as represented in that model. AOMIP modeling groups will each make their own decision about the exact placement of river mouths. The approximate locations of the river mouths may be taken from a map or a table.
| Index | River | Mouth Longitude | Mouth Latitude |
|---|---|---|---|
| 1 | Pechora | 052 E | 67 N |
| 2 | Ob + Pur | 066 E | 67 N |
| 3 | Yenisey | 088 E | 70 N |
| 4 | Olenek | 123 E | 72 N |
| 5 | Yana | 136 E | 71 N |
| 6 | Indigirka | 148 E | 70 N |
| 7 | Kolyma | 159 E | 69 N |
| 8 | Mackenzie | 135 W | 68 N |
| 9 | Sev. Dvina | 042 E | 65 N |
| 10 | Lena | 127 E | 73 N |
| 11 | Khatanga | 103 E | 72 N |
| 12 | Taimyra | 100 E | 76 N |
| 13 | Pyasina | 088 E | 72 N |

