Dispatch 14: Ice Station #1
Jennifer Kosty (Yale University)
October 1, 2026
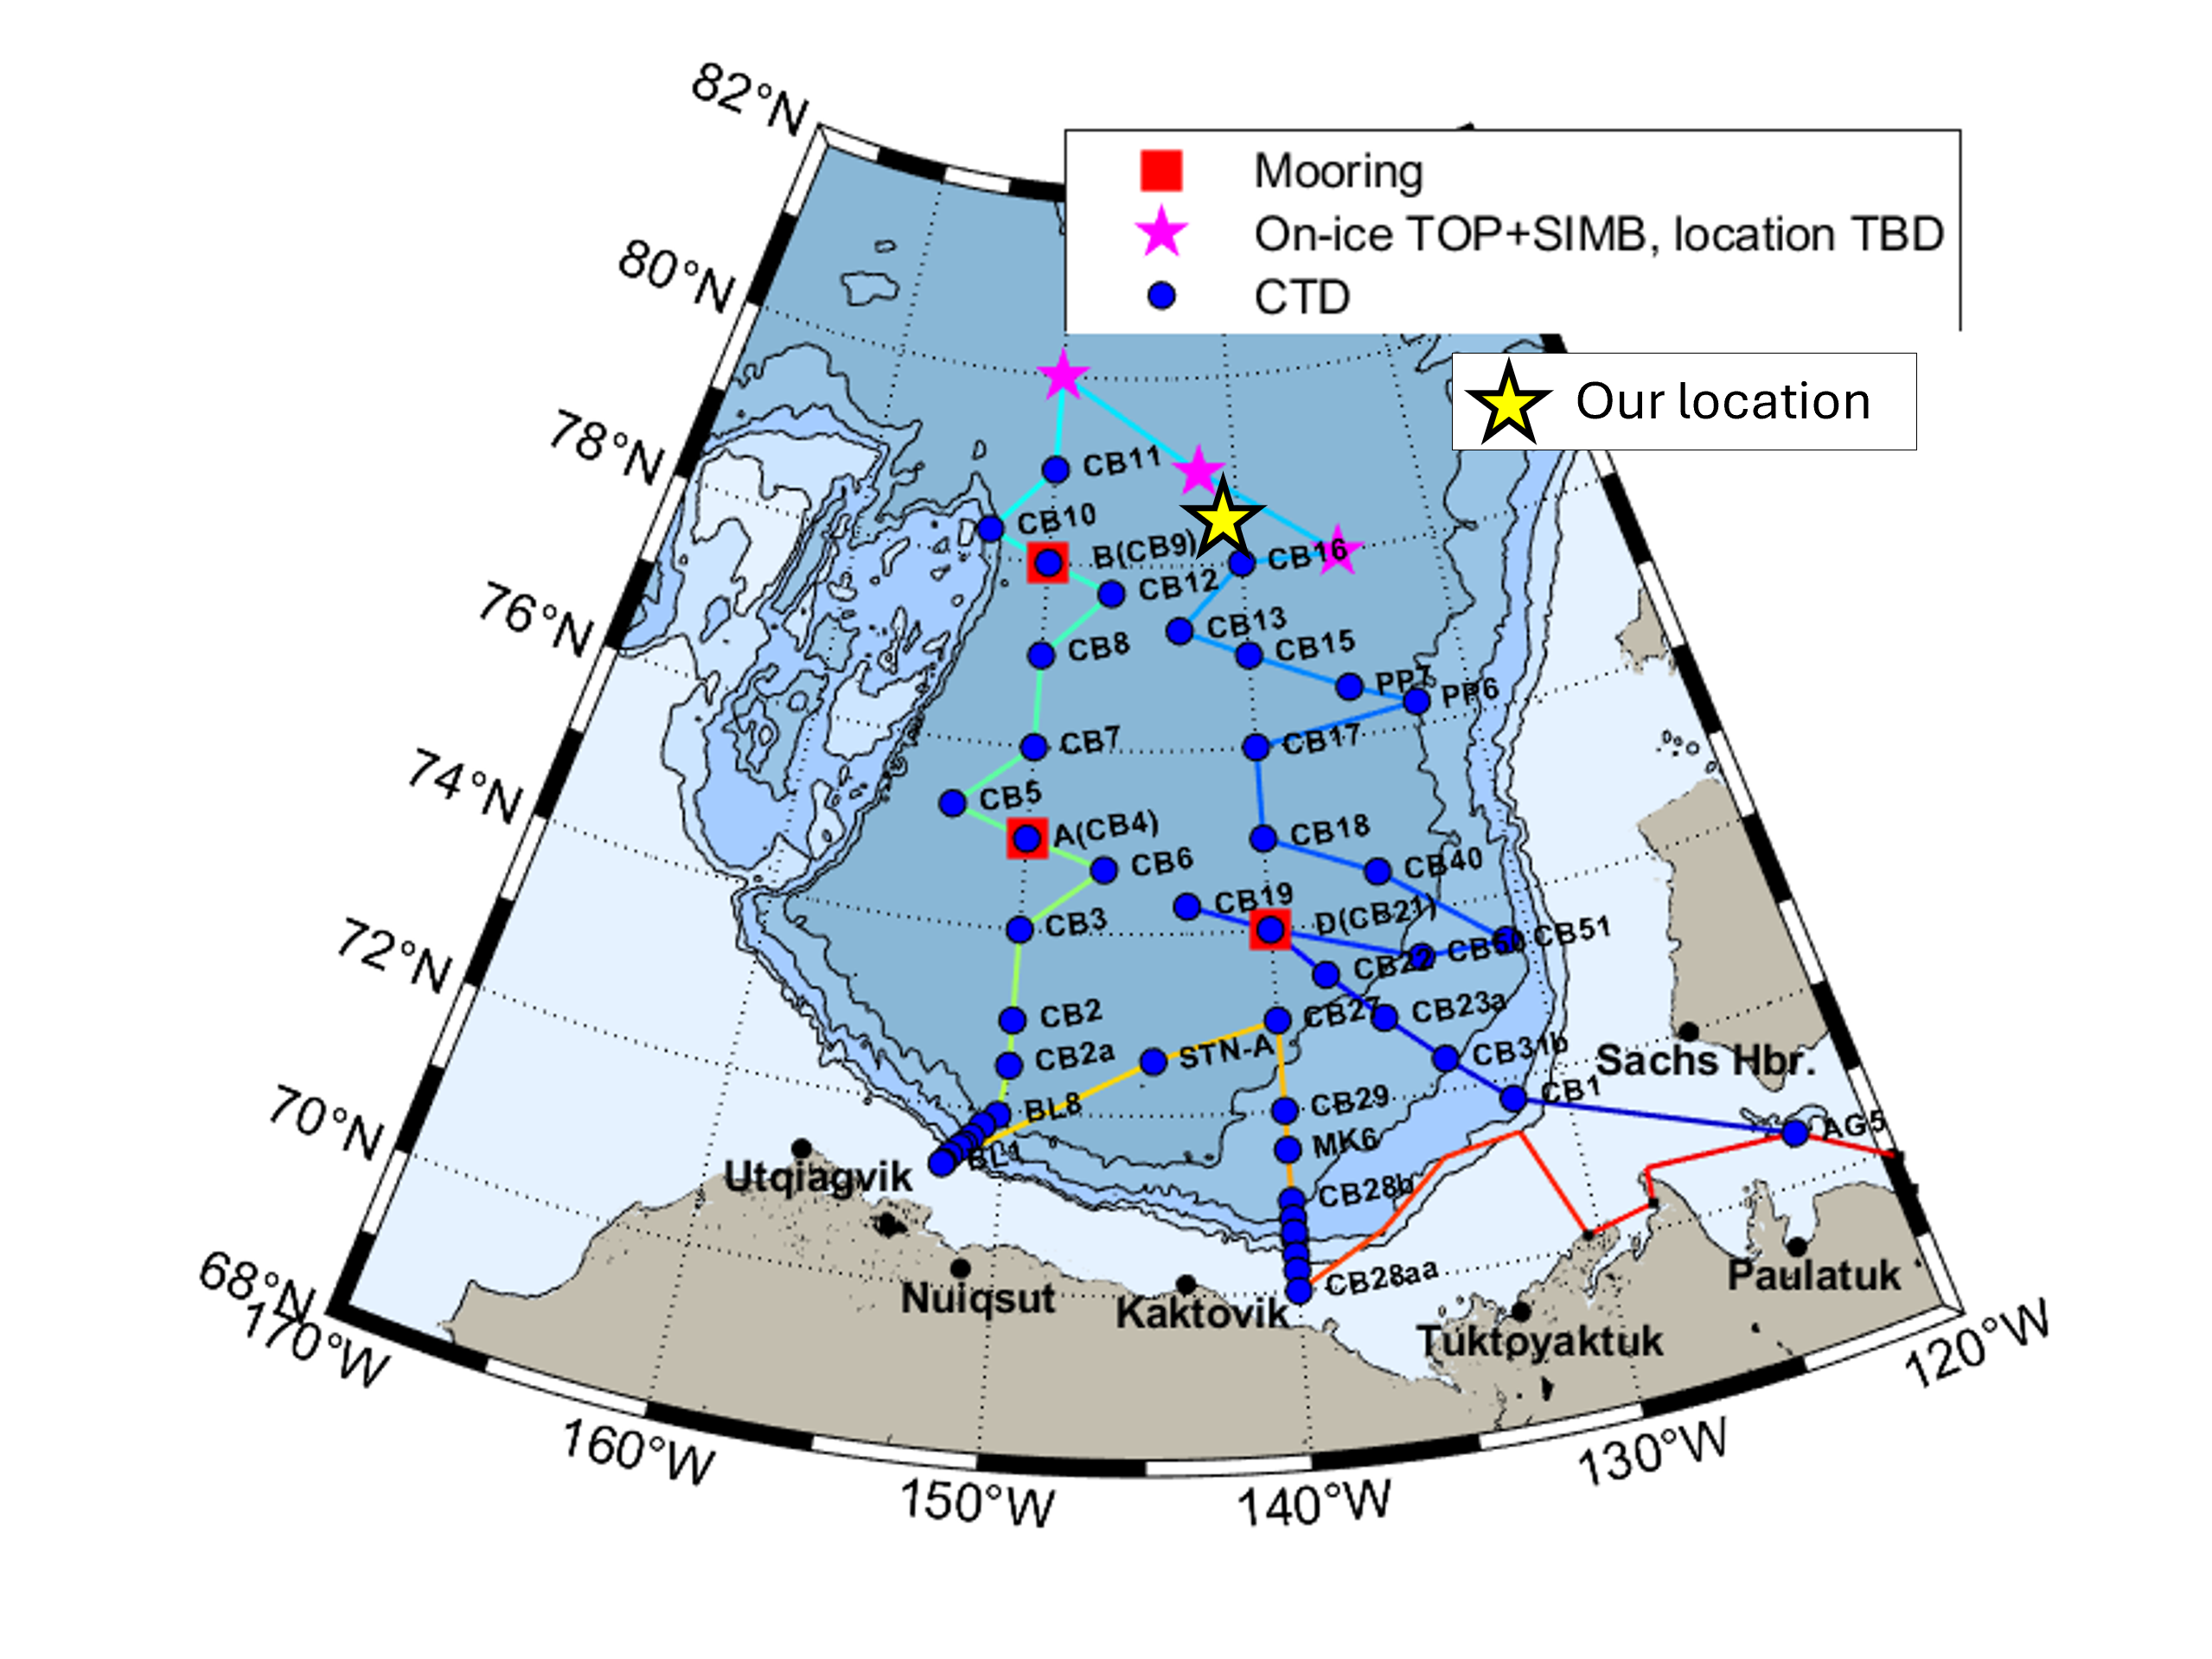
17:00 local, 78.39◦N, 141.26◦W
Conditions:
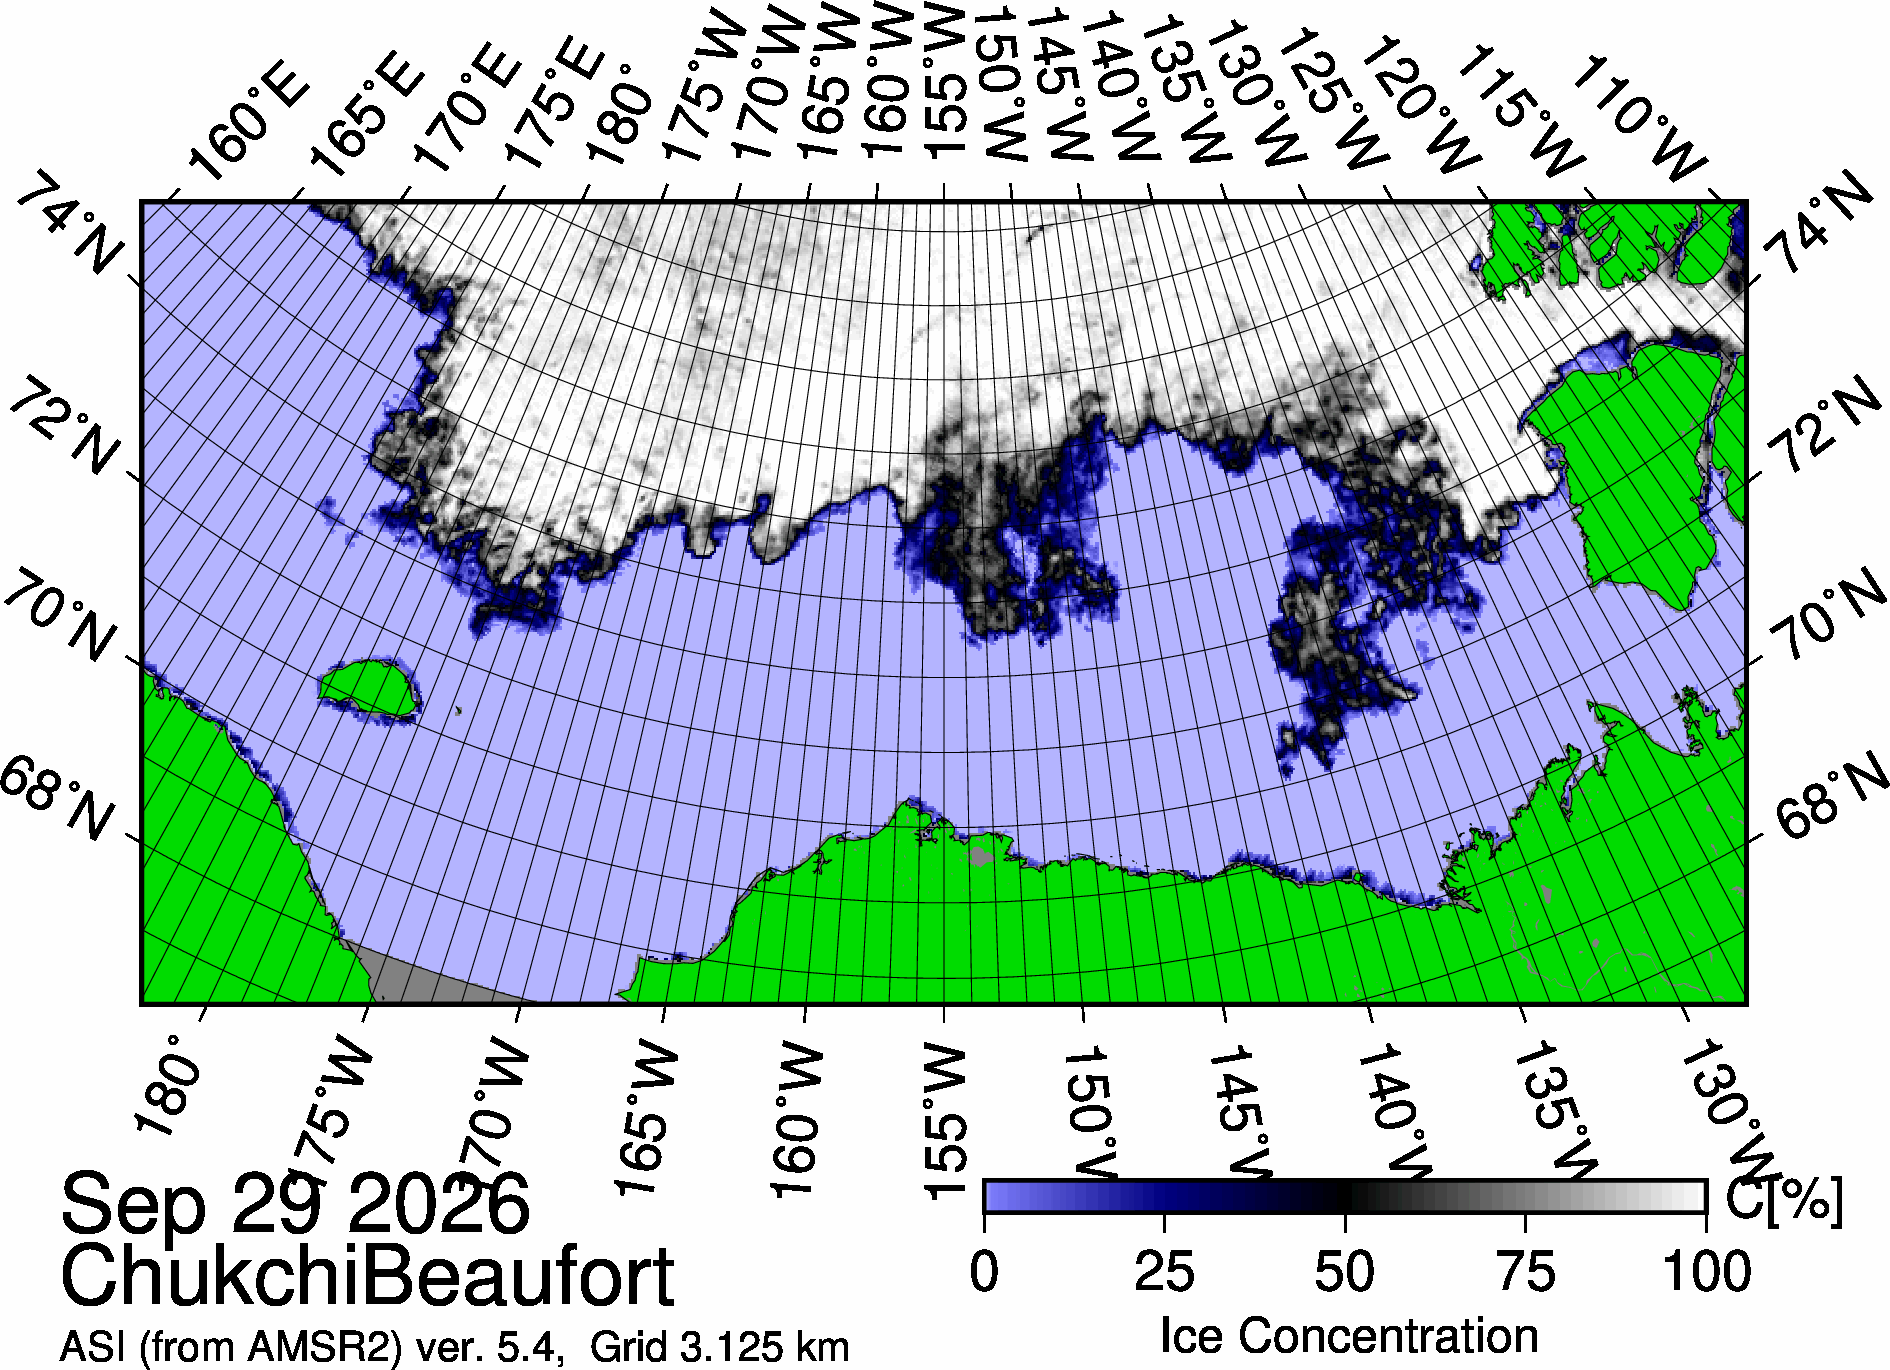
- 100% sea ice cover
- -13.6◦C
- Sunrise: 09:04 PDT (local)
- Sunset: 19:22 PDT (local)
- Day length: 10 hours, 18 minutes
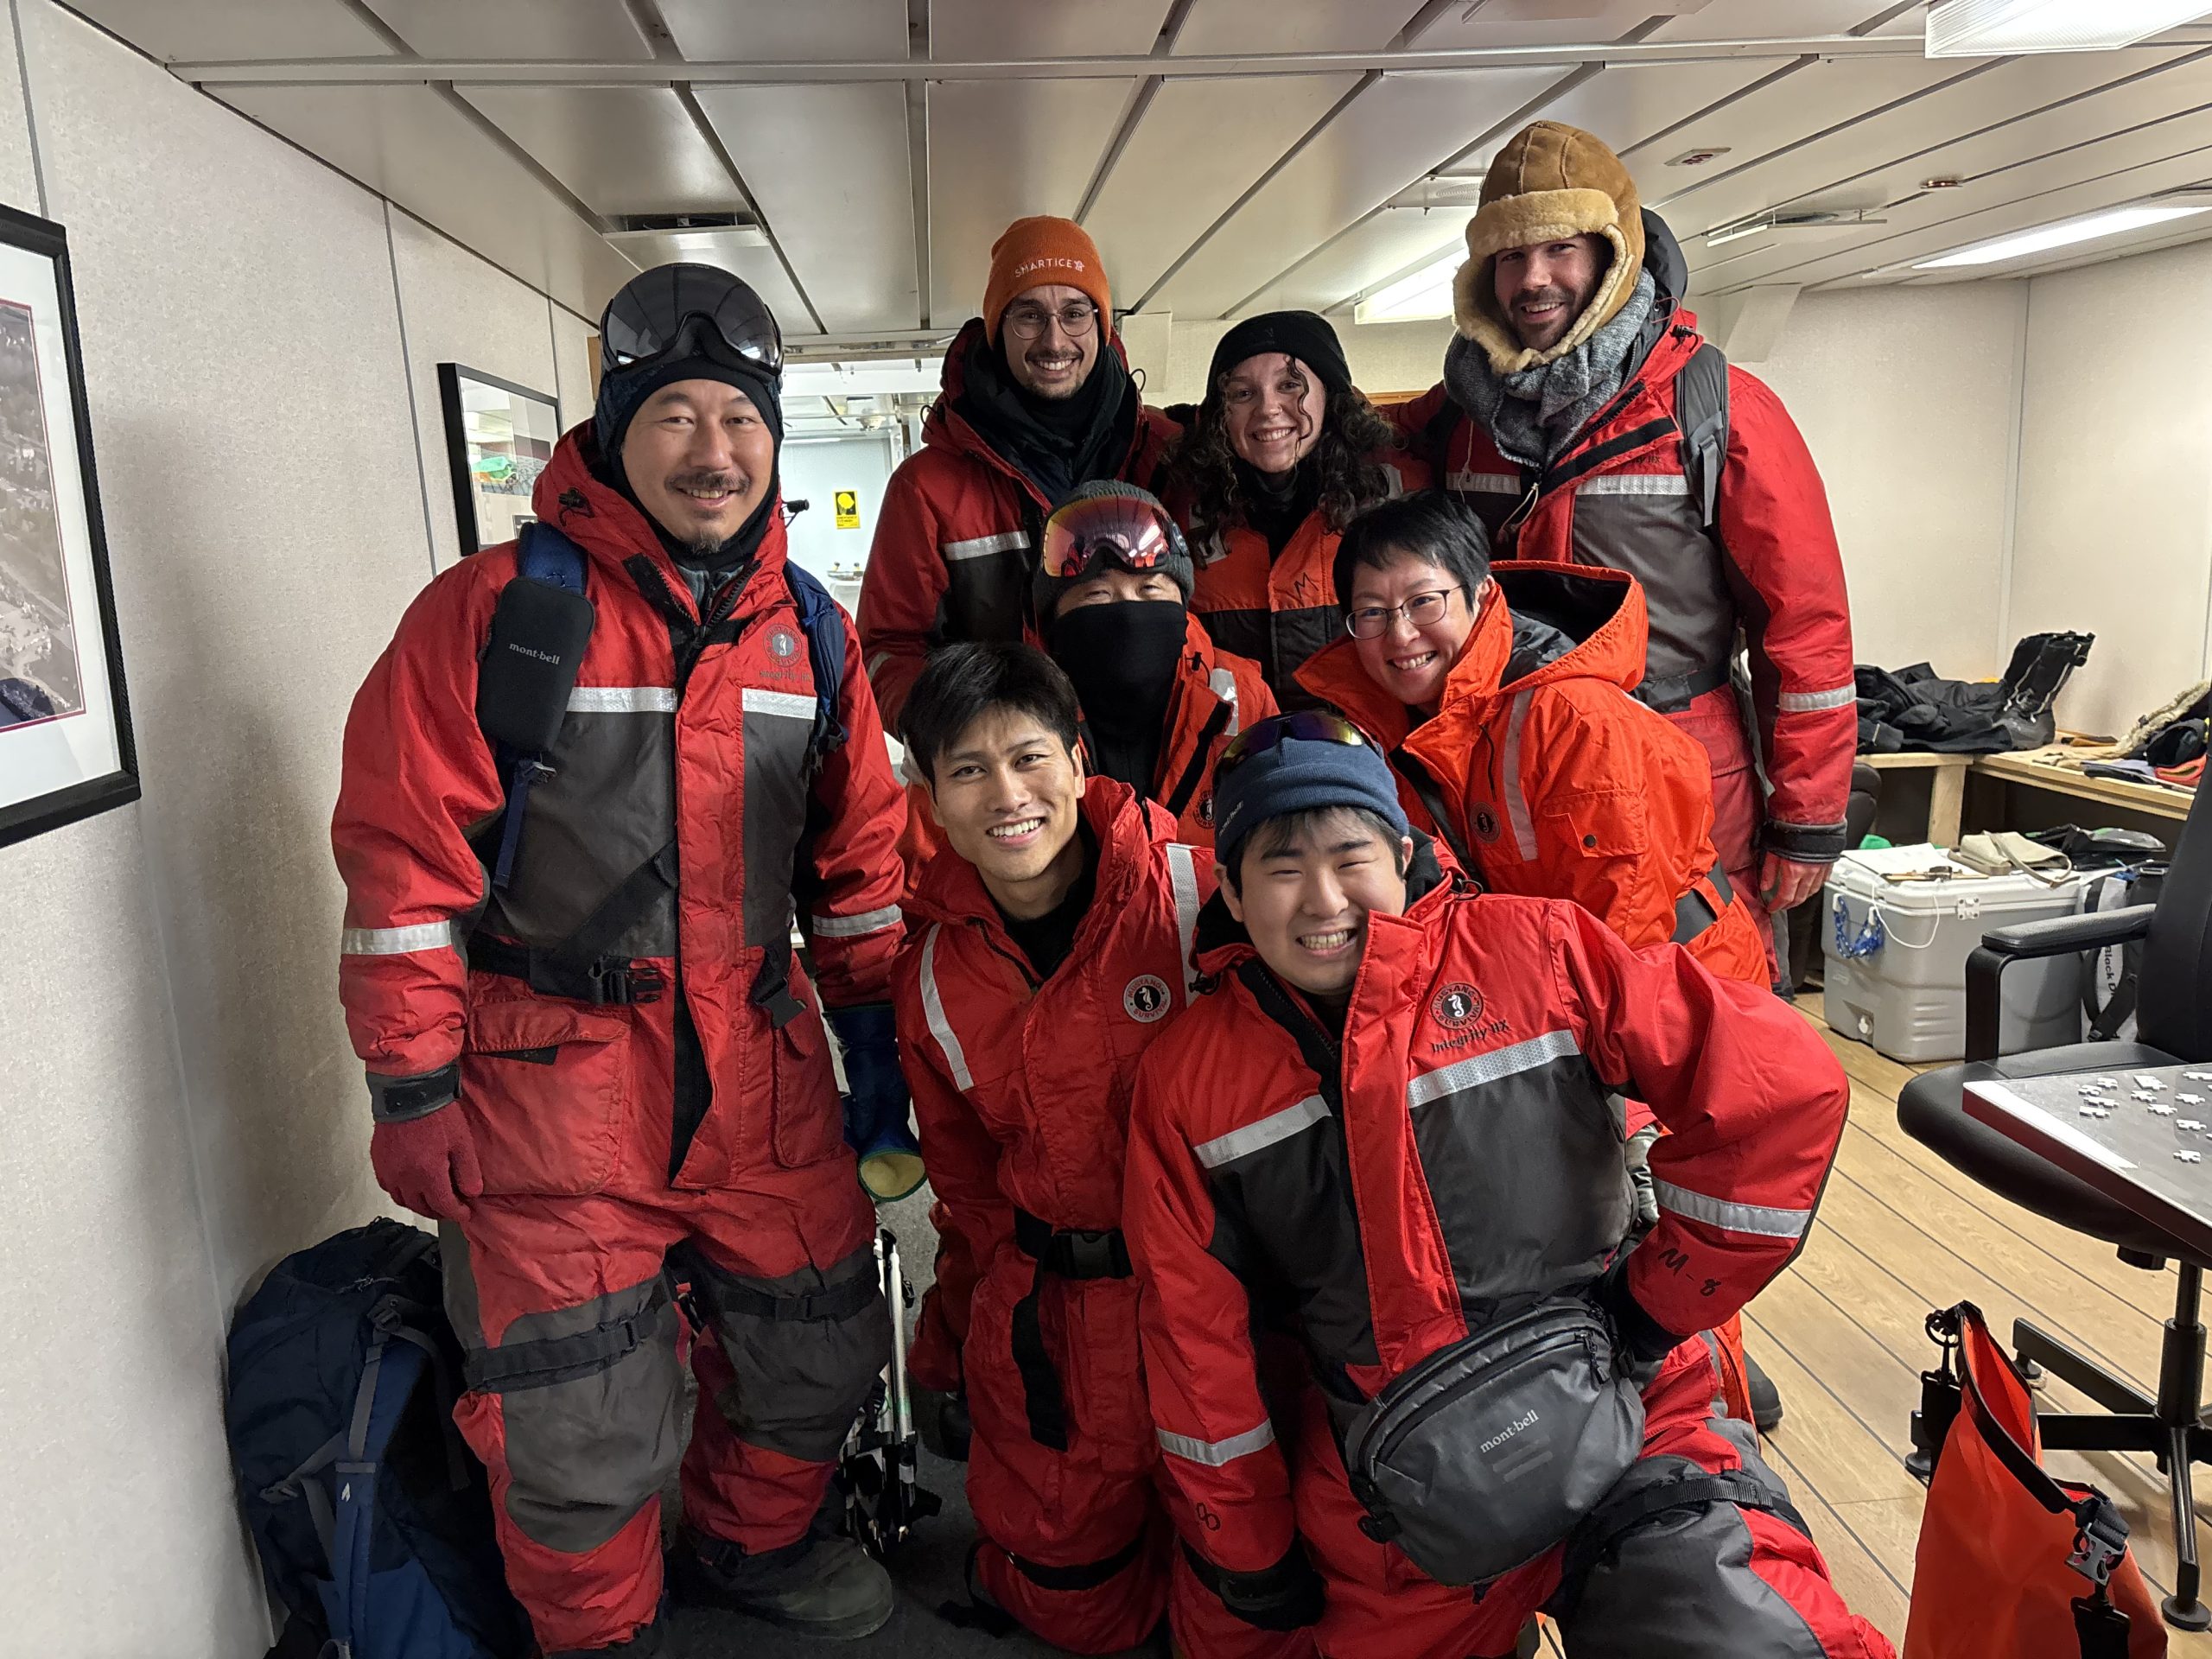
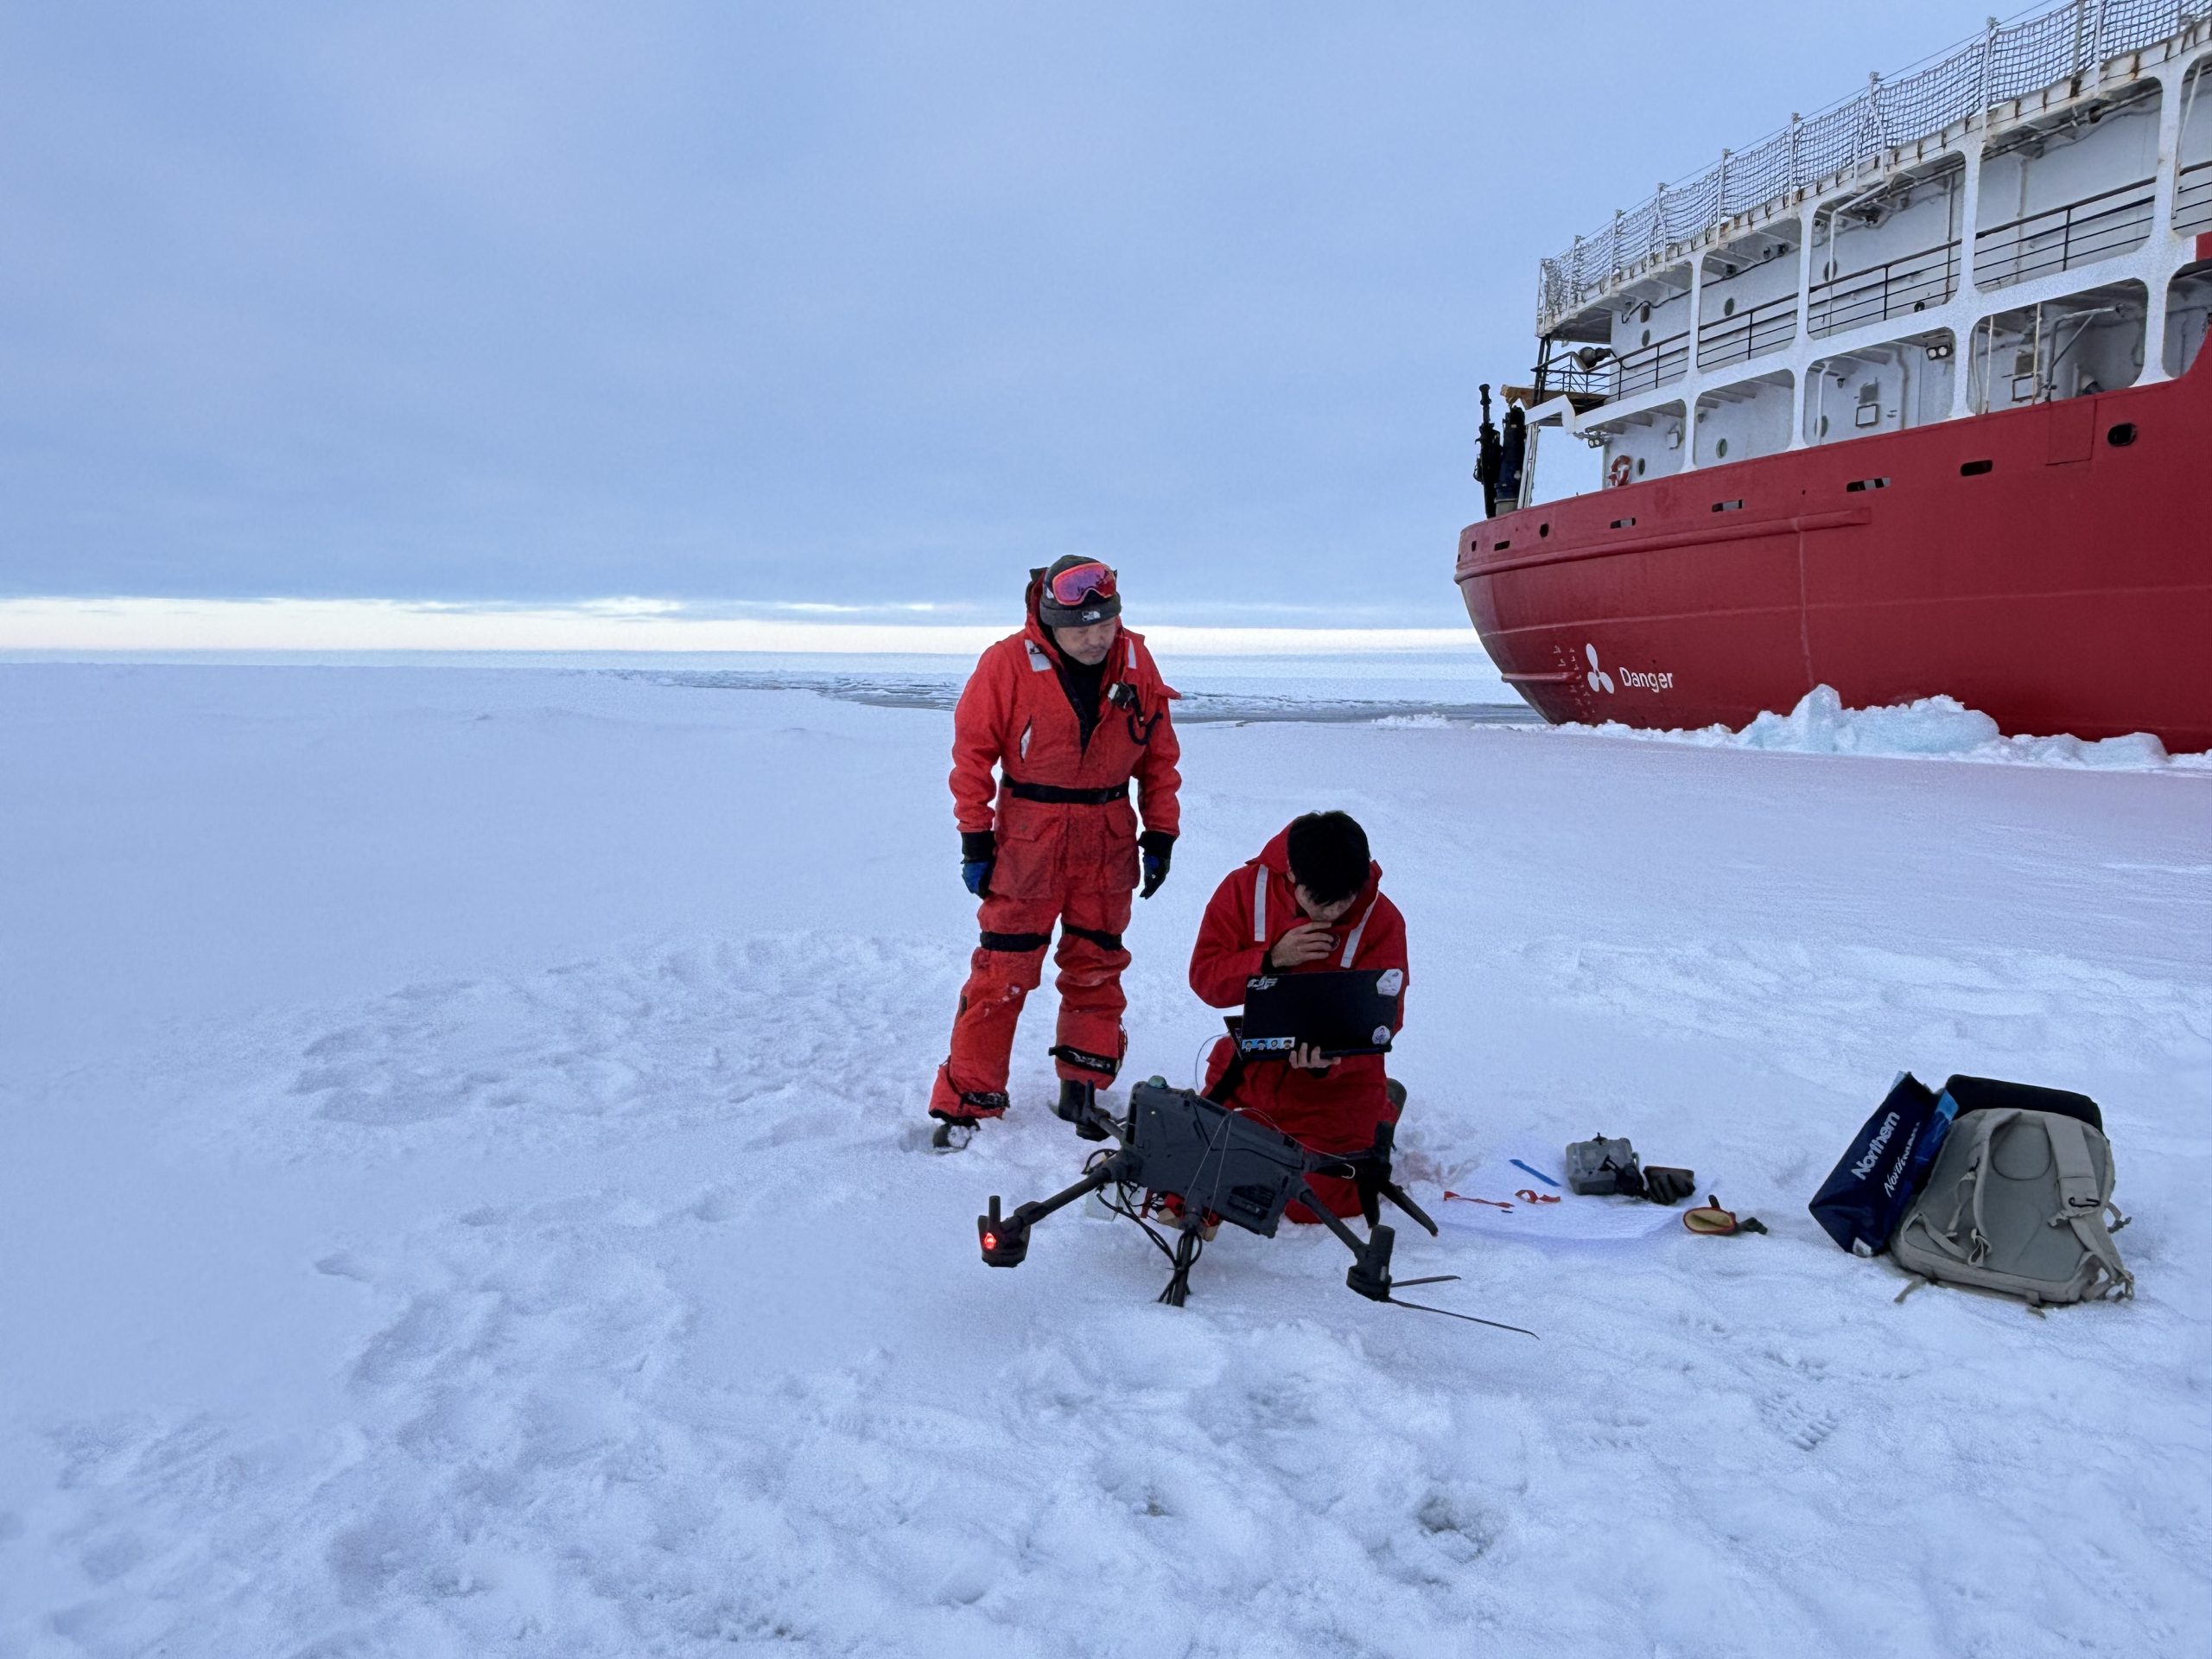
We completed our first ice station! Captain Duffett and the bridge crew positioned us within this large ice floe (14 km across!) late last night. We had visited one smaller ice floe earlier in the evening, but unfortunately, found that it was too thin. We went to bed hoping that this larger floe would be found suitable for our planned ice work.
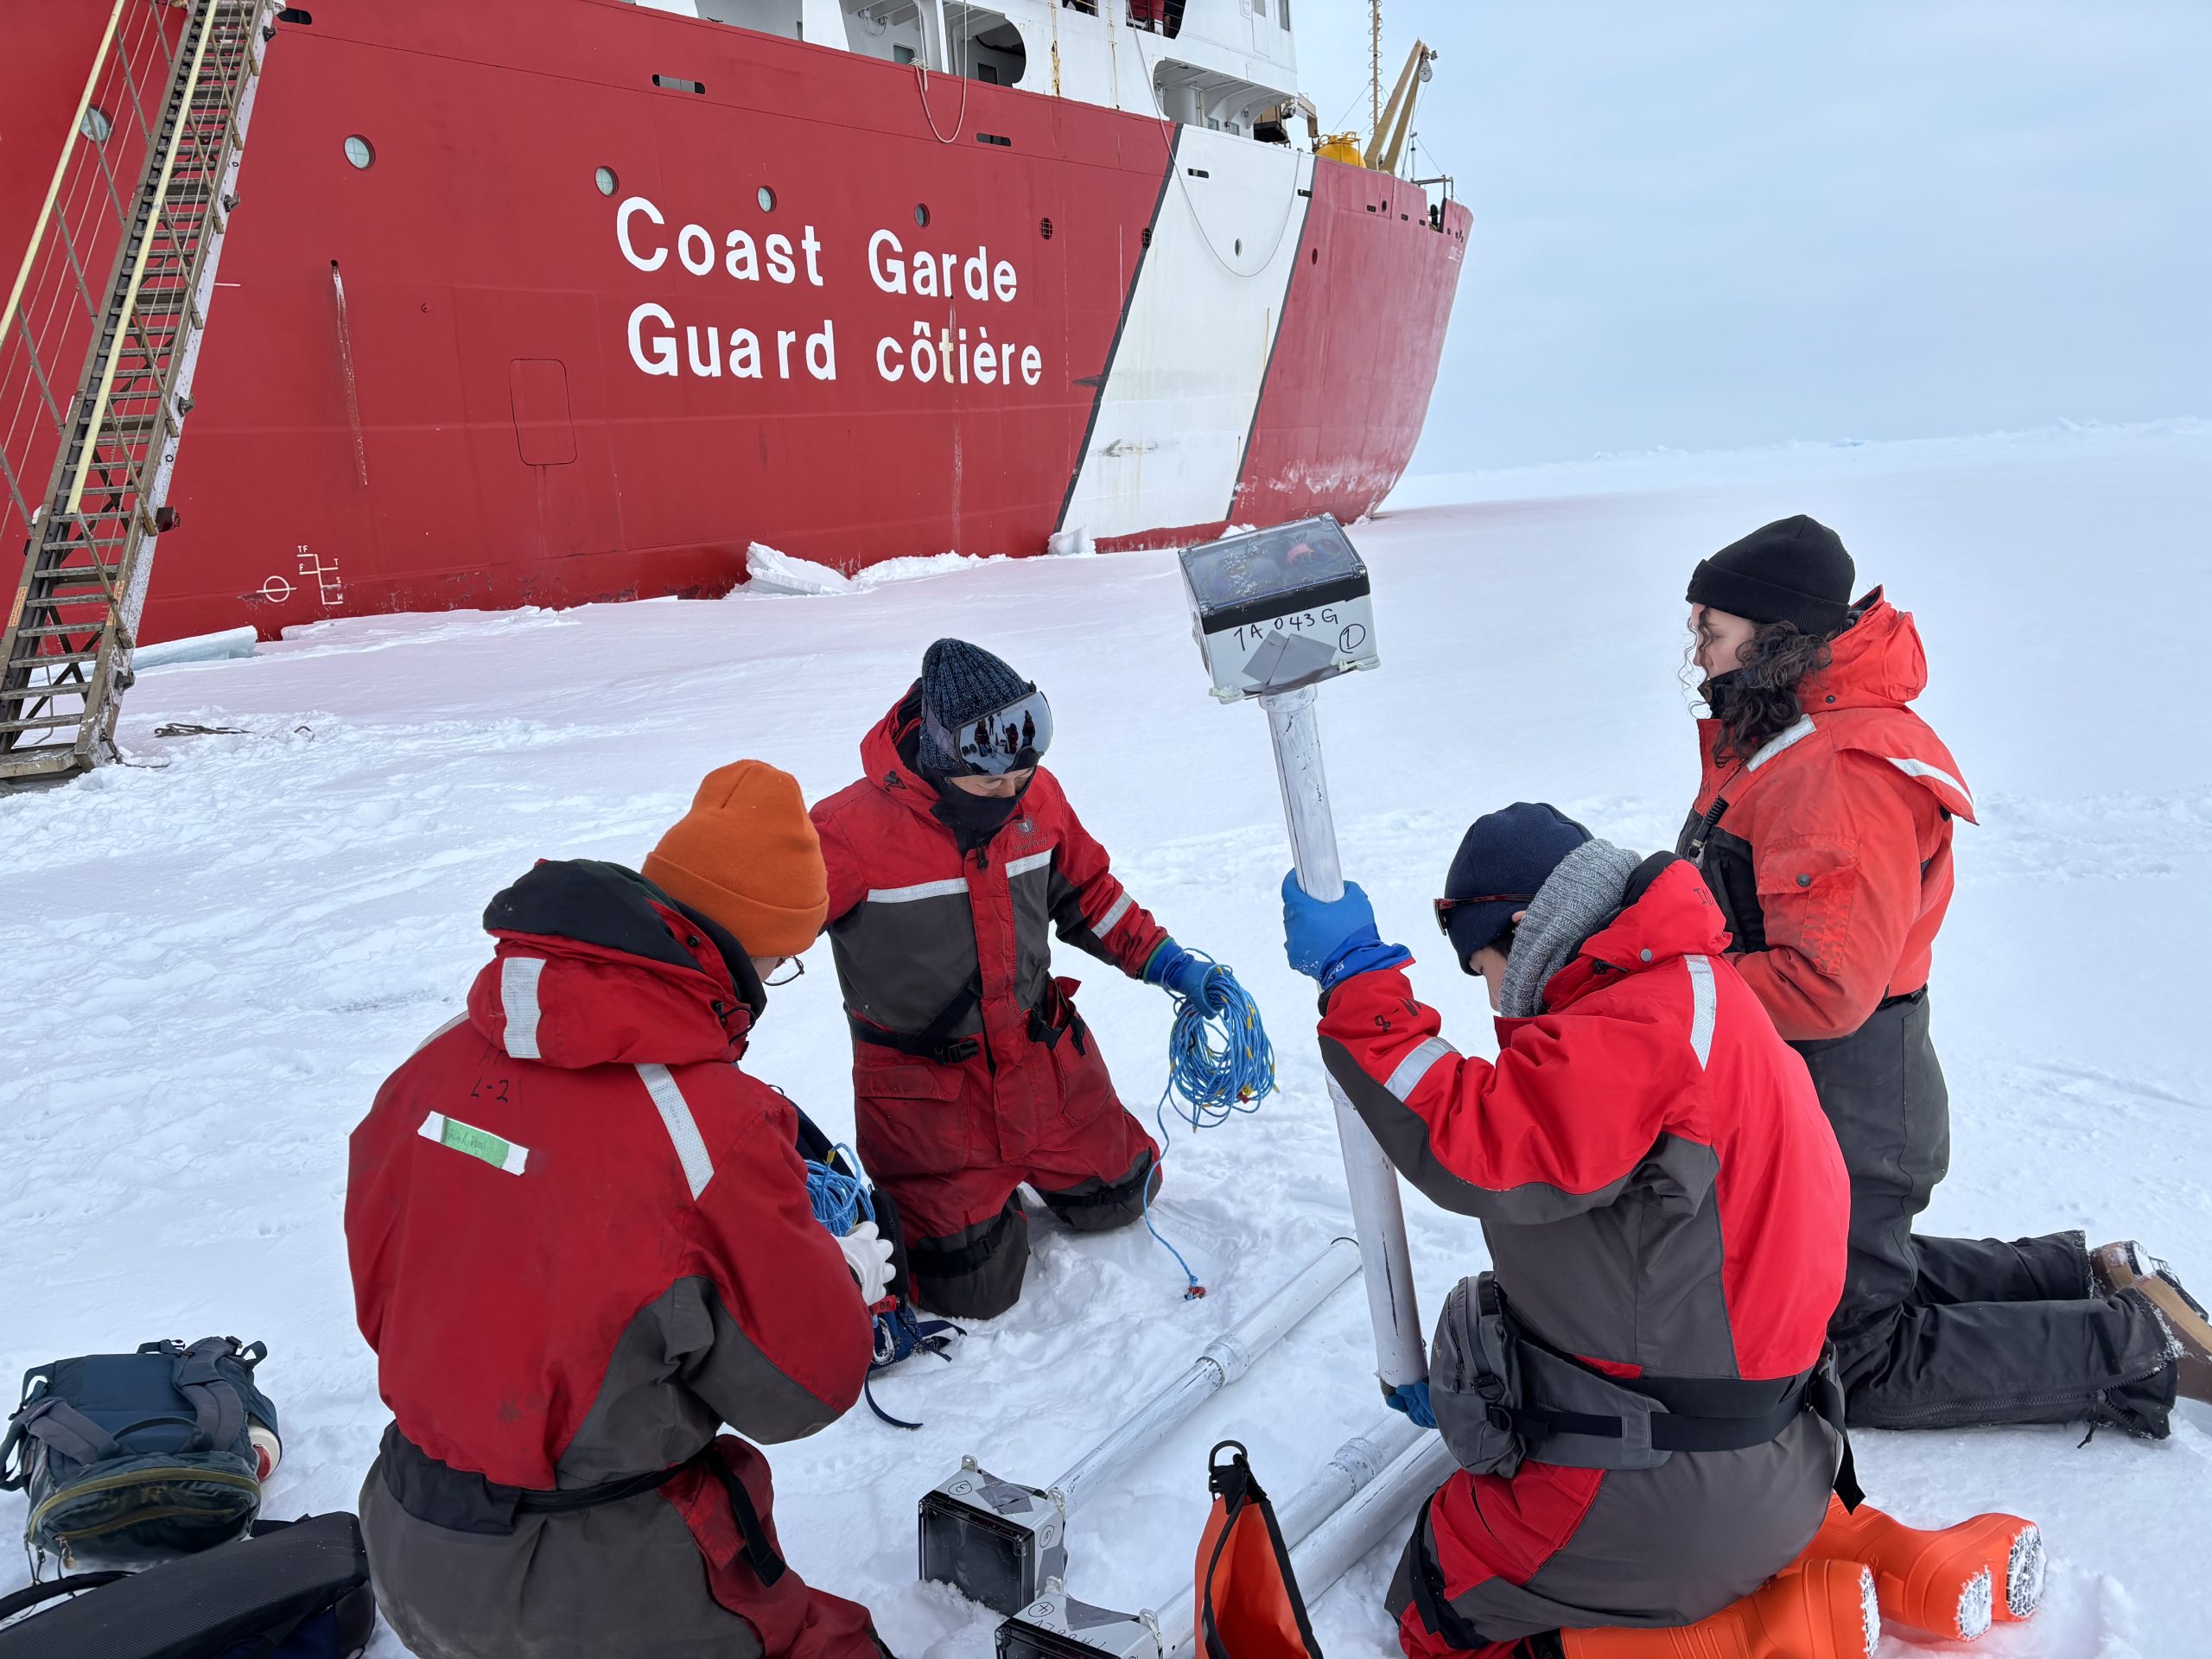
In the morning, we enjoyed a delicious breakfast of cinnamon apple pancakes, eggs, hashbrowns, and bacon. Around 9 am, WHOI engineers Jeff O’Brien and Chris Basque were lowered in the man basket to test the ice floe thickness. They found about 0.5 m worth of ice, which was deemed thick enough for us to proceed! The crew then lowered the gangway and used the ship’s crane to bring our equipment down to the ice.
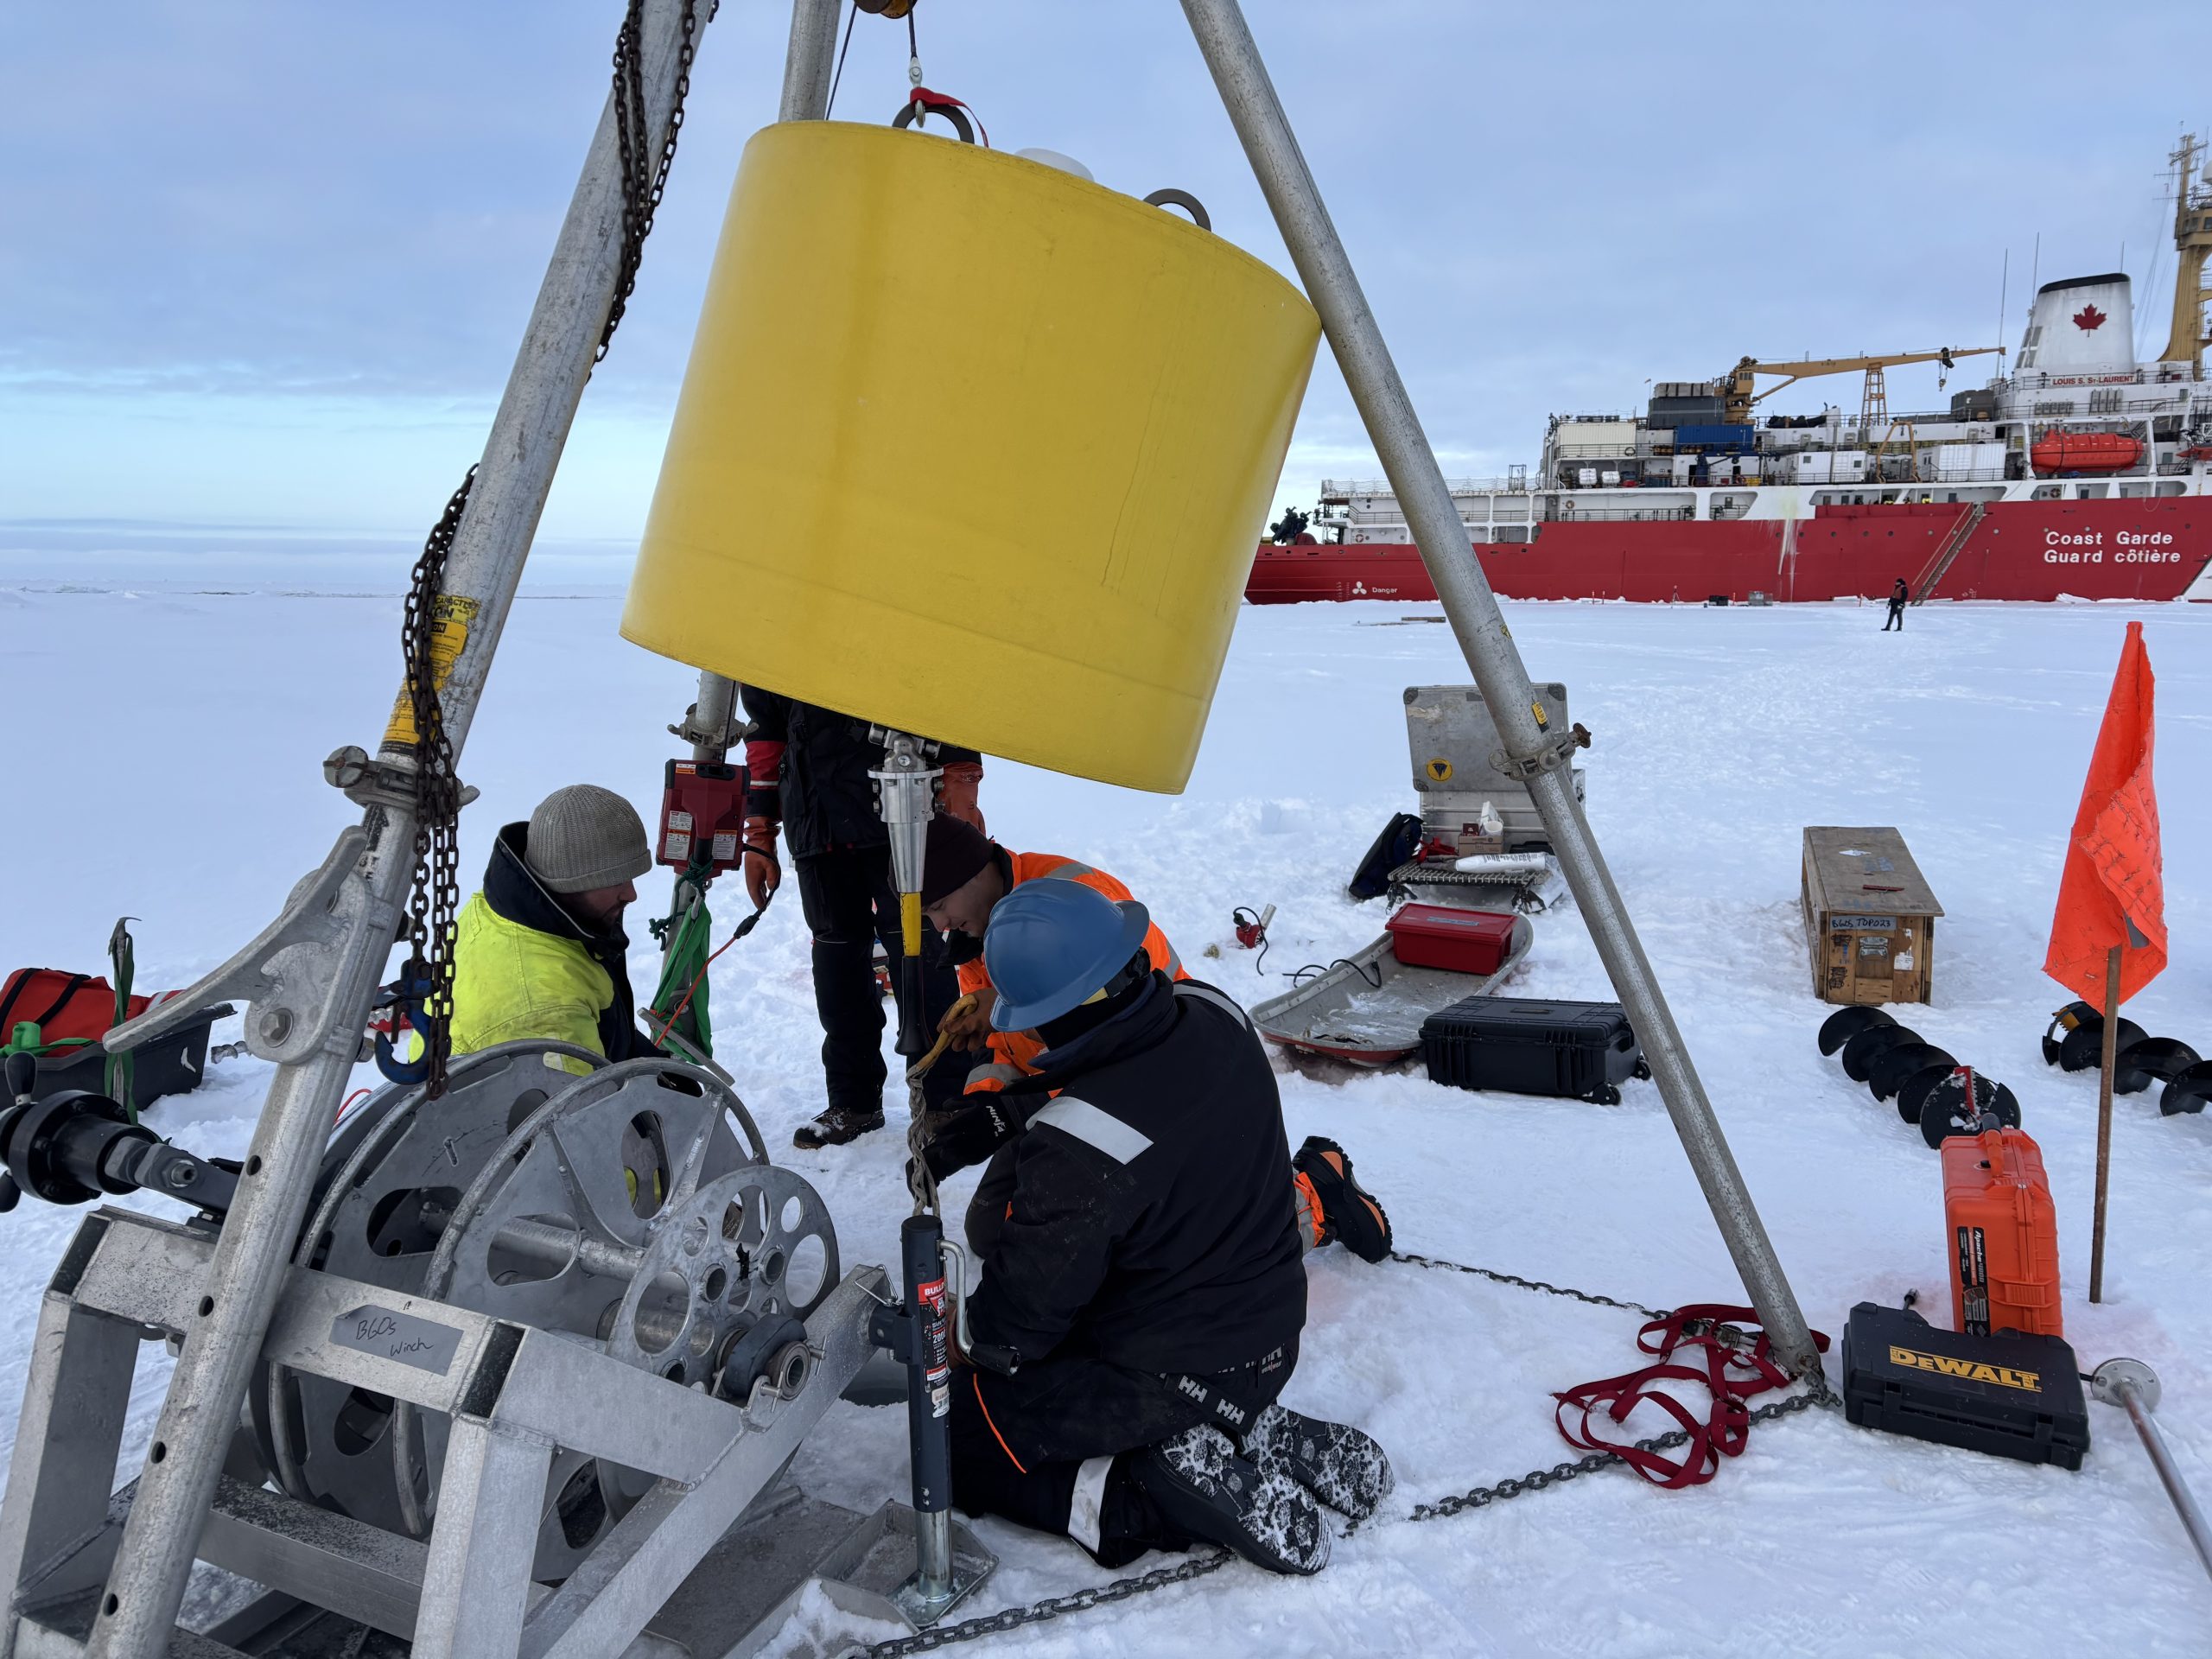
Our ice work was split into 3 main operations. The WHOI team deployed two buoys on this ice floe, including a tethered ocean profiler (TOP) and a seasonal ice mass balance buoy (SIMB). TOPs are designed to sample the upper 800 m of the water column as they drift throughout the ocean (either within the sea ice pack or in open water). The system includes a surface buoy and a profiling instrument that returns depth profiles of temperature and salinity (and sometimes ocean currents!) every day. The SIMB is a nice counterpart to the TOP system as it is designed to monitor sea ice pack conditions via measurements of snow accumulation, ice growth and melt, internal ice temperatures, and sea level pressure.
While the WHOI team was busy with their buoy deployments, Takuji Waseda and Koya Sato set up their wave sensor array, which consists of 3 instruments positioned 30 m apart to form an equilateral triangle and 1 instrument deployed in the center. Lastly, Kazu Tateyama and Hayate Kato conducted two ice transects, in which they collected measurements of snow depth and ice thickness. They also collected several ice core samples, which they used to obtain measurements of ice temperature, salinity, and density.
We wrapped up the ice operations around 4 pm and headed back to the Louis to warm up. We ended today celebrating our successful ice station with pizza night and pumpkin pie!