2003-2019 Beaufort Gyre Freshwater Content Analysis
Beaufort Gyre Observing system
By 2019, 17 years of observations, supported by NSF, Woods Hole Oceanographic Institution and the Department of Fisheries and Oceans, Canada, have been obtained in the Beaufort Gyre (BG) region. To date, over 160 peer-reviewed publications by authors from different countries and institutions have utilized BG Observing System (BGOS) data (publications list at https://www.whoi.edu/page.do?pid=66456). Some of the results suggest that the BG freshwater (FW) reservoir may be entering a period of freshwater release which would be expected from previous climatological behavior, however, it is unclear whether the Arctic climate has transitioned to a new regime where the freshwater will continue to accumulate and exceed anything observed in the past. To improve our understanding of climatically important FW accumulation and release processes, and to reduce uncertainties in climate predictions, it is essential that the BG freshwater reservoir continue to be measured in the future in the same uninterrupted manner and at the same sustained locations to investigate the fate of the BG FW anomaly under rapidly changing climate conditions.
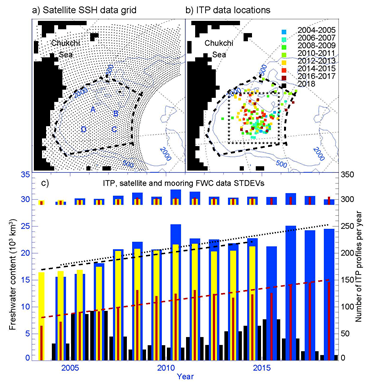
The BGOS (https://www2.whoi.edu/site/beaufortgyre/) was established in 2003 to investigate the major mechanisms of freshwater accumulation and release and arctic climate change (Figure 1). There are several type of observations conducted in the BG region.
Hydrographic surveys
Hydrographic surveys represent ship-based CTD measurements of water temperature (T) and salinity (S). They have been conducted in the Beaufort Gyre region each year between August-October (hereafter, annual hydrographic surveys) over about 25 days at standard locations (Figure 1) during BGOS cruises. These data are available at: https://www2.whoi.edu/site/beaufortgyre/, and NSF’s Arctic data center (https://arcticdata.io/). To this core dataset, other publically available hydrographic data in the region during summer have been added (e.g. NCEI World Ocean Database, https://www.nodc.noaa.gov/). The freshwater content at each hydrographic station has been calculated relative to a reference salinity of 34.8 and then optimally interpolated onto a 55.5 km grid (see Proshutinsky et al., 2009b for details of optimal interpolation method). The high-accuracy shipboard salinity measurements result in freshwater content uncertainties for individual profiles of less than 0.1 m. Interpolation errors for the hydrographic surveys are estimated to be between 0.1 m to 1.5 m depending on the number of observations and the distances between the grid points and the location of the observation sites (see Proshutinsky et al., 2009b for details).
Mooring data
Mooring data were acquired at three Beaufort Gyre locations (denoted A, B and C in Figure 1) during 2003, four locations (A, B, C, D) for the 2004-2008 period, and three sites (A, B, D) over 2009-2018. Three types of data from the moorings are utilized here: S profiles measured by McLane Moored Profilers (MMPs), sea ice draft measured by Upward Looking Sonars (ULSs), and bottom pressure measured by Bottom Pressure Recorders (BPRs). More details are available in Proshutinsky et al. (2019). Note: all references are available at https://www2.whoi.edu/site/beaufortgyre/background/pubs/.
Ice-Tethered Profiler measurements
Ice-Tethered Profilers provide additional information on freshwater content evolution. ITPs measure water conductivity (providing S), T and pressure from around 7 m to 750 m depth, with some variation depending on ice-drift speed and other factors (see Krishfield et al., 2008 for full system and data processing details). ITP data are available at http://www.whoi.edu/itp and at https://data.nodc.noaa.gov/cgi-bin/iso?id=gov.noaa.nodc:WHOI-ITP;view=html). ITP T and S profiles from a total of 43 systems were analyzed here (Figure 2). More details are available in Proshutinsky et al. (2019).
Remote sensing data
Gridded DOT (Dynamic Ocean Topography which is SSH measured by satellites relative to the geoid) data (Figure 2) provided by Armitage et al. (2016) (http://www.cpom.ucl.ac.uk/dynamic_topography/) are used to infer changes in freshwater content.
Ekman vertical velocities and external forcing
External driving factors accounted for in the present analysis include geostrophic wind stress, sea ice concentration and drift, oceanic geostrophic velocities, and derived Ekman vertical velocities, all calculated using established methods. Specifically, Ekman vertical velocities are determined following the methods of Meneghello et al. (2017, 2018) and are identical to the approach published by Regan et al. (2019). The geostrophic wind was calculated from NCAR/NCEP (reanalysis 1, Kalnay et al., 1996) 6-hourly sea level pressure (SLP) fields. Sea ice motion is taken from the Polar Pathfinder Daily 25 km EASE-Grid Sea Ice Motion Vectors, Version 4.1 (Tschudi et al., 2019). Note that errors in sea ice drift can result in substantial uncertainties in the estimates of Ekman vertical velocities derived from different satellite-based ice drift products (Sumata et al., 2014, 2015). The ice drift curl calculated from these products reveals that the ice motion curl in winter differs by 18% on average among the different products. Daily sea ice concentration for 2003-2018 is from Nimbus-7 SMMR and DMSP SSM/I-SSMIS Passive Microwave Data Version 1 (Cavalieri et al., 1996). The ocean geostrophic velocity fields are from Armitage et al. (2017). Meneghello et al. (2017, 2018), Zhong et al. (2018) and Dewey et al. (2018) reported that after 2003 these currents played a significant role in the dynamics of the Beaufort Gyre system. For 2015-2018, we use geostrophic velocities calculated from water T and S relative to a 400db level of no motion from the annual hydrographic surveys.
Freshwater content variability
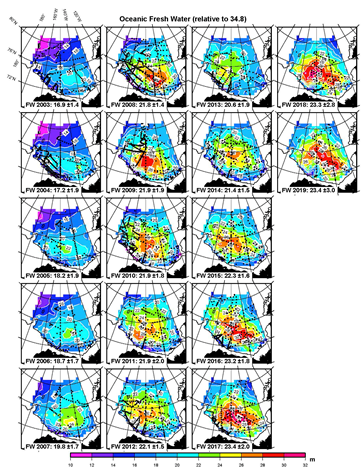
Based on the annual hydrographic surveys, the Beaufort Gyre region accumulated approximately 6,400 km3 of fresh water (relative to 34.8 reference salinity) during sixteen years between 2003 and 2019 (Proshutinsky et al., 2019). This represents a 40% increase of fresh water volume in the region relative to the climatology of the 1970s. While the average rate of fresh water accumulation was 397±116 km3a-1, the freshwater content growth was not uniform due to changes in wind, sea ice conditions and ocean geostrophic currents. The ocean circulation played a flywheel role regulating momentum transfer from wind to the ocean (moderated by sea ice conditions), effectively damping disturbances in external forcing and stabilizing freshwater content (e.g. Doodridge et al., 2019, Meneghello et al., 2017, 2018; Zhong et al., 2018; Dewey et al., 2018)
In 2003-2008, freshwater content measured in August-October increased by 4,900±1.550 km3, from 16,900±1,400 km3 in 2003 to 21,800±1,700km3 in 2008. Freshwater content then remained stable at around 22,000±1,900 km3 for 4 years. In 2013, freshwater content decreased by about 1,600±500 km3 almost to the volume observed in 2007. In 2014-2016, freshwater content again increased to reach a historic maximum of around 23,200±1,800 km3 in 2016. In 2017, 2018, and 2019 the freshwater content changed only modestly to 23,400±1,800km3, 23,300±2,800 km3 and 23,300±3,000 km3 (preliminary result), respectively (Figure 2). As these estimates are based on the annual hydrographic observations, they do not resolve the seasonal cycle.
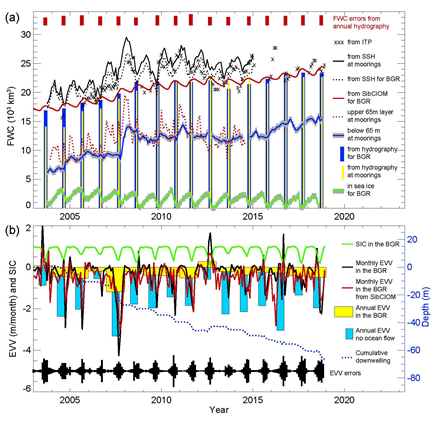
Annual mean freshwater content integrated over the Beaufort Gyre region derived from satellite-based data, ITPs, and MMPs (Figure 3) is in general agreement with the freshwater content volume in the region calculated from annual hydrographic survey data and the wind forcing (Figure 3). There are high correlations between the annual time series calculated from moorings, satellites and ITP data (Figure 3). Before computing the correlations, the time series were de-trended and first-differenced (following usual practice to remove autocorrelation in the time series, e.g. Emery & Thomson, 2004). For every correlation coefficient estimate, a statistical t-test was completed for the null hypothesis of 0 correlation (if p-value <0.05, the null hypothesis is rejected, confidence level is 0.1). All correlations were significant except for the satellite-based and ITP data time series, due to the ITP-based time series being too sparse in time and therefore too short in duration. The maximum correlation coefficient is 0.77 with confidence intervals [0.419; 0.918] between mooring and satellite-based annual freshwater contents and the minimum is 0.32 [-0.235; 0.712] between ITP and mooring data time-series. It is noteworthy that freshwater content inferred from the moorings and satellite data are highly correlated even though moorings do not sample the upper 65 m (i.e., the mixed layer and the top of the Pacific layer water column freshwater content).
The annual trend of freshwater content from the mooring data (534±152 km3a-1) agrees within uncertainty bounds with the trend obtained from the annual hydrographic surveys (not shown but discussed in Proshutinsky et al., 2019, preface paper). The linear trend of freshwater content derived from ITP data (455±232 km3a-1) also agrees within statistical uncertainty to the trends estimated from the mooring data and hydrographic surveys. The satellite inferred freshwater content trend (524±256 km3a-1) is very close to the trends of fresh water accumulation estimated from the ITP and hydrographic measurements.
Comparison of freshwater content derived from in-situ T and S hydrographic measurements with freshwater content from altimetry for those months that coincide with the hydrographic surveys reveals good correlation (0.80, [0.612; 0.950]) between these two time-series (Figure 3). Note that statistics and time-series of steric SSH are essentially the same whether GRACE or BPR data are used to convert altimetric DOT to steric SSH change.
Based on these results, it is postulated that over the 2003-2018 (we have not processed 2019 mooring data yet) period mooring-based estimates of freshwater content changes accurately characterize the accumulation of fresh water in the region, but we admit that there is not enough information about freshwater content in the upper 65 m, and that the ITP regionally-averaged data have significant uncertainties discussed above. The second important conclusion from this analysis is that the rate of fresh water accumulation below 65 m depth is in agreement with the rate of freshwater content for the entire water column.
Summary and conclusions
The data from BGOS moorings and ITPs were jointly analyzed with freshwater content estimates from annual hydrographic surveys, and data inferred from remote sensing. It is demonstrated the relative strengths and weakness of the different datasets for measuring Beaufort Gyre freshwater content:
The most accurate measure of local freshwater content is the August/September/October BGOS CTD casts, but while they capture interannual variability well over the long-term, they are only a monthly snapshot and do not resolve month-to-month or seasonal variability, and are limited in their spatial coverage.
- The BGEP moorings, on the other hand, offer year-round measurements over a long period, but they are only available at 3 or 4 locations and only capture freshwater content variability below 65m depth.
- ITPs offer 6-750 m measurements almost completely through the fresh water layer, but have irregular spatial and temporal sampling.
- Freshwater content derived from satellite SSH estimates offers the best spatial and temporal coverage, but rely on relatively uncertain empirical relationships between SSH and freshwater content, and they only represent an integrated measure of freshwater content, with no information about its vertical distribution in the water column.
Despite significant uncertainties in the different data sets, it is shown the synergistic value of having multiple diverse observations to obtain a comprehensive understanding of Beaufort Gyre freshwater content variability. BGOS surveys clearly show the interannual increase in freshwater content, but without satellite or ITP measurements it would not be possible to resolve the seasonal cycle of freshwater content, which is larger than the year-to-year variability.
There are two major factors influencing rates of freshwater accumulation and release in the Beaufort Gyre region, namely: wind-driven Ekman transport convergence and the availability of fresh water for accumulation. Ekman transport convergence and freshwater content changes due to sea ice seasonal transformations from growth to melt are analyzed. While these major factors and processes have been known and discussed in many publications starting from Proshutinsky et al. (2002) and the many subsequent works by others cited above, here, the role of these factors is evaluated not only qualitatively but quantitatively and illustrated by observational evidence from different data sources. The major result of this analysis is that the seasonal changes of Beaufort Gyre region freshwater content are mainly dominated by sea ice melting and growth while net annual fresh water accumulation and release is driven by changes of Ekman transport modified by sea ice conditions and the sense and intensity of the ocean geostrophic circulation. Based on annual hydrographic surveys, the Beaufort Gyre region accumulated approximately 6,400 km3 of fresh water (relative to 34.8 reference salinity) over a sixteen year period. This represents a 40% increase of fresh water volume in the region relative to the climatology of the 1970s. While the average rate of fresh water accumulation was 397±116 km3a-1, the freshwater content growth was not uniform due to interannual changes in the wind, sea ice conditions and ocean geostrophic currents. The ocean circulation played a flywheel role regulating momentum transfer from the wind into the ocean (regulated by sea ice conditions), effectively damping disturbances in external forcing and stabilizing freshwater content changes.
In 2003-2008, freshwater content measured in August-September increased by 4,900±1.550 km3, from 16,900±1,400 km3 in 2003 to 21,800±1,700km3 in 2008, mainly due to anomalous Ekman pumping under strong anticyclonic winds and reduced sea ice cover. Freshwater content stabilized around 22,000±1,900 km3 for a 4 year period under consistent wind forcing and more or less stable sea ice conditions. In 2013, freshwater content decreased by about 1,600±500 km3 to almost the volume observed in 2007. After 2013, the changes of freshwater content were mostly regulated by interplay among strength of Ekman transport convergence, sea ice conditions and intensity of geostrophic ocean circulation. In 2014-2016, freshwater content again increased to reach a record maximum of around 23,200±1,800 km3 in 2016 due to intensification of anticyclonic winds and some reduction of sea ice cover. In 2017, 2018 and 2019, the freshwater content changed only modestly to 23,400±1,800km3, 23,300±2,800 and 23,400±3,000 km3 (preliminary estimate), respectively due to small changes in prevailing winds, ocean currents and sea ice cover. While we have not analyzed processes and mechanisms of freshwater accumulation and release in the region due to eddies and mixing, recent studies suggest that eddy fluxes can balance wind-driven momentum flux into the Beaufort Gyre and limit fresh water accumulation (e.g., Manucharyan and Spall, 2016; Meneghello et al., 2017).


