Skip to content

BG Freshwater Content (FWC) reaches absolute maximum in 2015

Beaufort Gyre Observations

Knowledge of environmental changes in the Beaufort Gyre (BG) region of the Arctic Ocean and their consequences advances our understanding of mechanisms and the historical variability of the Arctic climate and makes possible predictions of future climate change scenarios. By 2015, thirteen years of observations, supported by the national Science Foundation, Woods Hole Oceanographic Institution and the Department of Fisheries and Oceans, Canada, have been obtained in the BG region. Hydrographic surveys of the BG region, year-round mooring observations and data from Ice-Tethered profilers are used to analyze the freshwater content, driving forces, sources and sinks of fresh water in the region (Figure 1).

Interannual variability

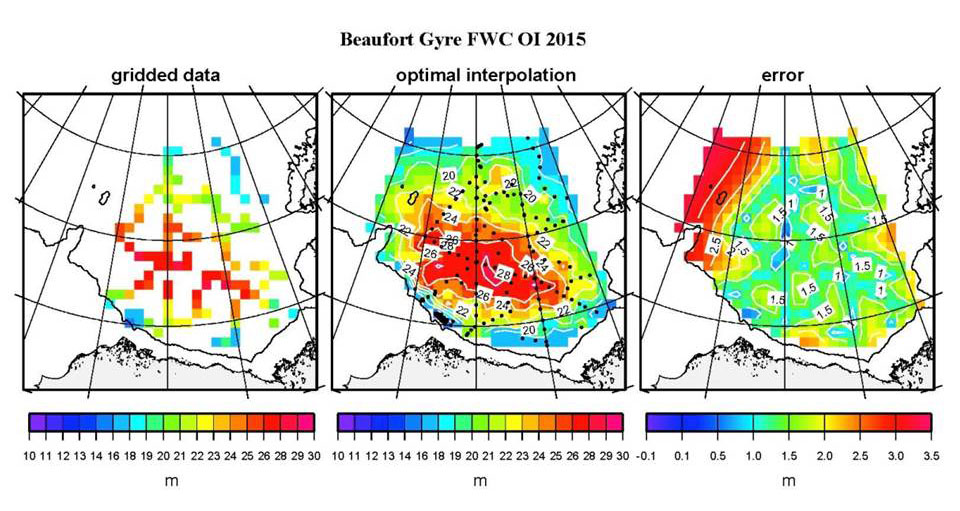
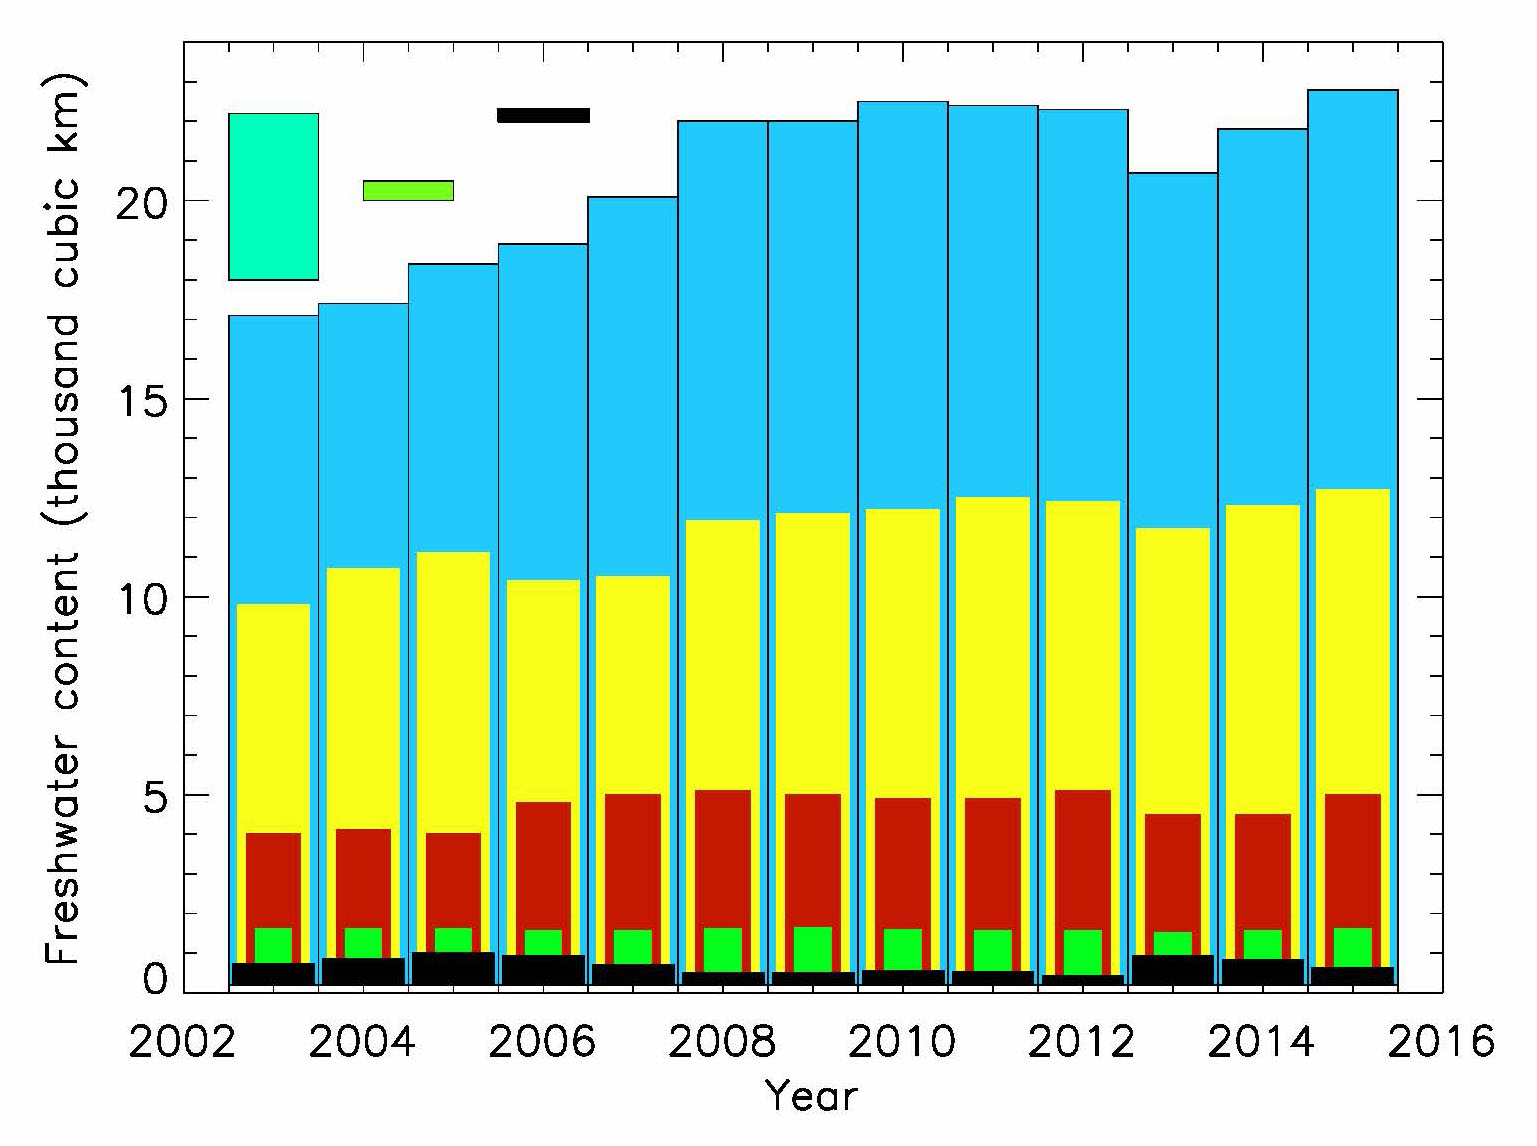
The liquid freshwater content in summer increased 5410 km3 from 2003 to 2010, decreased a bit in 2011-2014, but in 2015 reached its absolute maximum of 22,600 km3 or 5600 km3 over climatology (Figure 2 and 3).
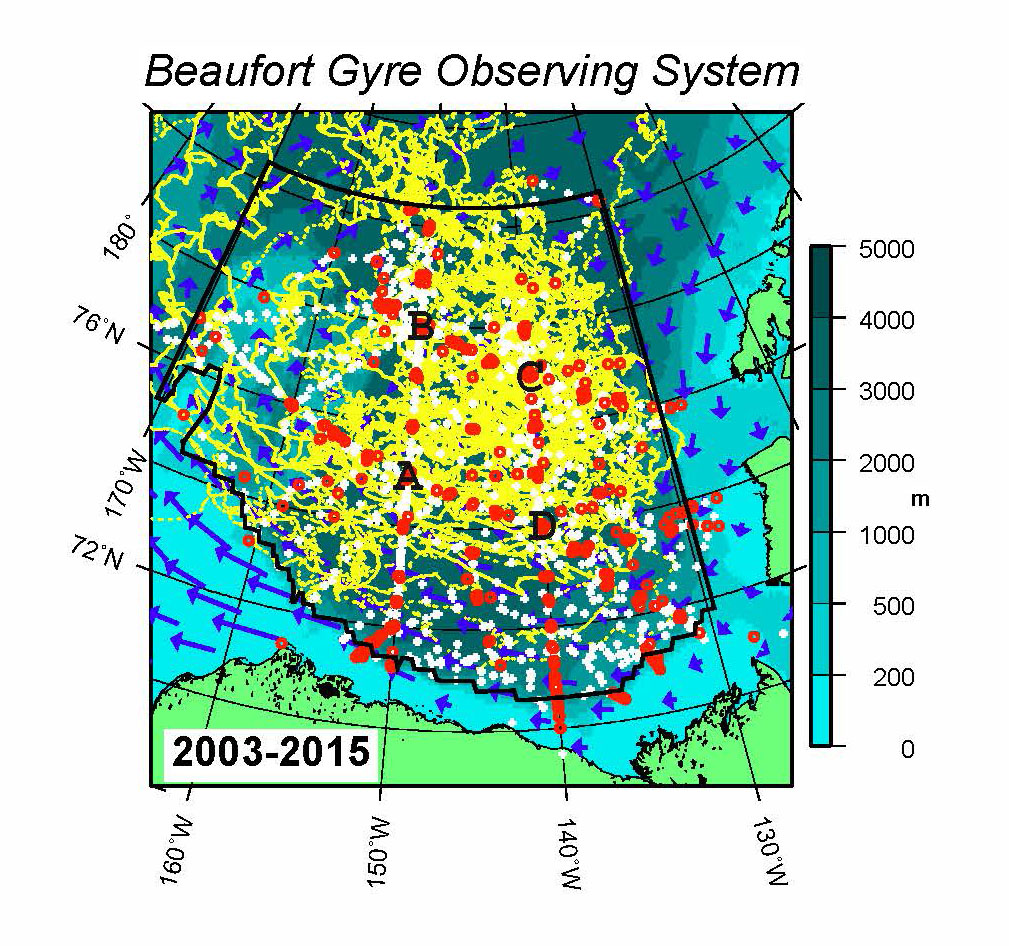
Figure 1 Observational coverage of the BG region by CTD (782 profiles; large red circles), XCTD (919 profiles; white crosses), ITP trajectories (yellow lines showing 37 ITPs) and moorings (A, B, C, D) in 2003-2015. Black line bounds eastern, western, and northern boundaries of the BG region where calculations of freshwater content were conducted for this paper. Note that the isobath 300m is used as the southern boundary for this region. Bathymetry is shown in colors and blue arrows depict climatologic annual ice drift in this region.
Figure 2. Liquid fresh water in the BG region in 2015. Left panel: mean FWC in 200 km grids from summer observations in m. Center panel: optimally interpolated FWC (m) contours with locations of the raw data indicated by small circles. Right panel: Estimated error (m) of optimally interpolated gridded values.
Figure 3 Time series of freshwater content in different layers of the Beaufort Gyre region. Blue bars depict total liquid freshwater content. Black bars show freshwater content in sea ice. Yellow bars – freshwater content in the mixed layer, red bars – in the Pacific and green bars – in the Atlantic water layer. Freshwater content is shown in thousand cubic kilometers. Upper left bars shows total annual freshwater flux into the Arctic Ocean from all rivers; green and black small bars show errors in liquid and sea ice freshwater content estimates. All freshwater contents are calculated relative to 34.8 reference water salinity.