Fresh water content (FWC) decadal shift
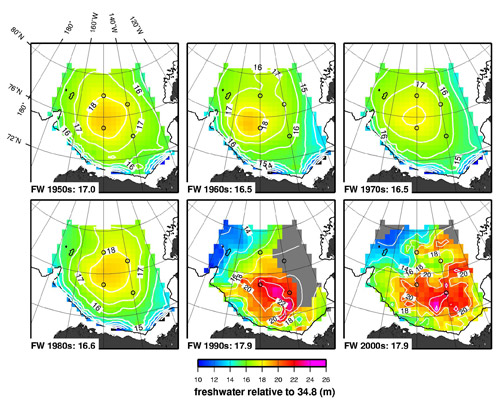
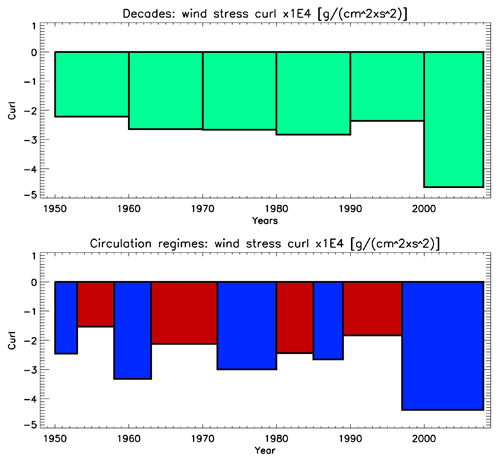
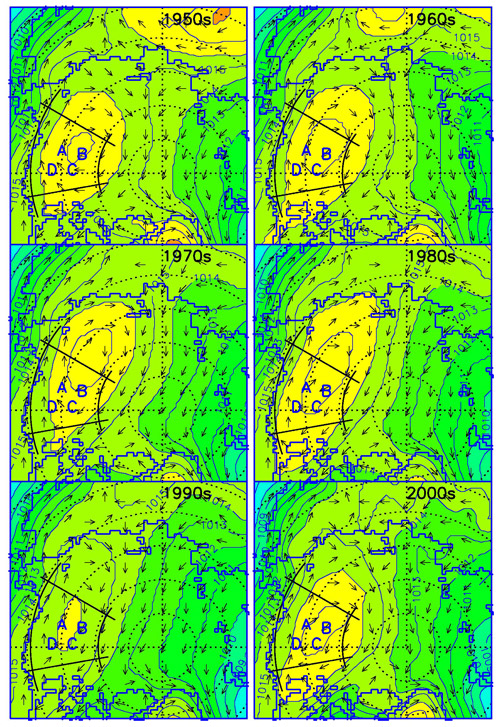
On the basis of our analysis of the decadal distributions of Fresh Water Content Liquid (FWCL or FWC in the ocean) in the BG (Figure 1), decadal distributions and decadal changes of atmospheric conditions (Figure 3) and wind stress curl over the BG region (Figure 2), we conclude that the anticyclonic atmospheric circulation dominated over the BG since at least the 1950s enabling freshwater accumulation in this region of the Arctic Ocean (via negative wind curl and consequently positive Ekman Pumping, EP). We speculate that fresh water characteristics in the BG depend on three parameters: surface layer characteristics of the regions which supply this fresh water in the BG, strength of the wind curl, and a location of the Arctic High center. Indeed, the historical hydrographic data indicate that FWCL in the BGR did not change significantly from decade to decade in the 1950–1980s period (Figure 1) which is in agreement with decadal SLP fields and position of the Arctic High (Figure 3). Wind stress curl (Figure 2) also did not change significantly during the 1960–1980s. Note that the information about wind stress curl (Figure 2) and information about location of the Arctic High (Figure 3) center have to be analyzed together to explain changes in FWCL and its center of maximum. For example, the wind stress curl values over the region in the 1960s and 1970s are practically identical but the center of the Arctic High shifted westward in the 1970s (Figure 3) and the center of the BG maximum of FWCL also shifted to the new position. It is also important to remember that the FWCL distribution for the 1970s is more accurate than for other pre-1990s decades because the hydrographic data coverage in the 1970s was relatively good [see Timokhov and Tanis, 1997, 1998] and therefore the FWCL from the 1970s may be used as a climatologic benchmark characterizing all pre-1990s conditions.
The SLP (Figure 3) and FWCL (Figure 1) conditions in the 1990s differed significantly from the pre-1990s climatologic conditions: the maximum of the FWCL distribution shifted to the southeast and increased in magnitude. The spatially integrated BG FWCL for the 1990s exceeded the climatologic mean for the 1950–1980 by approximately 1400 km3; lateral gradients of FWCL increased as well. Thus, in the 1990s the freshwater reservoir of the 1950–1980s with its center at 76°N and 150°W "released" its freshwater which was relocated into a new center with coordinates 73.5°N and 143°W. We also conclude that the major cause of this relocation was the change in the atmospheric circulation, intensity and center of the maximum EP. While the EP in the BG "traditional" region of 1970s shown in Figure 1 decreased, the center of EP shifted southward and eastward (Figure 1, 1990s) and reorganized the FWCL fields respectively. As a result the BG freshwater reservoir contracted but intensified.
In the 2000s, the "decadal" (based on 2000–2007 data) volume of liquid freshwater in the BG is comparable to what it was in the 1990s but a significant increase of FWC in the region was observed in 2007-2008.
References
Timokhov, L., and F. Tanis (1998), Joint U.S.-Russian Atlas of the Arctic Ocean [CD-ROM], Environ. Res. Inst. of Mich., Ann Arbor, Mich.


