Fresh water content (FWC) interannual
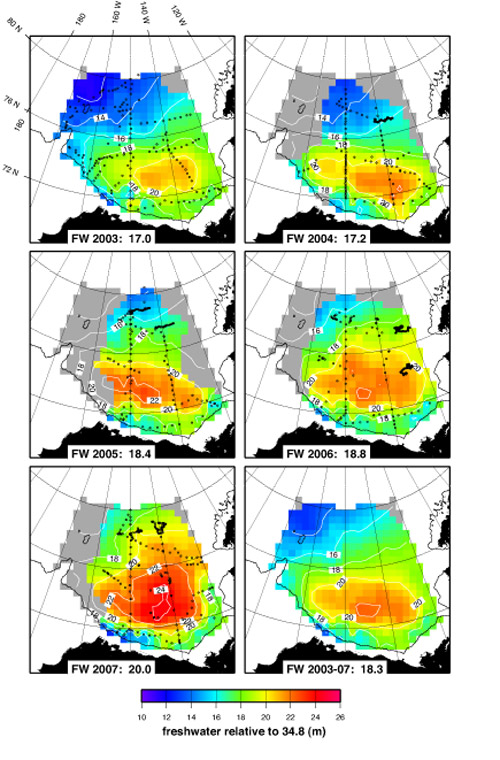
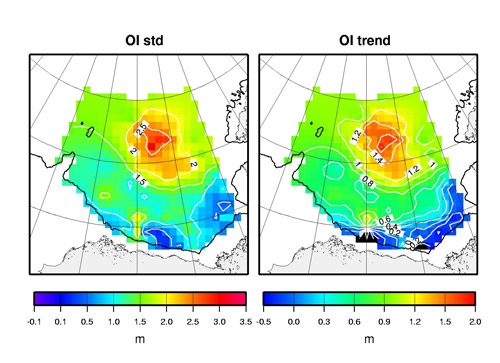
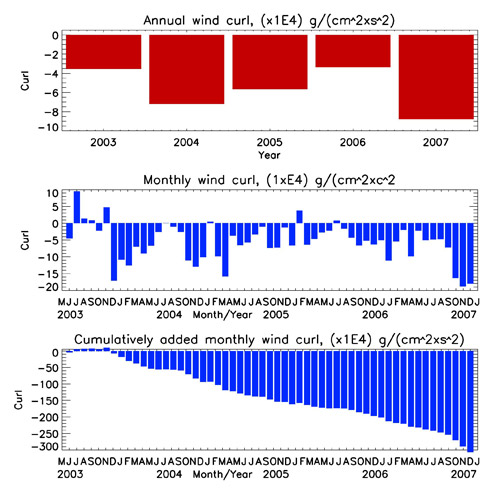
In order to analyze interannual changes in the volume of the liquid component of fresh water in the Beaufort Gyre region (Fresh Water Content Liquid, FWCL) we have used results from BG summer observations at repeat CTD and XCTD stations in conjunction with all other available mooring and drifter data from the cruise times. The FWCL was calculated for all years relative to reference salinity 34.8 and then gridded employing optimal interpolation (see Proshutinsky et al., 2009 for details). While during 2003–2004 FWCL in the BGR showed little change (Figure 1), in 2005 the total FWCL in the region began to increase, reaching 20,000 km3 in 2007. The maximum annual trend of FWCL accumulation was observed at the new center of the BG (which was first established in the 1990s, see also section “Decadal changes”) with a rate of approximately 1.5 m per year in the center and tapering away with increasing radius (Figure 2). Preliminary data from the BGOS 2008 cruise indicate that the FWCL in the BG continued to rise in 2008 and reached 21,000 km3, a historical maximum from all available years of observations. Compared to 1970s climatology (the pre-1990s decade with the most extensive data coverage) there has been a FWCL increase in the BG of approximately 5000 km3. This is comparable with the volume of freshwater annually delivered to the Arctic Ocean by rivers and through Bering Strait (5700 km3 per year [Serreze et al., 2006]). The major cause of FWC increase in the BG region is Ekman pumping which has been increasing gradually since 2003 with absolute maximum in 2007 (Figure 3).
References
Proshutinsky, A., R. Krishfield, M.-L. Timmermans, J. Toole, E. Carmack, F. McLaughlin, W. J. Williams, S. Zimmermann, M. Itoh, and K. Shimada (2009), Beaufort Gyre freshwater reservoir: State and variability from observations, J. Geophys. Res., 114, C00A10, doi:10.1029/2008JC005104.
Serreze, M. C., A. P. Barrett, A. G. Slater, R. A. Woodgate, K. Aagaard, R. B. Lammers, M. Steele, R. Moritz, M. Meredith, and C. M. Lee (2006), The large-scale freshwater cycle of the Arctic, J. Geophys. Res., 111, C11010, doi:10.1029/2005JC003424.


