Inorganic Carbon and pCO2 Variability During Ice Formation
For details read: DeGrandpre, M. D., Lai, C.‐Z., Timmermans, M.‐L., Krishfield, R. A., Proshutinsky, A., & Torres, D. (2019). Inorganic Carbon and pCO2 Variability During Ice Formation in the Beaufort Gyre of the Canada Basin. Journal of Geophysical Research: Oceans, 124, 4017–4028. https://doi.org/10.1029/ 2019JC015109
Link: https://agupubs.onlinelibrary.wiley.com/doi/10.1029/2019JC015109
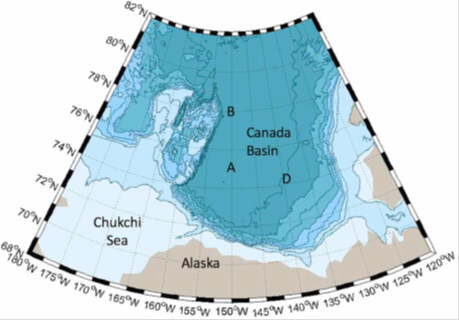
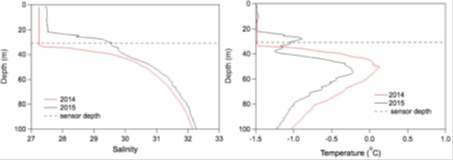
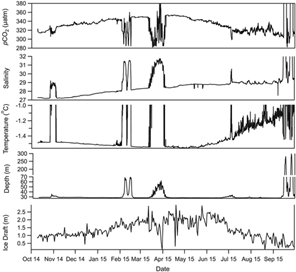
When sea ice forms, the dissolved solutes are squeezed out of the ice matrix, forming a dense brine that can sink into deeper water. This process has a potentially important role in the inorganic carbon cycle because dissolved inorganic carbon can sink with the brine, exporting it from the surface ocean and increasing the sea surface CO2 partial pressure (pCO2). We deployed a pCO2 sensor at 30‐m depth in the Canada Basin, the largest of the Arctic Ocean subbasins, that documented an increase in pCO2 during the fall to winter ice formation period. This increase correlated with an increase in salinity over the same time period. A simple model calculation supports that the increase in pCO2 and inorganic carbon is primarily due to ice formation. This finding has important implications for the future inorganic carbon cycle as seasonal ice formation increases due to loss of perennial ice cover in the Arctic. Figures below support these findings.
References
References are available at: DeGrandpre, M. D., Lai, C.‐Z., Timmermans, M.‐L., Krishfield, R. A., Proshutinsky, A., & Torres, D. (2019). Inorganic Carbon and pCO2 Variability During Ice Formation in the Beaufort Gyre of the Canada Basin. Journal of Geophysical Research: Oceans, 124, 4017–4028. https://doi.org/10.1029/ 2019JC015109
Link: https://agupubs.onlinelibrary.wiley.com/doi/10.1029/2019JC015109


