Arctic Ocean Oscillation Index (AOO)
We have updated the AOO index, which is available here.
1. Needs for an Arctic Ocean Index
There has long been motivation to find the basic mechanisms that cause the observed changes in the Arctic atmosphere-ice-ocean system (e.g. Bradley & Miller,1972; Budyko,1977; van Loon & Rogers, 1978; Jones et al., 1986; Wadhams, 1994; Dickson, 1999; Vinnikov et al., 1999; Hakkinen and Geiger, 2000) at decadal and shorter time scales. Climate indices, such as the North Atlantic Oscillation (NAO; e.g.Walker, 1924; Hurrell et al., 2003), the Arctic Ocean Oscillation (AOO; e.g. Proshutinsky & Johnson, 1997; Proshutinsky et al., 1999, 2002; Dukhovskoy et al., 2004) and the Arctic Oscillation (AO; Thompson and Wallace, 1998) have been constructed to characterize complex climate processes and explain past variability. However, attempts to predict the NAO and AO cycles were not successful (e.g. Wunsch, 1999; Stephenson et al., 2000; Dickson et al. 2000).
Compared to the NAO and AO, the AOO index, defined on the basis of a wind-driven simulated sea-surface height field across the Arctic (Proshutinsly and Johnson, 1997) is a more Arctic-centric index. The index is a measure of the intensity and sense (clockwise/anticyclonic or counterclockwise/cyclonic) of the Arctic Ocean wind-driven circulation. Below, we explain the mechanisms regulating changes in the Arctic circulation regimes and environmental parameters at decadal time scales using this index. Over the period 1948-1996 the AOO has been shown to be the most appropriate index to capture variability in key Arctic environmental parameters (Proshutinsky et al., 1999; Polyakov et al., 1999; Overland, 2009).
2. AOO index definition
The AOO index was first defined in Proshutinsky & Johnson (1997) based on analysis of annual sea surface height fields simulated employing a regional Arctic shallow-water barotropic coupled ice-ocean model (Proshutinsky, 1993; Proshutinsky and Johnson, 1997). The model was forced by 6-hourly wind stresses derived from NCAR/NCEP atmospheric reanalysis data for 1948-1993. The model was developed initially to investigate and predict storm surges and tides in the Arctic Ocean (Proshutinsky, 1993); it has been employed since 1992 by the Arctic and Antarctic Research Institute (St. Petersburg, Russia) as an operational model to predict sea ice conditions and sea level variability in the Arctic Ocean. Although only a shallow-water model, full testing and calibration against observed sea-level time series along the Siberian coastline and sea-ice drift data from the International Arctic Buoy program (IABP) prove the model to well-represent the principal patterns of sea ice dynamics, sea level variability at coastal tide gauges and ocean circulation (Proshutinsky et al., 2004; Joyce and Proshutinsky, 2007; Timmermans et al., 2011).
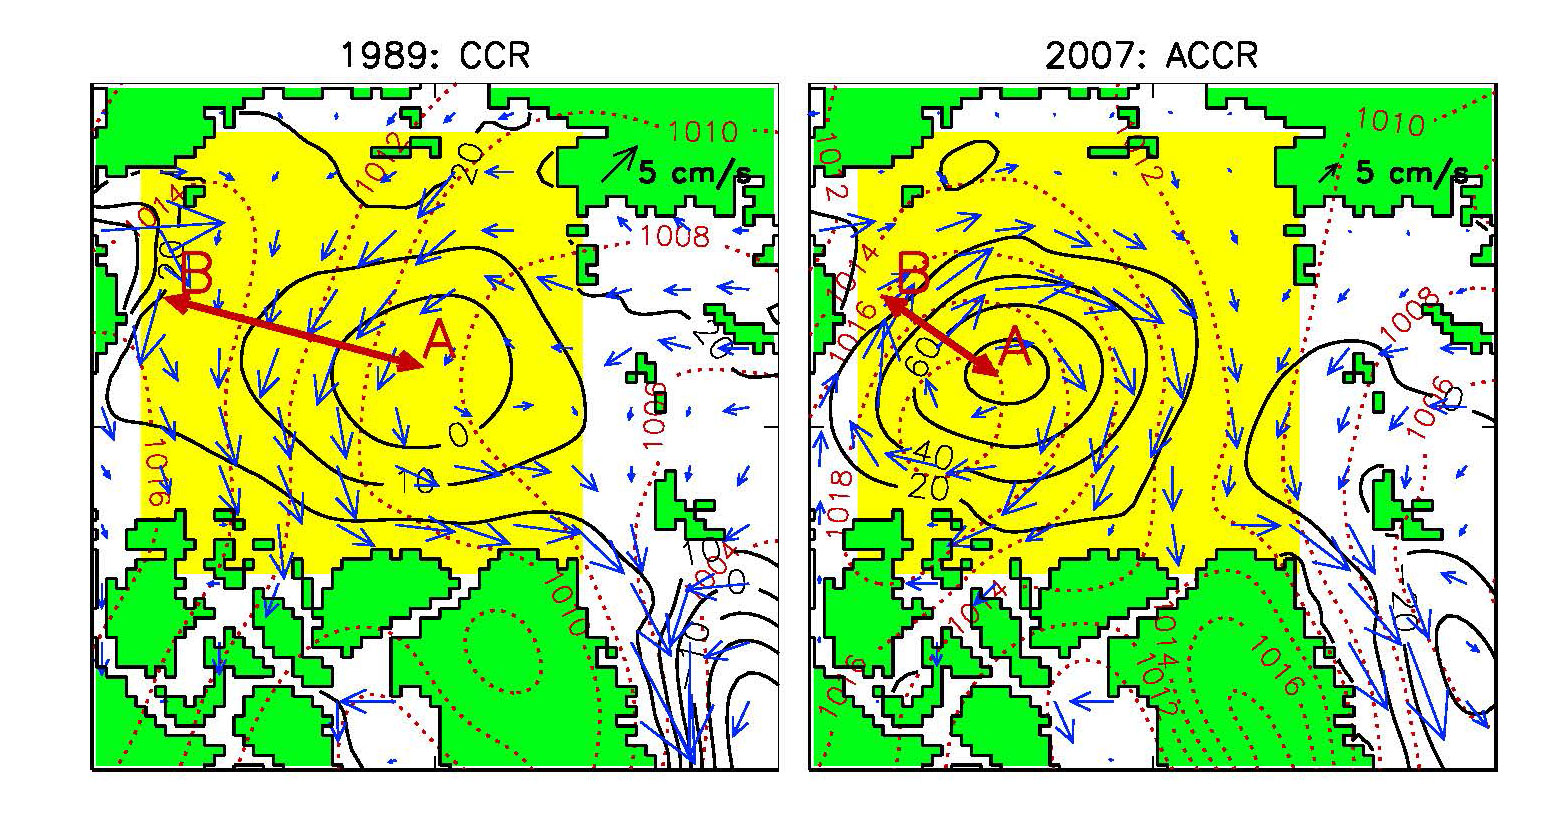
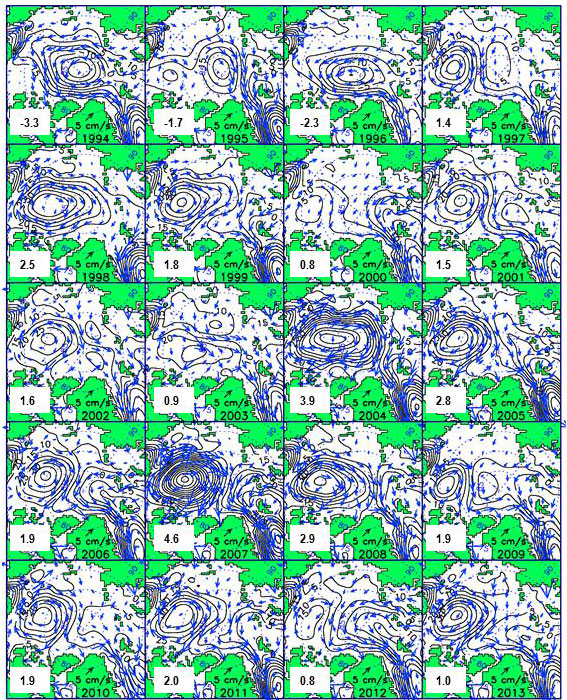
To calculate the AOO index (Proshutinsky & Johnson, 1997), the location of the extremum in the annual simulated sea level in the Arctic Ocean region was first located and then the last closed sea surface height isoline around that extremum was found to determine the sea surface height horizontal gradient (this number (×10-6) is non-dimensional and its calculation procedure is illustrated in Figure 1). While the magnitude of the gradient is somewhat sensitive to the shape of the last closed isoline, the sign of the gradient is robust. Positive values of these gradients correspond to a raised central sea surface and anticyclonic (clockwise) water circulation (Figure 1, right panel). Negative values correspond to lowered central sea surface and cyclonic (counterclockwise) water circulation (Figure 1, left panel). Figure 8 in Proshutinsky & Johnson (1997) illustrates the mean annual simulated sea surface heights in the Arctic Ocean for 1948-1993. Figure 2 here shows annual circulation patterns and AOO indices for 1994-2015.
An objective measure of the AOO index time series employs empirical orthogonal function analysis (EOF) to derive the major modes of variability for annual sea surface height values for 1948-2015.
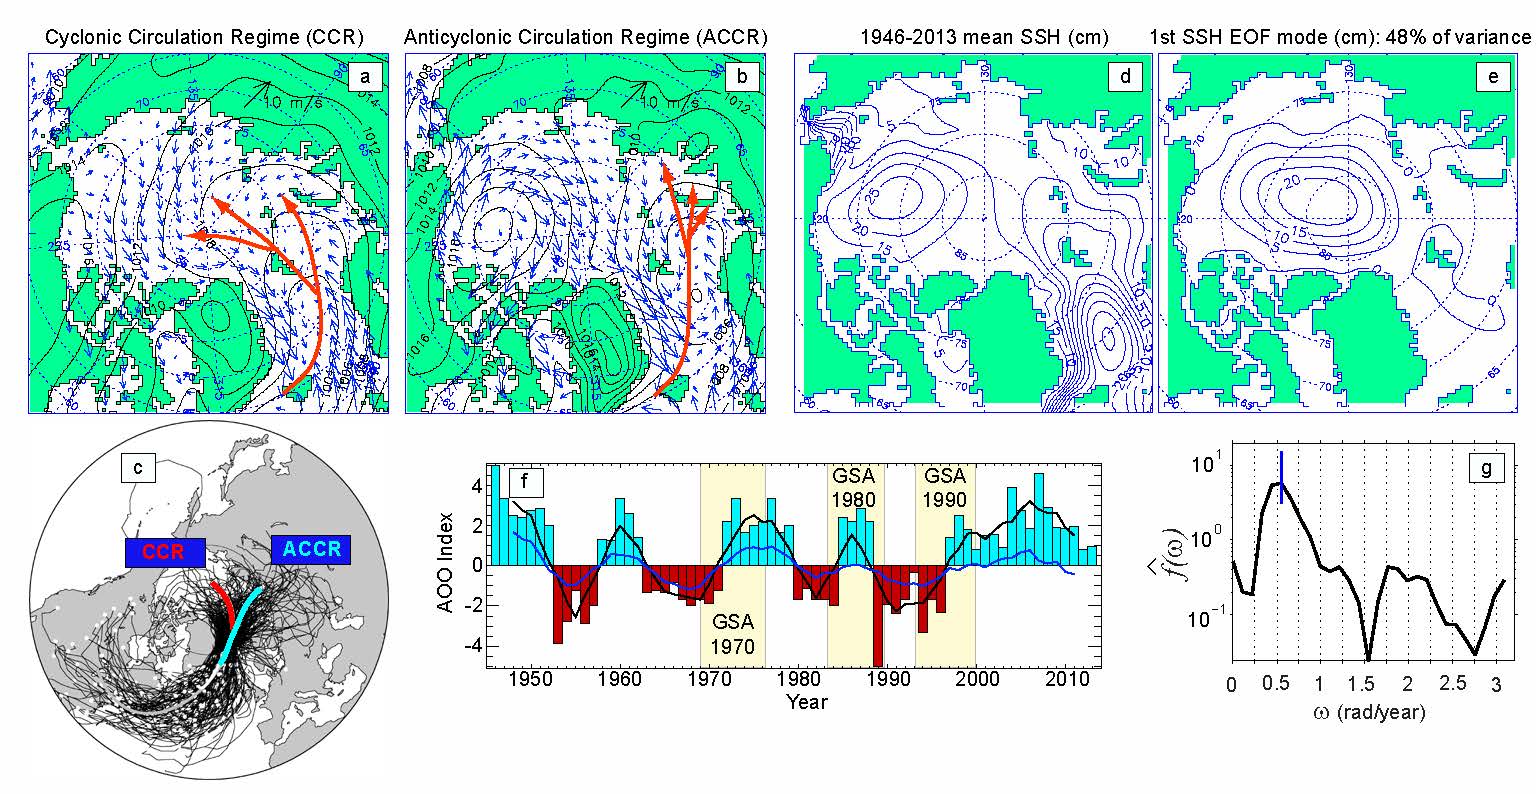
The first EOF mode of the sea surface height pattern (Figure 3, panels d, e and f) describes 48% of the annual sea surface height variability for this period. Differences in phase between the EOF-based AOO and that derived following the manual approach (Proshutinsky and Johnson, 1997; Proshutinsky et al., 1999) are to be expected because the EOF-based index describes only 48% of variability while the manually-derived AOO measures the full strength of the cyclonic/anticyclonic circulation. Note that these differences change none of the general results here, and the two methods yield indices that are highly correlated (r = 0.89) and demonstrate the dominant decadal signal of change in the Arctic Ocean wind-driven circulation regime. The manually-derived AOO is analyzed here.
3. AOO variability, circulation regimes and their characteristics
The AOO strongly correlates with many environmental parameters (Proshutinsky and Johnson, 1997; Proshutinsky et al., 1999), characterizes interannual change in the Canada Basin (Carroll et al., 2011), Beaufort Gyre freshwater content (Proshutinsky et al., 2009; Krishfield et al., 2014), and variability of freshwater content across the entire Arctic Ocean (Rabe et al., 2014). During negative AOO years (red bars in figure 3f), the Arctic atmosphere is relatively warm and humid due to frequent penetration of cyclones from the North Atlantic (figure 5a,c) into the central Arctic (Proshutinsky and Johnson, 1997; Proshutinsky et al., 1999]. This is consistent with results of Sortenberg and Walsh (2008) where it was shown that cyclones that originate in the North Atlantic are a major source of moisture and heat to the Arctic (figure 3c). These cyclones have two distinct trajectories bringing moisture into the central Arctic or Siberia depending on the atmospheric circulation regime. In the regime discussed above (hereinafter - Cyclonic Circulation Regime, CCR), low sea level atmospheric pressure dominates over the central Arctic Ocean (figure 3a), with winds forcing the sea ice to drift cyclonically (counterclockwise). During a CCR, both exports of sea ice (the solid component of the freshwater flux) and low salinity polar water (liquid freshwater flux) to the Greenland-Iceland-Norwegian (GIN) Sea increase [Proshutinsky and Johnson, 1997; Proshutinsky et al., 1999]. Anomalously high freshwater flux results in freshening of the upper Greenland-Iceland-Norwegian (GIN) Sea. The Great Salinity Anomalies observed in the GIN Sea in the 1970s, 1980s and 1990s (figure 3f; e.g. Dickson et al., 1988; Belkin et al., 1998; Hakkinen, 1993) correlate well with the history of cyclonic circulation regimes starting several years after the initiation of CCRs over the Arctic Ocean.
By contrast, during positive AOO years (figure 3f, blue bars), the trajectories of North Atlantic cyclones are shifted eastward resulting in fewer cyclones reaching the central Arctic (figure 3b,c). In this climate regime (hereinafter - Anticyclonic Circulation Regime, ACCR), high sea level atmospheric pressure dominates over the Arctic with anticyclonic winds forcing sea ice to drift clockwise (figure 3b). During a typical ACCR, the Arctic atmosphere is relatively cool and dry (Proshutinsky and Johnson, 1997; Proshutinsky et al., 1999). Lower-than-normal air temperatures and anticyclonic winds lead to thicker ice and increased ice extent in an ACCR compared to a CCR. During an ACCR, freshwater is accumulated in the Beaufort Gyre of the Canada Basin (Proshutinsky et al., 2002; Krishfield et al., 2014) due to Ekman transport convergence, reducing freshwater transport toward the North Atlantic Subpolar Region (NASR, which includes the Labrador Sea and Nordic Seas) and resulting in reduced stratification of the upper ocean there, promoting deep convection and atmospheric warming (Proshutinsky et al., 2002; Dukhovskoy et al., 2006a,b).
Results of Proshutinsky et al. (1999) showed that the two-climate regime theory characterized by AOO variability explains much of the observed decadal variability of the Arctic Ocean, and helps to reconcile the different conclusions among analyses of Arctic data obtained during different climate regimes. Recently, the AOO index was used in several studies to explain decadal-scale regime shifts in Northwest Atlantic shelf ecosystems (Green et al., 2013) and understand climatic regulations of growth rates of bivalve shells around Svalbard and in the northwestern Barents Sea (e.g. Carroll et al., 2011). Our studies also show that there are significant differences in seasonal variability between years with cyclonic and anticyclonic circulation regimes (Polyakov et al., 1999).
Time series of the AOO index from 1948-1996 indicate that ACCRs and CCRs alternate at approximately 5 to 7 year intervals with a period of quasi-oscillation of about 10 to 15 years. In a stark deviation from this pattern, the ACCR started in 1997 has dominated in the Arctic over the last 17 years (figure 5f). Of essential importance to our understanding of the evolving Arctic system, and its impact on the global environment, is to discern the causes and consequences of the apparent break-down in the decadal variability of circulation regimes. Why has the well-pronounced decadal variability observed in 1948-1996 been replaced by relatively weak interannual changes under ACCR conditions after 1996?
The answers on this question are provided in “Potential climate change scenario” at this BG project webpage folder.
References
Belkin, I. M., Levitus, S., Antonov, J. & Malmberg S-A. “Great Salinity Anomalies” in the North Atlantic. Prog. in Oceanogr. 41, 1, 1-68 (1998).
Bradley RS, Miller GH. 1972 Recent climatic change and increased glacierization in the eastern Canadian Arctic, Nature, 237, 385–387.
Budyko MI. 1977 Climate Changes, 261 pp., Waverly, Baltimore, Md.
Carroll, M. L. et al. Pan-Svalbard growth rate variability and environmental regulation in the Arctic bivalve Serripes groenlandicus. Journal of Marine Systems 88, 239-251 (2011).
Dickson, R. R., Meincke, J., Malmberg, S. A. & Lee, L. J. The great salinity anomaly in the northern North Atlantic 1968–1982. Prog. Oceanogr. 20, 103–151 (1988).
Dickson R. 1999 All change in the Arctic, Nature, 397, 389– 391.
Dickson R R, Osborn TJ, Hurrell JW, Meincke J, Blindheim J, Adlandsvik B, Vinje T, Alekseev G, Maslowski W. 2000 The Arctic Ocean response to the North Atlantic Oscillation, J. Clim., 13, 2671–2696.
Dukhovskoy DS, Johnson M, Proshutinsky A. 2004 Arctic decadal variability: An auto-oscillatory system of heat and fresh water exchange. Geophys. Res. Lett.,31, L03302. (doi:10.1029/2003GL019023)
Dukhovskoy DS, Johnson M, Proshutinsky A. 2006 Arctic decadal variability from an idealized atmosphere-ice-ocean model: 1. Model description, calibration, and validation. J. Geophys. Res.111. C06028. (doi:10.1029/2004JC002821)
Dukhovskoy DS, Johnson M, Proshutinsky A. 2006. Arctic decadal variability from an idealized atmosphere-ice-ocean model: 2. Simulation of decadal oscillations. J. of Geophys. Res. 111, C06029. (doi:10.1029/2004JC002820)
Greene, C. H. et al. Remote climate forcing of decadal-scale regime shifts in Northwest Atlantic shelf ecosystems. Limnology and Oceanography 58(3), 803-816 (2013).
Hakkinen, S. Arctic source for Great Salinity Anomaly: A simulation of the Arctic ice ocean system for 1955– 1975. J. Geophys. Res. 98, 16,397–16,410 (1993).
Hakkinen S, Geiger CA. 2000 Simulated low-frequency modes of circulation in the Arctic Ocean, J. Geophys. Res., 105, 6549-6564.
Hurrell JW, Kushnir Y, Ottersen G, Visbeck M. (eds) 2003 The North Atlantic Oscillation Climatic Significance and Environmental Impact, 279 pp., Washington, D. C.: AGU
Joyce T, Proshutinsky A. 2007 Greenland’s island rule and the Arctic Ocean circulation. J. Mar. Res. 65, 639-653.
Krishfield RA, Proshutinsky A, Tateyama K, Williams WJ, Carmack EC, McLaughlin FA, Timmermans M-L. 2014 Deterioration of perennial sea ice in the Beaufort Gyre from 2003 to 2012 and its impact on the oceanic freshwater cycle, J. Geophys. Res. Oceans, 119, 1271–1305, doi:10.1002/2013JC008999.
Polyakov I, Proshutinsky A, Johnson M. 1999 The seasonal cycles in two regimes of Arctic climate. J. Geophys. Res. 104(C11), 25,761–25,788.
Overland JE, 2009 Meteorology of the Beaufort Sea, J. Geophys. Res., 114, C00A07. (doi:10.1029/2008JC004861).
Proshutinsky A. 1993 Arctic Ocean Level Variability. 216p St. Petersburg: Gidrometeoizdat.
Proshutinsky A, Ashik I, Dvorkin E, Häkkinen S,Krishfield R, Peltier R. 2004 Secular sea level change in the Russian sector of the Arctic Ocean. J. Geophys. Res. 109, C03042. (doi:10.1029/2003JC002007)
Proshutinsky A, Johnson M.1997 Two circulation regimes of the wind-driven Arctic Ocean. J. Geophys. Res. 102, 12,493–12,514.
Proshutinsky A, Polyakov I, Johnson M. 1999 Climate states and variability of Arctic ice and water dynamics during 1946-1997. Pol. Res.18(2), 135–142.
Proshutinsky A, Bourke RH, McLaughlin FA. 2002 The role of the Beaufort Gyre in Arctic climate variability: Seasonal to decadal climate scales. Geophys. Res. Lett. 29, 2100, doi:10.1029/2002GL015847.
Proshutinsky A, Krishfield R, Timmermans M-L, Toole J, Carmack E, McLaughlin FA,Williams WJ, Zimmermann S, Itoh M, Shimada K. 2009 The Beaufort Gyre Fresh Water Reservoir: State and variability from observations. J. Geophys. Res. 114 (doi:10.1029/2008 JC0055104)
Rabe B et al. 2014 Arctic Ocean basin liquid freshwater storage trend 1992 – 2012. Geophys. Res. Lett, 41.
Sortenberg A, Walh JE. 2008 Seasonal cyclone variability at 70°N and its impact on moisture transport into the Arctic. Tellus A, 60: 570–586 (doi: 10.1111/j.1600 0870.2008.00314.x)
Stephenson DB, Pavan V, Bojariu R. 2000 Is the North Atlantic oscillation a random walk? International Journal of Climatology 20:1 – 18.
Thompson, D. W. J. & Wallace J. M. The Arctic Oscillation signature in the wintertime geopotential height and temperature fields, Geophys. Res. Lett., 25(9), 1297–1300 (1998).
Timmermans M-L, Proshutinsky A, Krishfield R, Perovich D, Richter-Menge J, Stanton T, Toole J. 2011 Surface freshening in the Arctic Ocean's Eurasian Basin: an apparent consequence of recent change in the wind-driven circulation, J. Geophys. Res. (doi:10.1029/2011JC006975)
van Loon H, Rogers JC. 1978 The seesaw in winter temperatures between Greenland and Northern Europe. Part I: General description, Mon. Weather Rev., 106, 296–310. Jones PD, Wigley TML, Wright PB. 1986 Global temperature variations between 1861 and 1984, Nature, 322, 430– 434.
Vinnikov KY, Robock A, Stouffer RJ, Walsh JE, Parkinson CL, Cavalieri DJ, Mitchell JFB, Garrett D, Zakharov VF. 1999 Global warming and Northern Hemisphere sea ice extent, J. Clim., 286, 1934– 1937.
Walker GT. 1924 Correlation in seasonal variation of weather, IX Mem. Ind. Met. Dept., 25, 275– 332.
Wadhams P. 1994 Sea ice thickness changes and their relation to climate, In Polar Oceans and Their Role in Shaping the Global Environment, Geophys. Monogr. Ser., (ed. Johannessen OM, Muench RD, Overland JE) pp. 337– 361, Washington, D. C.:AGU
Wunsch C. 1999 The interpretation of short climate records, with comments on theNorth Atlantic and Southern Oscillations. Bull Amer Met Soc 80, 245-255


