BG Sea Ice and Solid FWC
Changes in the Beaufort Gyre Region (BGR) during the last decade and especially during 2006-2007 were analyzed by Hutchings and Rigor (2009) who reported that in summer of 2007 the thinning of multi-year ice was caused by an increase in solar absorption in the upper ocean due to lower sea ice concentration than normal. Their conclusion is in agreement with Perovich et al. (2008). Some information about sea ice parameters in the BGR is provided also by Perovich et al. (2009).
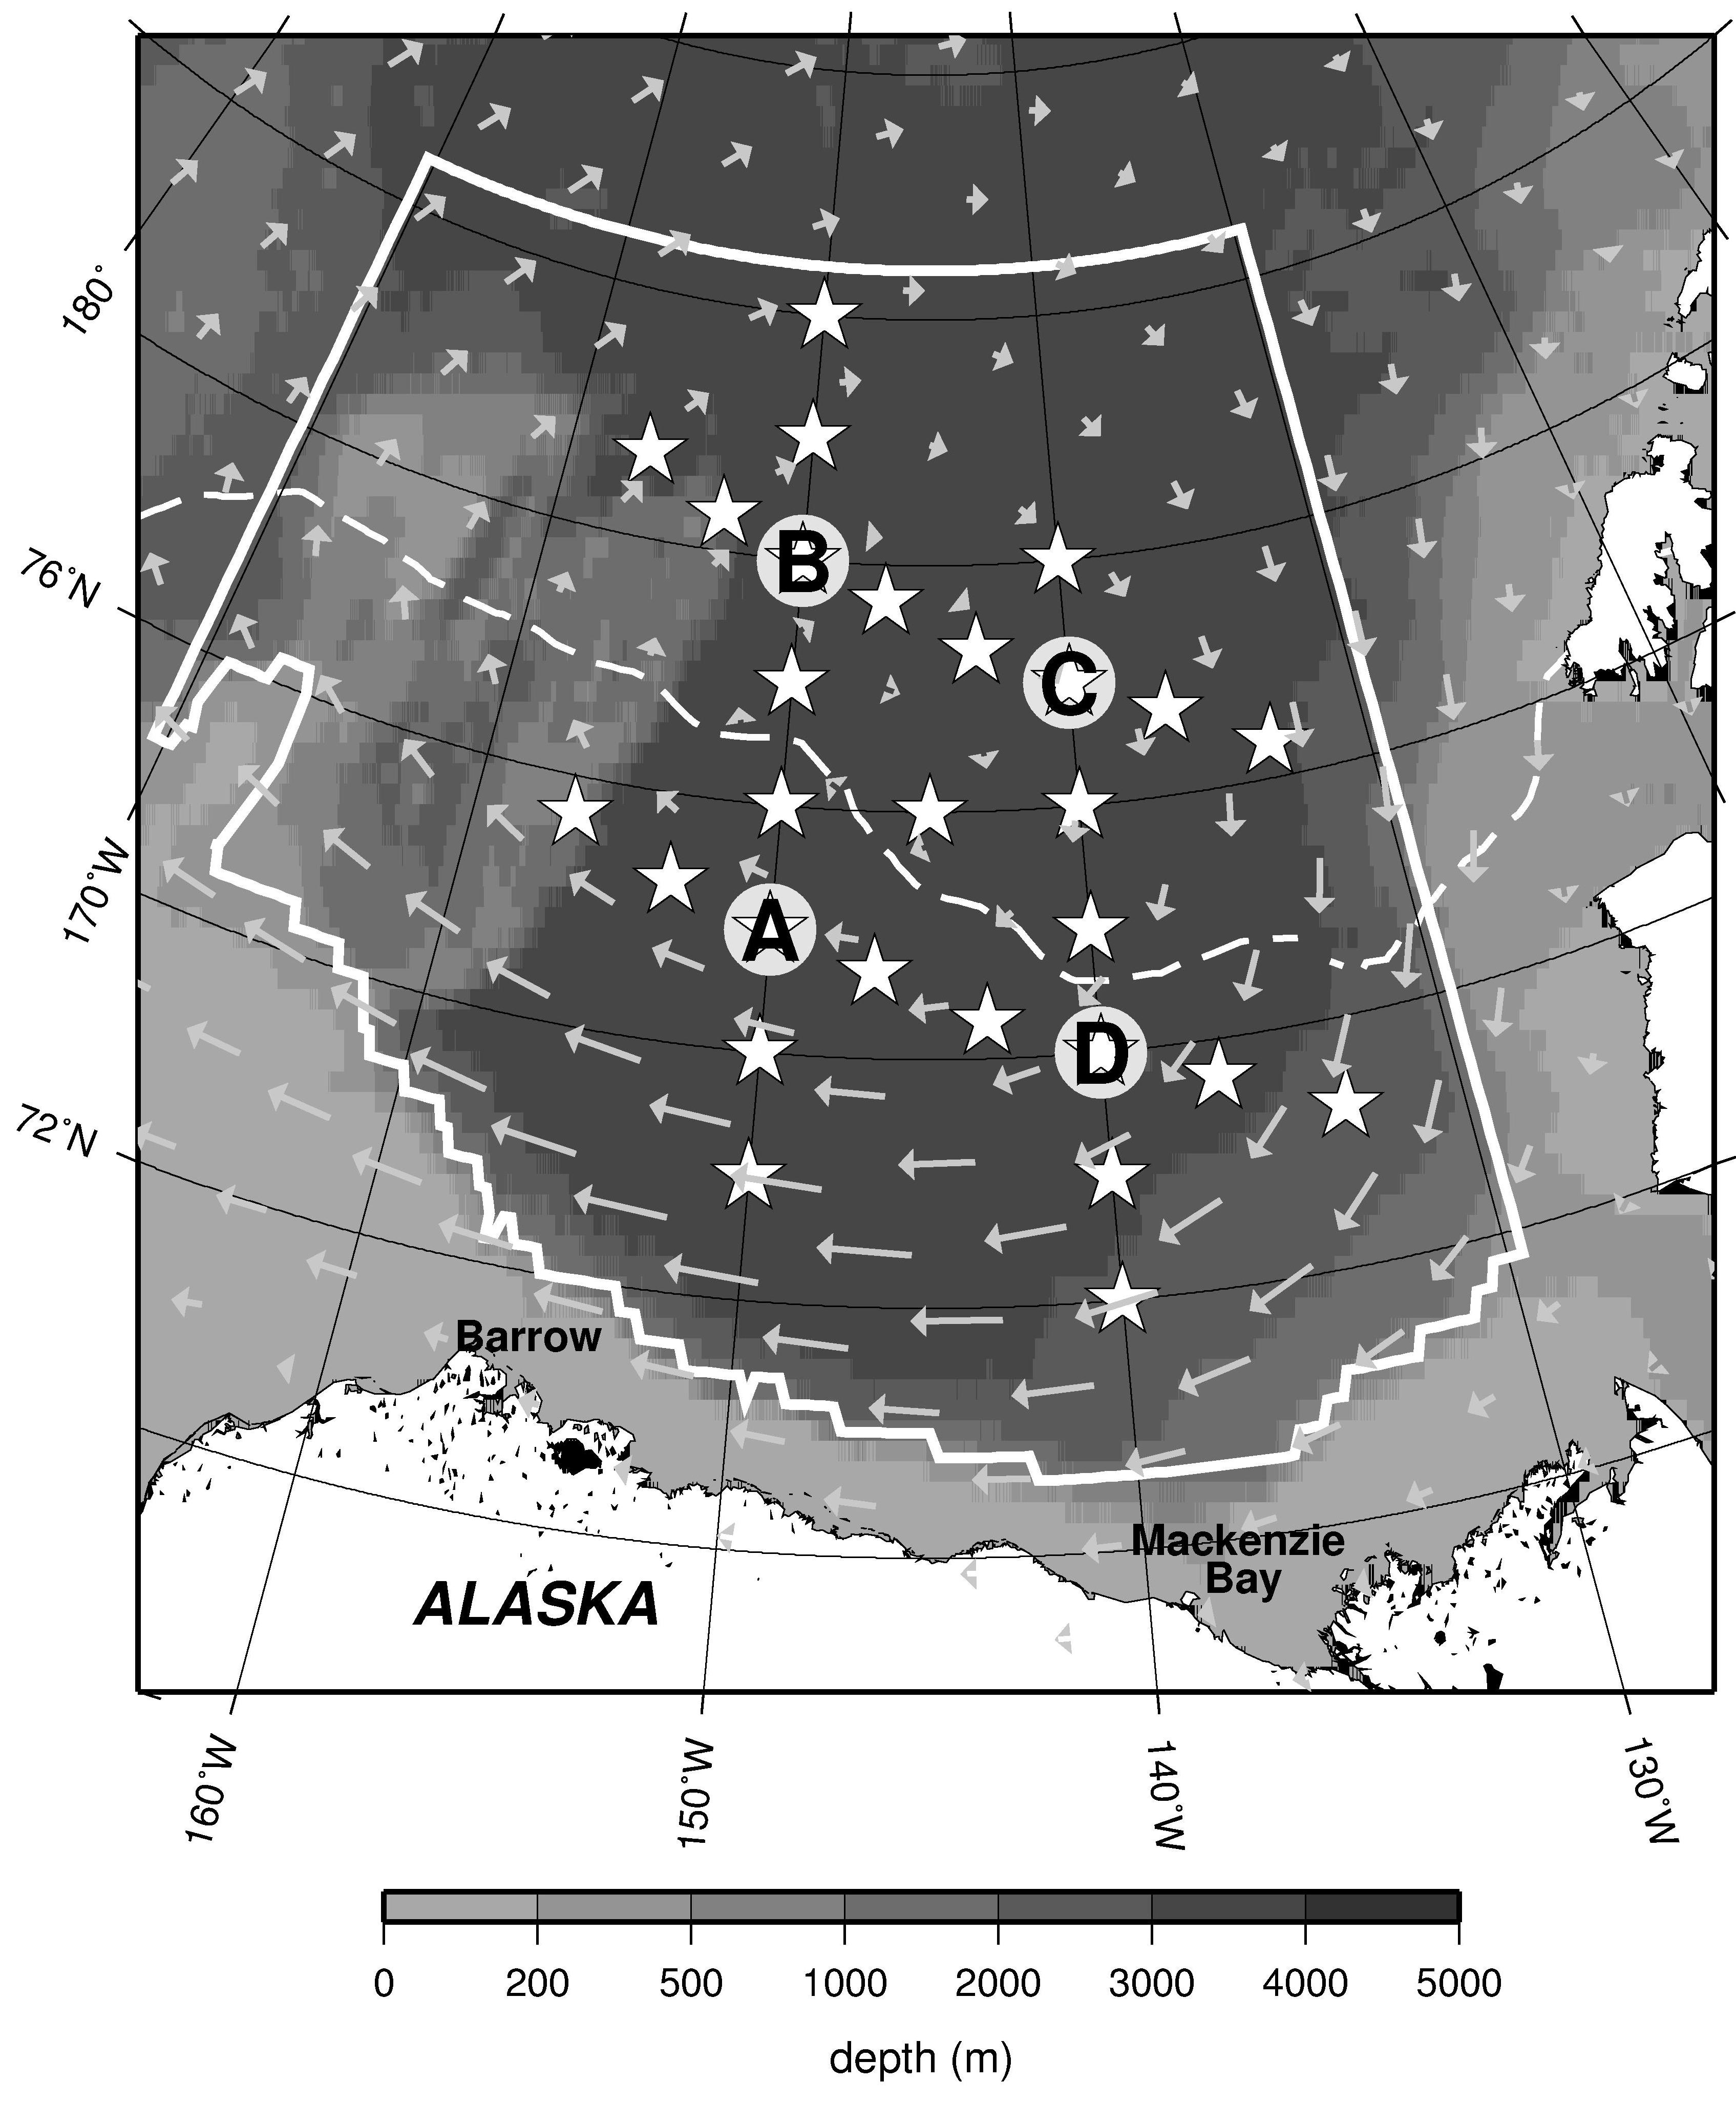
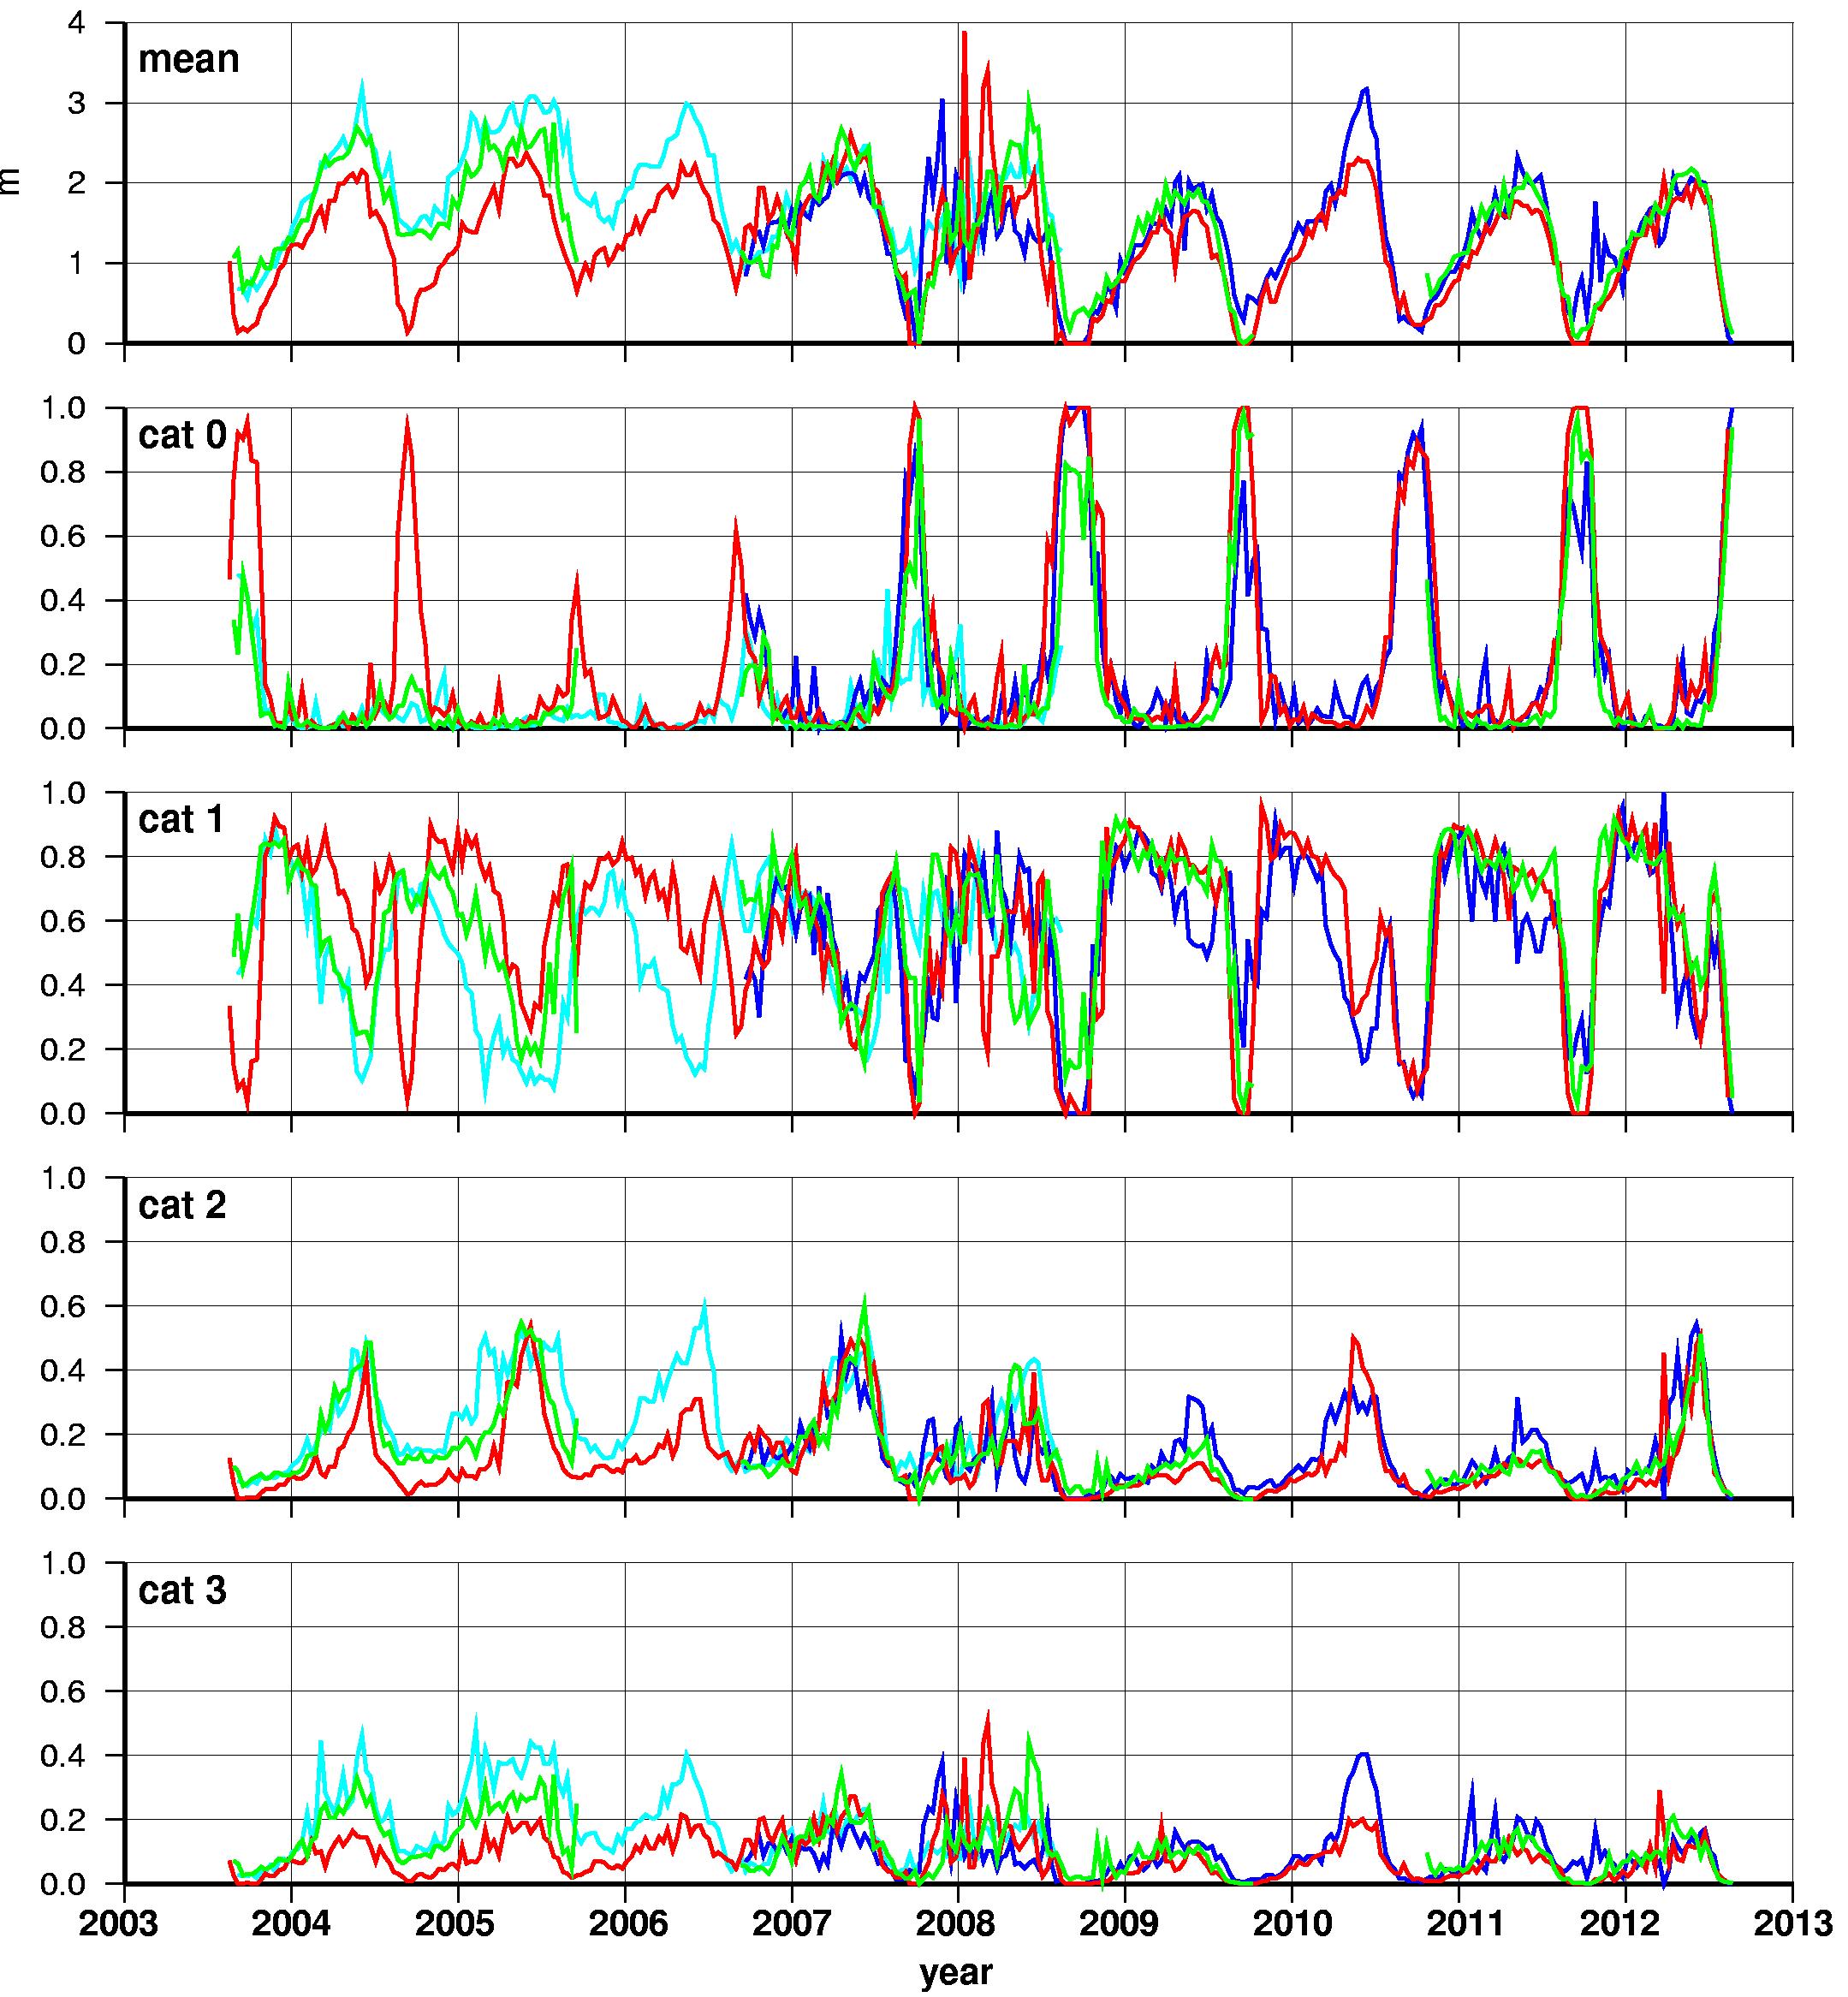
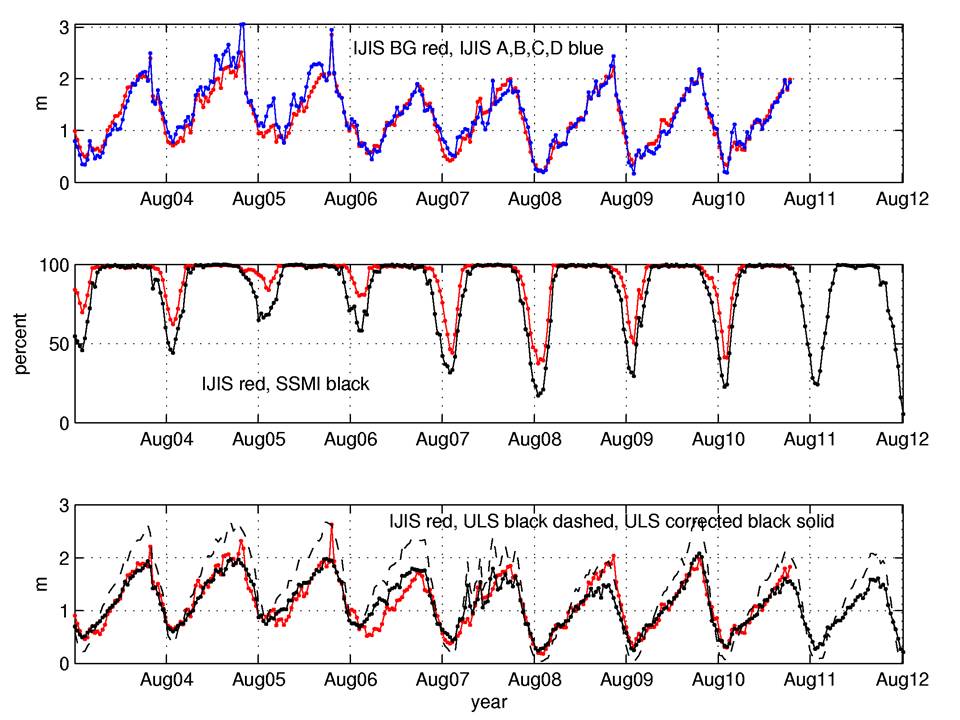
Here we focus on the changes of sea ice measured by Upward Looking Sonars (ULSs) at the locations of our moorings (A, B, C, D; Figure 1). Krishfield et al. (2014) used time series of ice draft from the moored sonar data 2003-2012 to investigate variability and describe the reduction of the perennial sea ice cover in the BGR, culminating in the extreme minimum in 2012. The seasonal magnitude of sea ice draft is approximately 150 cm. The maximum ice draft/thickness in the BGR is observed between May and June and the minimum between late August and early November depending on the year and mooring location. Negative trends in median ice drafts and most ice fractions were observed (Figure 2), while open water and thinnest ice fractions (<0.3 m) increased, attesting to the ablation or removal of the older sea ice from the BGR over the nine year period. Monthly anomalies indicated a shift occurred toward thinner ice after 2007, in which the thicker ice evident at the northern stations was reduced and differences in the ice characteristics between all of the stations diminished, so that the ice cover throughout the region became statistically homogenous (Figure 3).
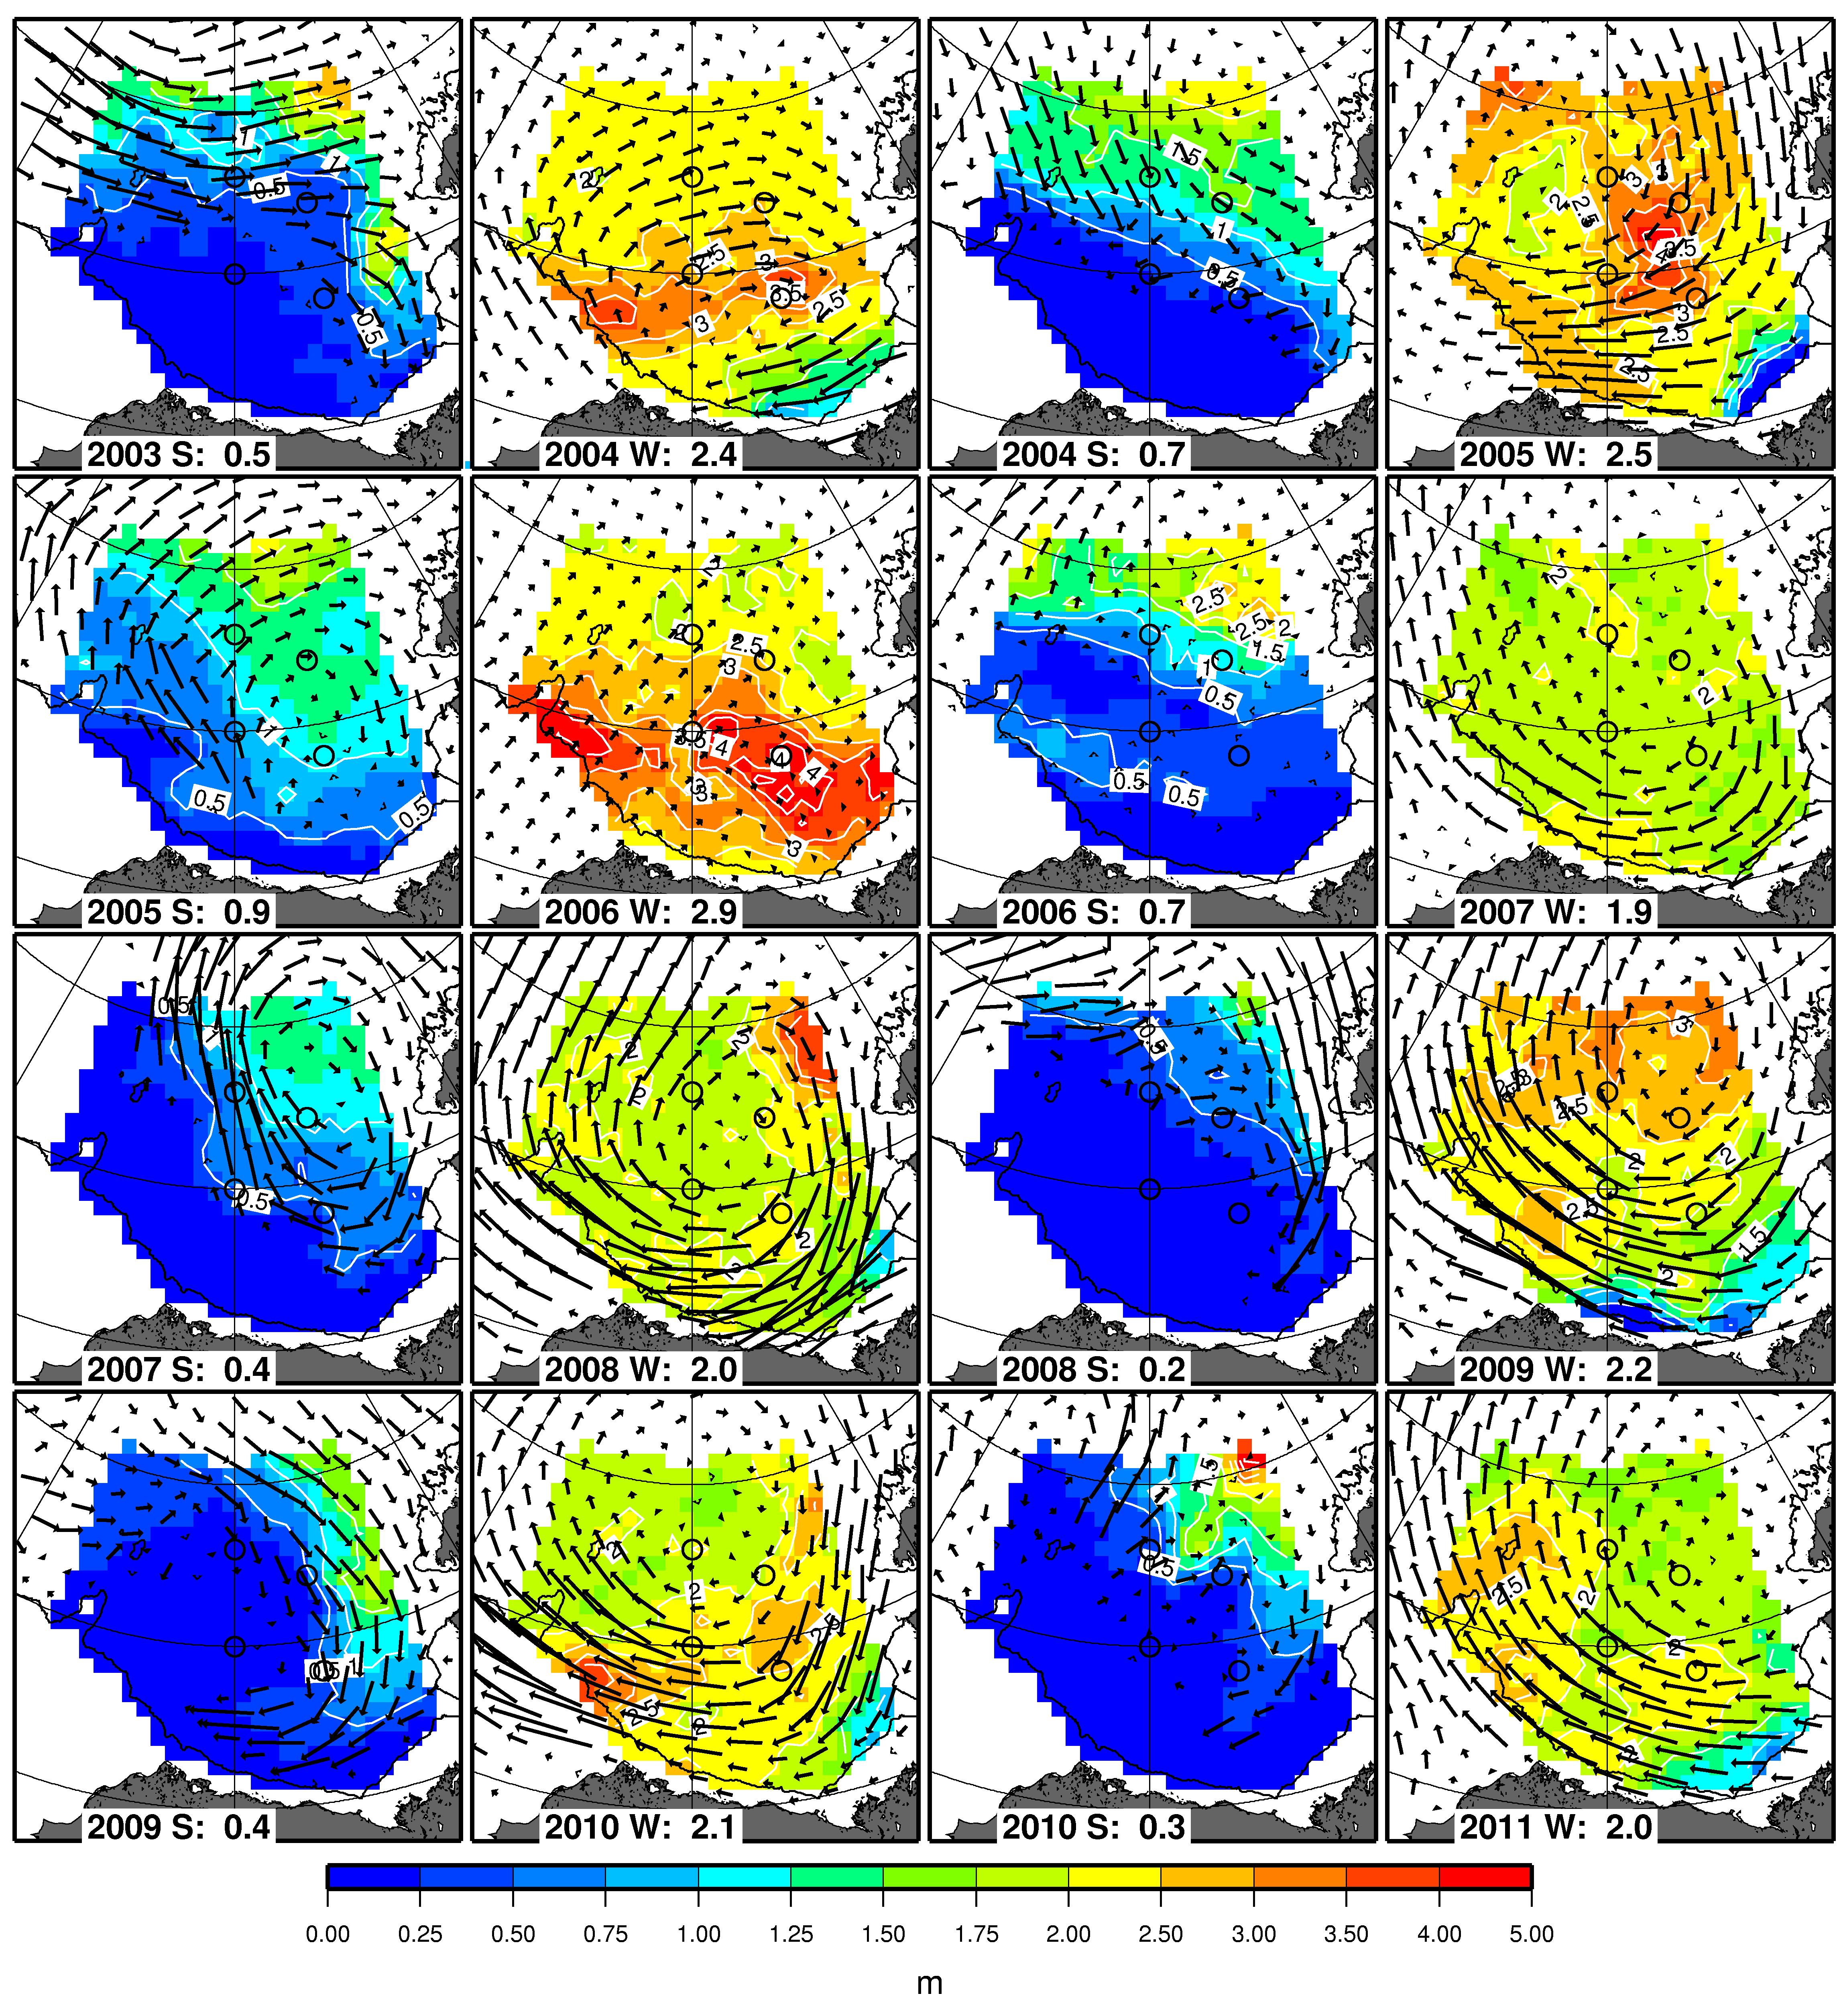
The moored data are used in a relationship with satellite radiometer data to estimate ice volume changes throughout the BGR (Figures 4 & 5). The solid fresh water component (referenced to 34.8) per unit area locked in the sea ice (hfwi) is determined from the measured ice draft, the estimated seawater density (1022 kg m-3), and estimated bulk salinity of the sea ice (and neglecting snow cover) by:
hfwi = (ρsw / ρiw) · (1 - si / 34.8) · h (1)
where ρsw = density of displaced seawater, ρiw = density of melted ice water, si = bulk salinity of sea ice in ppt (which is also by definition the salinity of the melted sea water) and h = ice draft (displaced thickness). A bulk sea ice salinity of 3 ppt was chosen in equation (1), so as to bracket the uncertainty in the fresh water estimates in either direction by 3-4% (see Krishfield et al, 2014 for details). Our final conversion is then:
hfwi = 0.932 · h (2)
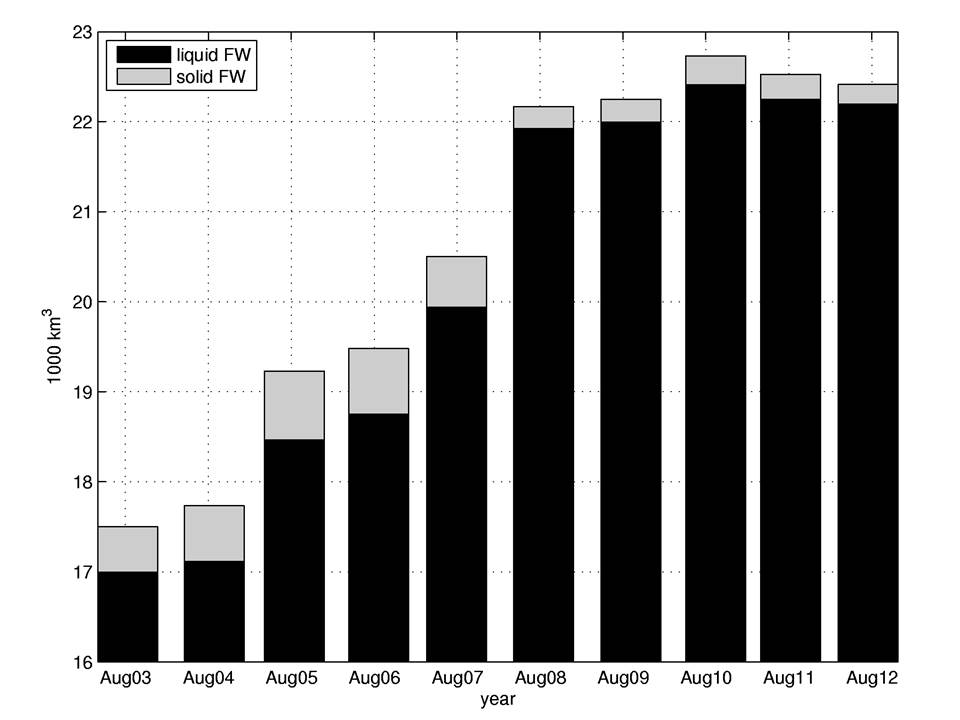
Summer solid fresh water content decreased drastically in consecutive years from 730 km3 in 2006 to 570 km3 in 2007, and to 240 km3 in 2008. After a short rebound, solid fresh water fell below 220 km3 in 2012. Meanwhile hydrographic data indicate that liquid fresh water in the BG in summer increased 5410 km3 from 2003 to 2010 and decreased at least 210 km3 by 2012. The reduction of both solid and liquid fresh water components indicates a net export of approximately 320 km3 of fresh water from the region occurred between 2010 and 2012 (Figure 6).
References
Hutchings, J. K., and I. G. Rigor (2009), Mechanisms explaining anomalous ice conditions in the Beaufort Sea during 2006 and 2007, Eos Trans. AGU, 89(53), Fall Meet. Suppl., Abstract C51A-0525.
Fowler, C. and M. Tschudi (2003, updated 2013), Polar Pathfinder Daily 25 km EASE-Grid Sea Ice Motion Vectors, Version 1, Boulder, Colorado USA: National Snow and Ice Data Center.
Krishfield, R.A., A. Proshutinsky, K. Tateyama, W.J. Williams, E.C. Carmack, F.A. McLaughlin, and M.-L. Timmermans (2014), Deterioration of perennial sea ice in the Beaufort Gyre from 2003 to 2012 and its impact on the oceanic freshwater cycle, J. Geophy. Res., 119, doi:10.1002/2013JC008999.
Perovich, D. K., J. A. Richter-Menge, K. F. Jones, and B. Light (2008), Sunlight, water, and ice: Extreme Arctic sea ice melt during the summer of 2007, Geophys. Res. Lett., 35, L11501, doi:10.1029/2008GL034007.
Perovich, D. K., T. C. Grenfell, B. Light, B. C. Elder, J. Harbeck, C. Polashenski, W. B. Tucker, and C. Stelmach, (2009), Transpolar observations of the morphological properties of Arctic sea ice J. Geophys. Res., 114, C00A04, doi:10.1029/2008JC004892.
