Fresh water content (FWC) seasonal transformations
1. Seasonal Fresh Water content changes
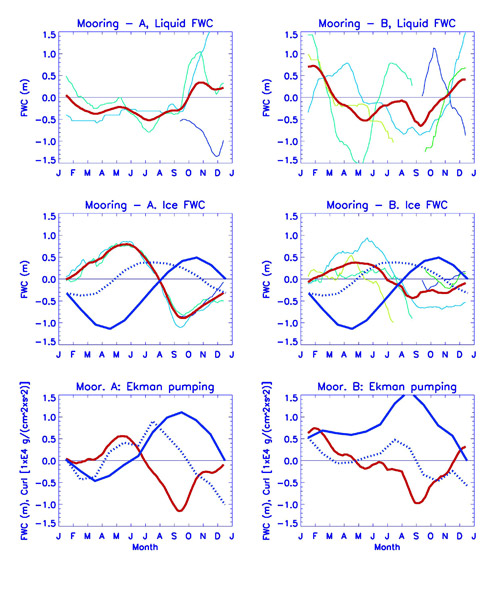
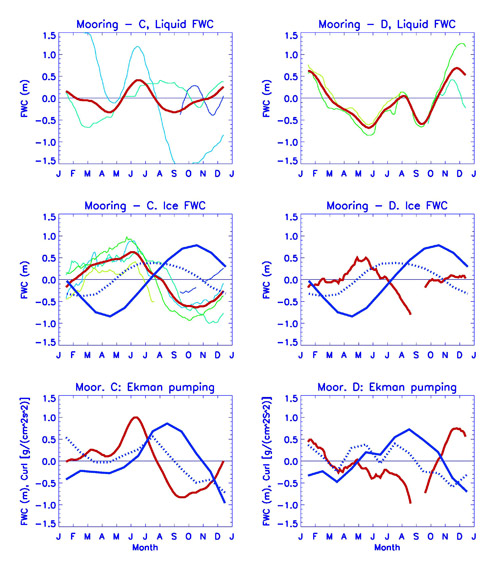
In order to analyze seasonal changes in the Fresh Water Content (FWC) we de-trended the time series of liquid and solid FWC components obtained from observations from four (A, B, C and D) moorings (water salinity and ice draft data, see Proshutinsky et al., 2009) and constructed an average seasonal cycle for each mooring location (Figures 1 and 2, top and middle panels). In general, we observe two peaks in the liquid FWC anomaly during a seasonal cycle, one maximum in December–January and a second, smaller one (less pronounced at mooring A) is typically observed in July-August, depending on mooring location. We can also identify two minima in the liquid FWC anomalies: the first one is typically observed in April–May and the second in September–October. Note however that there is significant interannual variability in the liquid FWC anomalies during the 2000s (Figures 1 and 2).
The sea ice contributions to the liquid FWC variability are well pronounced during a seasonal cycle. Typically, the sea ice starts releasing liquid fresh water into the ocean in the middle of May, and the volume of fresh water from the ice reaches a maximum in the ocean in September-October. Notable however, there is more going on in the BGR FWC seasonal cycle than simple phase change as sizable anomalies in total FWC (ice plus liquid) are observed (Figures 1 and 2, bottom panels).
2. Causes of changes
The seasonal cycle of liquid FWC revealed above is not fully consistent with the conventional understanding of the Arctic Ocean hydrological cycle [EWG, 1997, 1998; Steele et al., 2001, Serreze et al., 2006, see their Figure 11) in which maximum liquid FWC occurs in August and the minimum in April. This understanding was based on an idealized concept of the Arctic without sea ice drift, ocean currents, and mixing. In this simplified case, the seasonal cycle of sea ice growth and melt due to the seasonal changes in solar radiation results in ocean FWC variability influenced only by changes in air temperature (see Figure 1 in Overland [2009]). Our results indicate that there are two minima and two maxima in the mean seasonal cycle of BG liquid FWC and only the April minimum coincides with the "climatologic" view point.
Under pure thermodynamic forcing (i.e., without dynamic processes and mixing) the Arctic Ocean would quickly become a two-layer ocean with a completely fresh upper layer and a salty lower layer (see the description of this distillation process by Aagaard and Carmack, 1989). In the real ocean, the seasonal variability in local liquid FWC (FWCL) is not only influenced by changes in sea ice seasonal transformations (FWCI) under the solar radiation seasonal cycle, but is also forced by changes in Ekman pumping (EP) (FWCE), ocean mixing (FWCM) and by changes in fresh water sources and sinks (FWCSS). The latter includes precipitation, evaporation, river runoff and fresh water fluxes via ocean straits. We may then express FWCL(t) (where t is time) as the sum:
FWCL(t) = FWCI(t) + FWCE(t) + FWCM(t) + FWCSS(t) (1)
Based on (1) we speculate that the Arctic Ocean FWCL seasonal cycle should differ significantly from region to region, complicating assessments and intercomparisons. For example, in coastal regions influenced most directly by river runoff, the maximum FWCL is observed in the middle of July (following maximum river runoff in June) and the minimum is observed at the end of April (minimum river runoff and maximum land-fast ice thickness). Our observations in the BGR indicate that the seasonal fresh water anomalies associated with changes in sea ice thickness (FWCI) follow closely the seasonal anomalies of air temperature (Figures 1 and 2, middle panel) but do not explain fully the observed seasonal FWCL cycle (Figures 1 and 2, top panels). The influence of fresh water sources and sinks (FWCSS) in the formation of summer positive FWCL anomalies in the BG is questionable because the maximum river runoff and the maximum inflow of the fresh water from the Bering Sea are observed in June–July [Woodgate et al., 2005] and these signals cannot reach the central part of the Beaufort Gyre by August. The seasonal FWC anomalies in precipitation are mostly associated with snow (rain is very rare in the BGR). The information about changes in snow depth and snow water equivalent is already taken into account by our sea ice draft measurements as discussed above. Ocean mixing (FWCM) is an important factor which is able to preserve fresh water anomalies in the region. It depends on many oceanic internal and external parameters. The majority of them are associated with wind forcing (or sea ice stresses at the ocean surface) and the ocean vertical stratification. For this study we assume that FWCM can be included in the term of Ekman Pumping (EP) which is also a function of wind stress and ocean stratification.
The EP forcing, which influences fresh water accumulation and release [Hunkins and Whitehead, 1992; Proshutinsky et al, 2002, hereafter P2002] in the BG, was evaluated using time series of wind curl averaged over the BGR or in the vicinity of each mooring. The 2003-2007 NCAR/NCEP Reanalysis 1 wind curl estimates were de-trended and a mean seasonal cycle was constructed for each mooring location. The climatologic annual-mean wind stress curl over the BG is negative (not shown, see P2002, Yang and Comiso [2007], Yang [2009]) and the EP is positive leading to the accumulation of FWC in the BG. In the typical seasonal cycle (Figures 1 and 2, bottom panel, blue lines) the wind stress curl anomaly usually reaches maximum in July–August (minimum EP) and minimum in December–January (maximum EP); and the cumulative wind stress curl (solid blue line) indicates that the accumulation of fresh water in the BGR usually occurs between November and June (negative wind stress curl anomaly). Starting in June–July and until October–November the wind stress curl does not support fresh water build up in the region and the BG can even release the fresh water because of the reduction or reversal of EP.
On the other hand, the role of EP could be estimated from equation (1). Knowing anomalies of liquid (FWCL) and solid (FWCI) FWCs and assuming that other factors (except EP) are already taken into account in FWCE or FWCI or are insignificant, the anomalies in EP can be expressed as a residual:
FWCE(t) = FWCL(t) - FWCI(t) (2)
These anomalies in liquid FWCL due to EP were calculated for each mooring and are shown in Figures 1 and 2 (bottom panels, red line). One sees that these anomalies correlate well with the wind stress curl anomalies.
Based on these results we surmise that the second maximum in BG FWC observed in summer (June–August, depending on mooring) is a result of interplay between EP and fresh water changes due to sea ice seasonal transformations. The FWCL decreases from January to June–July due to reduction of EP and due to sea ice formation and salt release. At this time both factors work together towards a reduction of FWCL. In June-July, sea ice starts melting and FWCL increases while EP is weakening or relatively stable and does not play an important role. In August, EP reaches its minimum or even becomes negative (i.e. forces upwelling in the central BGR resulting in relaxation of horizontal density/salinity gradients, weakening the BG anticyclonic circulation). Sea ice at this time melts but the rate of melting is decreasing. As a result, the EP effect (FWCE) dominates changes in FWCI (due to ice melt) and FWCL in the region reaches its second minimum. In September, both factors contribute to the increase of FWCL: EP increases and sea ice continues melting but in October EP is the major influence on FWCL while sea ice starts growing reducing FWCL.
These simple considerations demonstrate that the departure of the BG FWCL seasonal cycle from an ideal ice/ocean state is related to the wind forcing. Respectively, the FWCL maximum observed in November–January (2-3 months later than expected from thermodynamic sea ice transformations) is forced by the atmospheric anticyclonic circulation cell over the BG region.
References
Aagaard, K., and E. C. Carmack (1989), The role of sea ice and freshwater in the Arctic circulation, J. Geophys. Res., 94, 14,485–14,498, doi:10.1029/JC094iC10p14485.
Hunkins K., J. A. Whitehead (1992), Laboratory simulation of exchange through Fram Strait. J. Geophys. Res., 97(C7):11,299–11,321.
Overland, J. E. (2009), Meteorology of the Beaufort Sea, J. Geophys. Res., 114, C00A07, doi:10.1029/2008JC004861.
Proshutinsky, A., R. H. Bourke, and F. A. McLaughlin (2002), The role of the Beaufort Gyre in Arctic climate variability: Seasonal to decadal climate scales, Geophys. Res. Lett., 29(23), 2100, doi:10.1029/2002GL015847.
Proshutinsky, A., R. Krishfield, M.-L. Timmermans, J. Toole, E. Carmack, F. McLaughlin, W. J. Williams, S. Zimmermann, M. Itoh, and K. Shimada (2009), Beaufort Gyre freshwater reservoir: State and variability from observations, J. Geophys. Res., 114, C00A10, doi:10.1029/2008JC005104.
Serreze, M. C., A. P. Barrett, A. G. Slater, R. A. Woodgate, K. Aagaard, R. B. Lammers, M. Steele, R. Moritz, M. Meredith, and C. M. Lee (2006), The large-scale fresh water cycle of the Arctic, J. Geophys. Res., 111, C11010, doi:10.1029/2005JC003424.
Steele, M., R. Morley, and W. Ermold (2001), PHC: A Global Ocean Hydrography with a High-Quality Arctic Ocean. J. Climate, 14, 2079–2087.
Woodgate R. A., K. Aagaard, T. J. Weingartner (2005), Monthly temperature, salinity, and transport variability of the Bering Strait through flow, Geophys. Res. Lett., 32, L04601, doi:10.1029/2004GL021880.
Yang, J. Y., J. C. Comiso, D. Walsh, R. Krishfield, S. Honjo (2004), Storm-driven mixing and potential impact on the Arctic Ocean, J. Geophys. Res., vol. 109, 10.1029/2001JC00124.
Yang, J. Seasonal and interannual variability of EP in the Beaufort Sea, submitted to Journal of Geophysical Research, 2009.

