Sea surface pCO2 fluxes
Sea surface pCO2 fluxes
Michael D. DeGradpre
Department of Chemistry, University of Montana, Missoula, Montana,USA
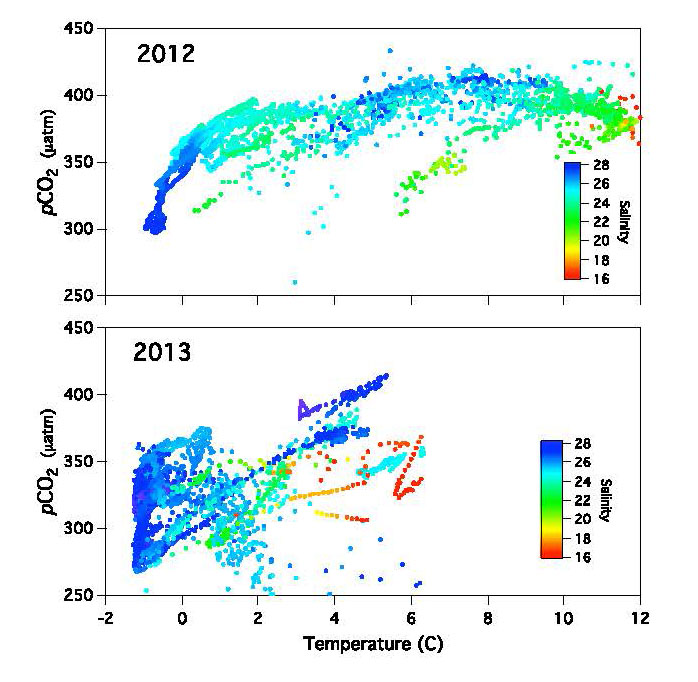
In 2012, sea ice extent dropped to 3.4 million km2, the lowest level since the satellite record began. Ice extent rebounded in 2013 to 5.1 million km2. The shipboard pCO2 measurements (Figure 1) show that offshore open water had pCO2 levels closer to atmospheric saturation whereas ice-covered areas were typically >100 µatm below saturation. The mechanisms for producing the higher open water pCO2 are not well understood but are possibly caused by the increase in atmospheric exchange, vertical mixing and heating that come with no ice coverage. We examined these mechanisms through correlations and modeling.
The variability between the two years is compared by plotting the pCO2 versus temperature (Figure 2). In 2012, there was a much larger range of temperature and pCO2 even though the two data sets were obtained at the same time of the year and roughly over the same cruise track (Figure 1). The highest salinity water (26-28) typically had the lowest pCO2 levels (<350 µatm) and these levels correspond to highly ice-covered areas. Model calculations (not shown) suggest that much of the difference between 2012 and 2013 is from air-sea gas exchange and heating of the sea surface. It does not appear that biological production is a significant factor in offsetting the increase, a consequence of the lack of nutrients in the mixed-layer (i.e., increased light penetration does not increase production at the surface). These processes are likely to reduce the effectiveness of the Arctic Ocean as a CO2 sink as ice-cover continues to decline in the coming years. The expected rapid increase in CO2 levels will accelerate ocean acidification, with aragonite becoming undersaturated (~0.9,) when the sea surface reaches atmospheric CO2 saturation (data not shown).
References
Islam, F., DeGrandpre, M., Beatty, C., Krishfield, R., and J. Toole (2016). Gas exchange of CO2 and O2 in partially ice-covered regions of the Arctic Ocean investigated using in situ sensors, IOP Conf. Series: Earth and Environmental Science, 35, doi:10.1088/1755-1315/35/1/012018.
Evans, W., Mathis, J.T., Cross, J.N., Bates, N.R., Frey, K.E., Else, B.G.T., Papkyriakou, T.N., DeGrandpre, M.D., Islam, F., Cai, W.-J., Chen, B., Yamamoto-Kawai, M., Miller, L.A., Carmack, E., Williams, W.J. and T. Takahashi (2015). Sea-air CO2 exchange in the western Arctic coastal ocean, Global Biogeochem. Cycles, 10.1002/2015GB005153.

