Dispatch 15: Warm Waters
Mary-Louise Timmermans
September 21, 2020
The latest data coming from the Louis and her team indicate they have encountered some "warm" waters, even as far poleward as 77 degrees North. In recent days, the team has deployed two Ice-Tethered Profilers (ITPs, see www.whoi.edu/itp) which return the measurements that allow us to track and study these warm waters. You can read about how an ITP deploument in Dispatch 13, and we thought it would be interesting to complement those with an overview of the ocean conditions that are being sampled.
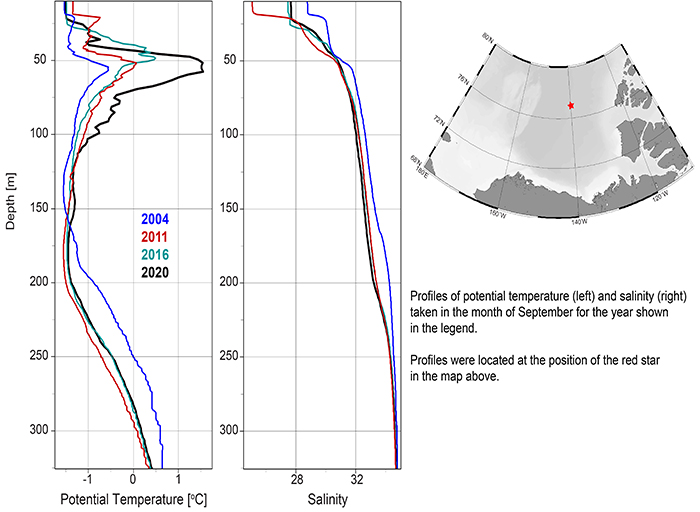
ITP number 121 was deployed on a 2.3-m thick ice floe near the location of the red star in the map (Figure 1) on September 20, 2020. At that location, the ITP returned temperature measurements as a function of depth in the water column shown in Figure 1 (the black profile, recorded by the ITP on September 21, 2020). A prominent feature of this profile is the warm layer of water centered around 50 meters depth. This warm water derives from the Pacific Ocean and it is warmed by the sun in the summertime after it enters the Arctic through Bering Strait; for this reason, we refer to it as Pacific Summer Water (PSW). A maximum temperature of less than 2 degrees C perhaps doesn't seem very warm (certainly not ideal conditions for swimming!), but the amount of heat contained in this warm layer is enough to melt the entirety of the overlying 2.3-m thick ice floe. The ice is safe, however, because the PSW layer is saltier (and therefore more dense) than the cooler, fresher waters at the surface - the warm layer and its heat remain trapped at depth.
Sea-ice volume depends critically on the fate of the heat in the PSW layer, which is compelling motivation for our studies of the origins and evolution of the layer over seasons and many years. To examine this year in context with previous years, we have plotted temperature profiles from the same location and the same time of year (in September) as the profile made by ITP 121 for a selection of different years, starting in 2004 (Figure 1). A steady march of the PSW to warmer temperatures over the years is evident, with 2020 being unusually warm - about 2 degrees C warmer than in 2004.
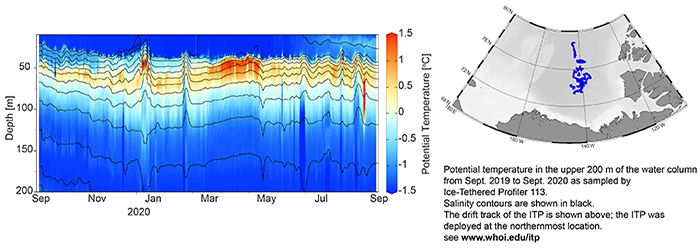
For some more background on the PSW layer, we can examine the temperature sampled by a different ITP (ITP 113) profiling in the Beaufort Gyre region between September 2019 and September 2020 (Figure 2). The temperature clearly shows the presence of the warm PSW throughout the year, although with spatial and temporal variability that give us clues about how heat is transported. As the newly-deployed ITPs (numbers 120 and 121) sample over the coming weeks and months, it will be especially interesting to assess the spatial distribution of the unusual warmth observed in the first few profiles, and how it changes as we head into winter.

