ITP 14 Data Description
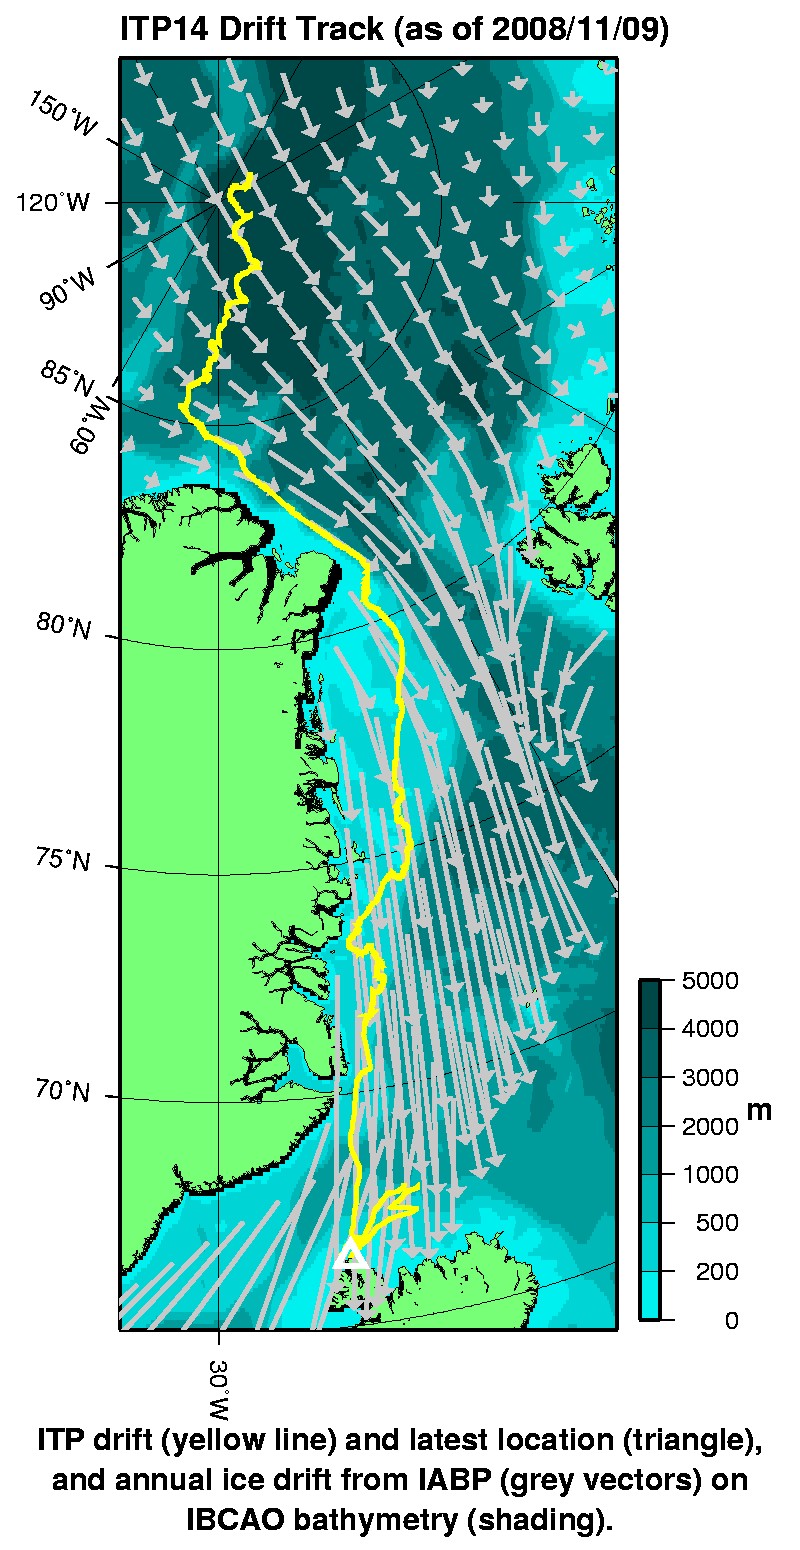
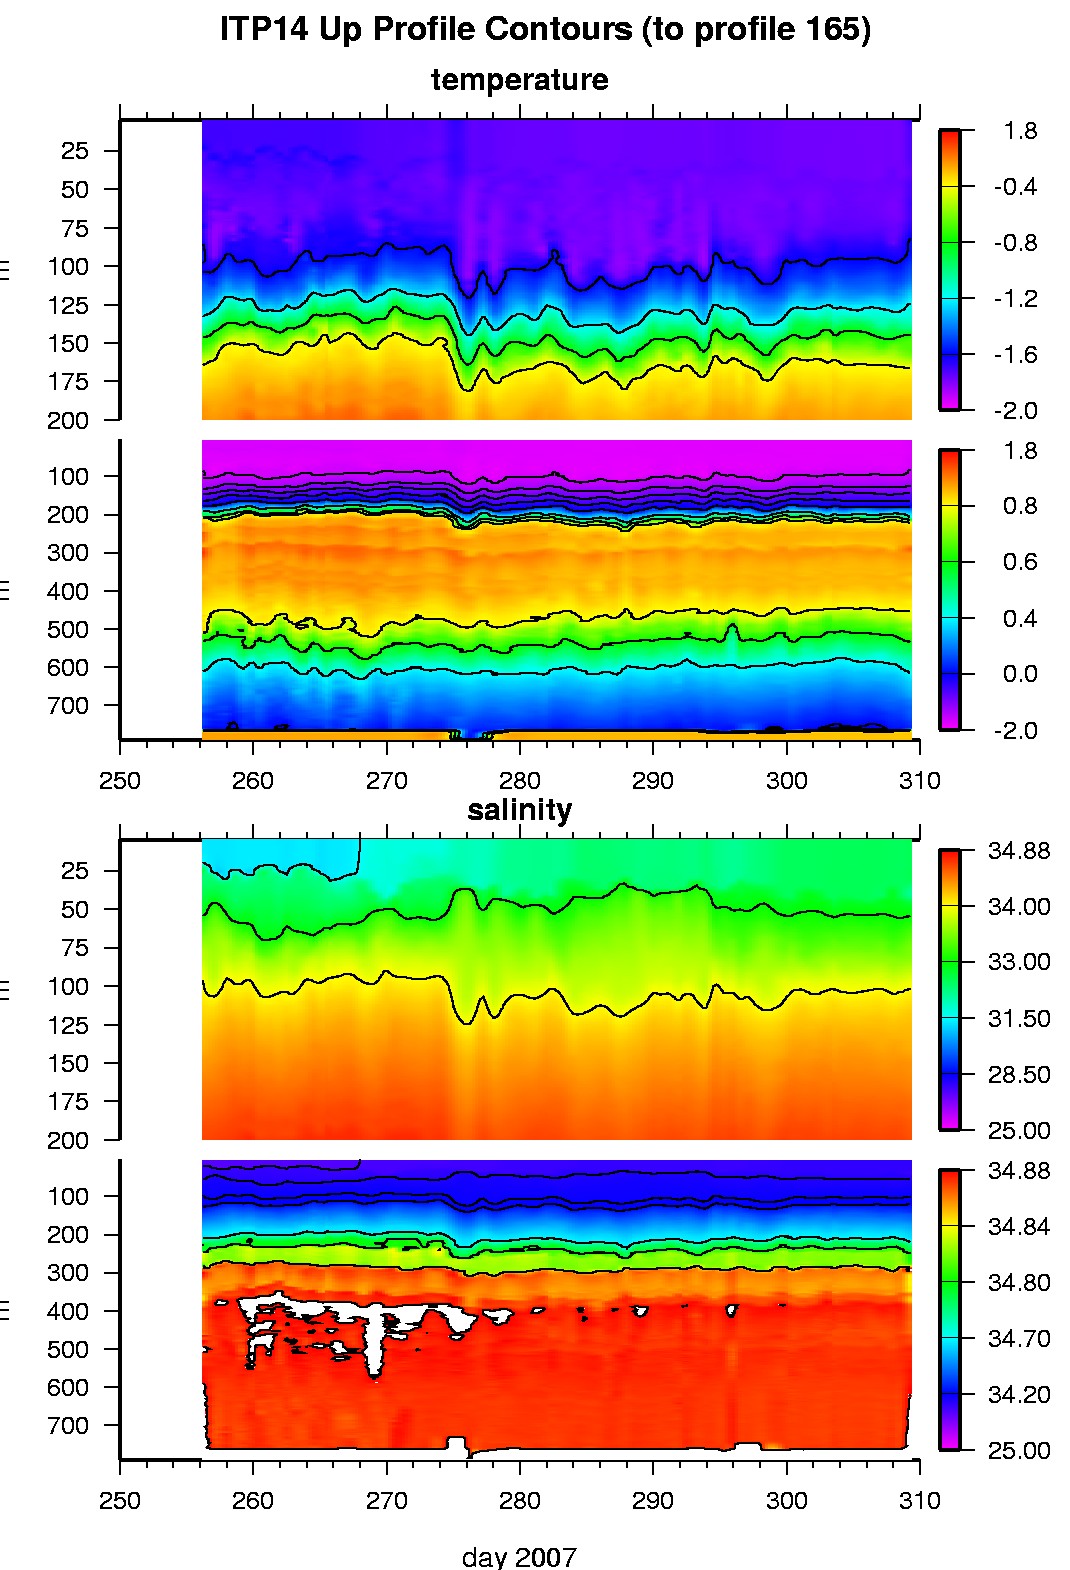
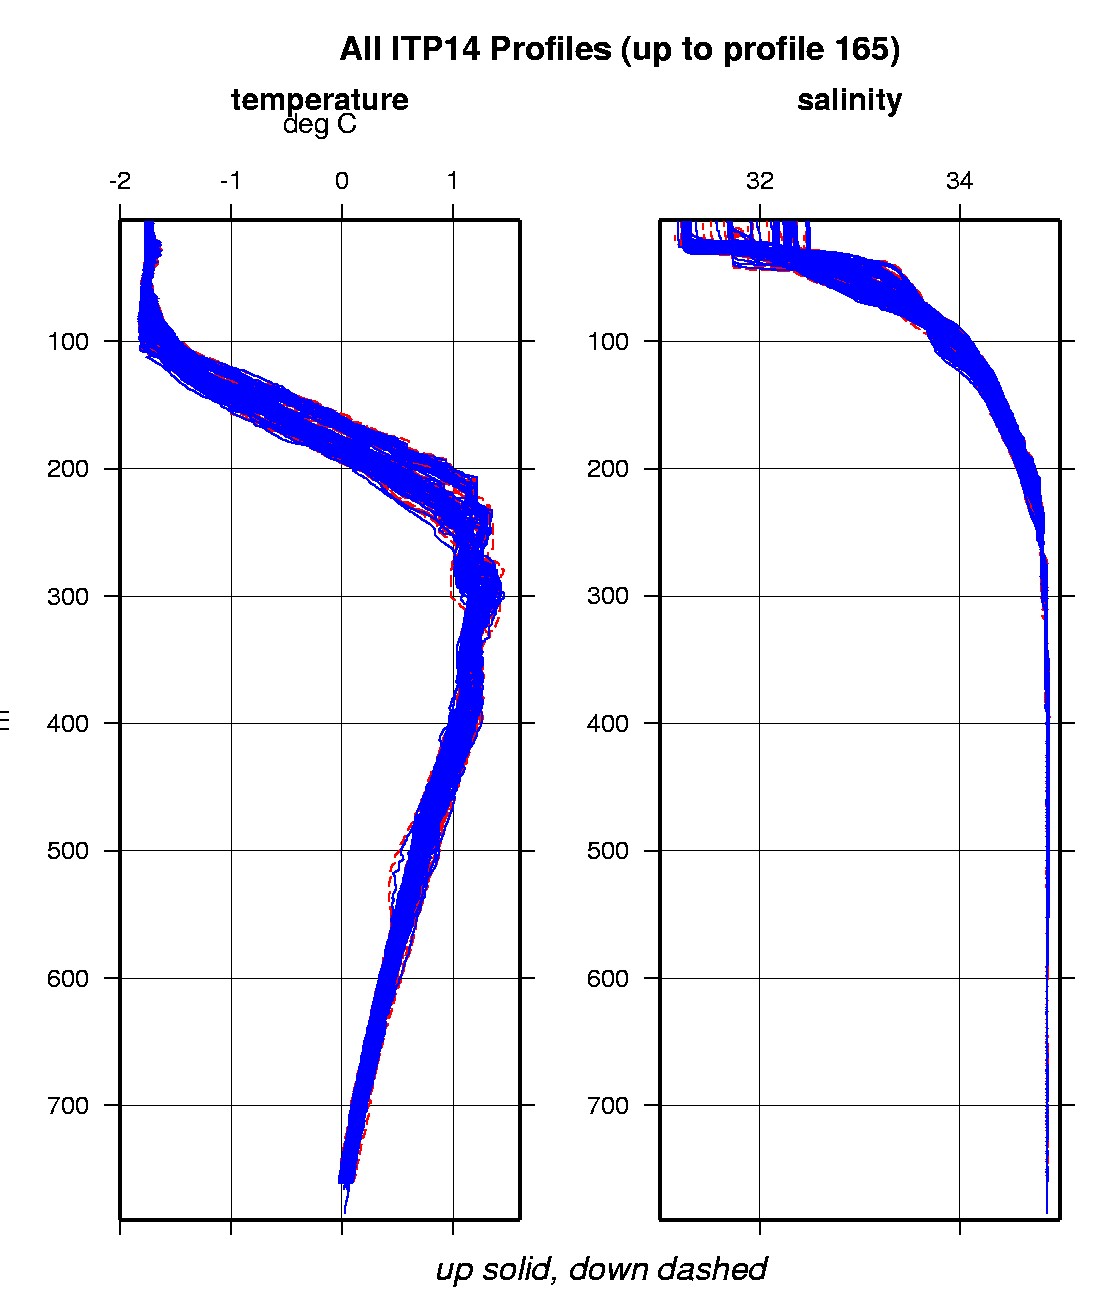
Due to the proximity to the Fram Strait, the ITP profiler was configured to operate with an accelerated sampling schedule of 3 one-way profiles each day. In the surface package, the GPS receiver was powered every hour to obtain locations, and buoy temperature and battery voltage status were recorded. The unit was deployed to the east of the Lomonosov Ridge and drifted to the south largely paralleling the ridge. Early on (as delineated in Data Processing section), features perhaps resembling remnant thermohaline staircases were observed, perhaps indicating that the system briefly crossed over a front separating Atlantic and Pacific sectors. Without warning, the underwater unit suddenly ceased ringing the surface unit after 53 days.
The plots to the right are of the final, calibrated, edited data (as opposed to the raw data presented on the active instrument pages).
See the Data Products tab to the left for descriptions of the three levels (I, II, III) of data processing and to access all data.
ITP 14 data can also be found at the links below:
Level II hourly buoy location data in ASCII format: itp14rawlocs.dat
Level III 1-Hz processed profile data in MATLAB format: itp14cormat.tar.Z and itp14cormat.zip
Level III 1-db bin-averaged processed profile data in MATLAB format: itp14final.mat
Level III 1-db bin-averaged processed profile data in ASCII format: itp14final.tar.Z and itp14final.zip


