ITP28 Data Description
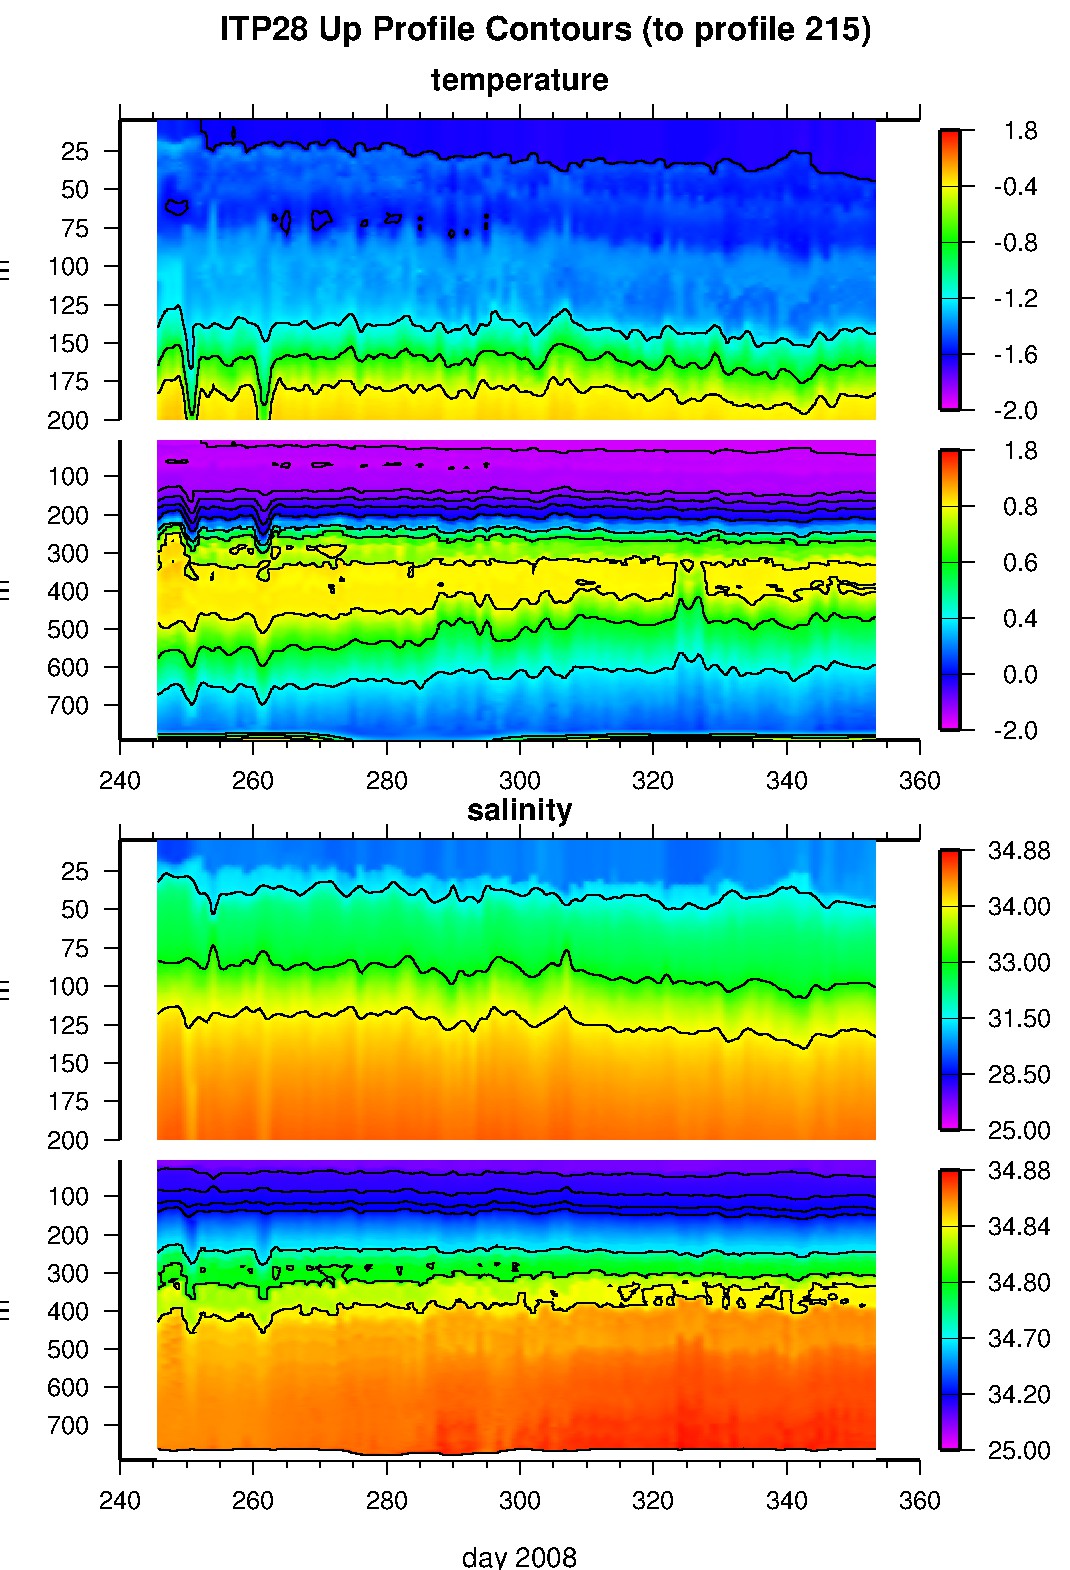
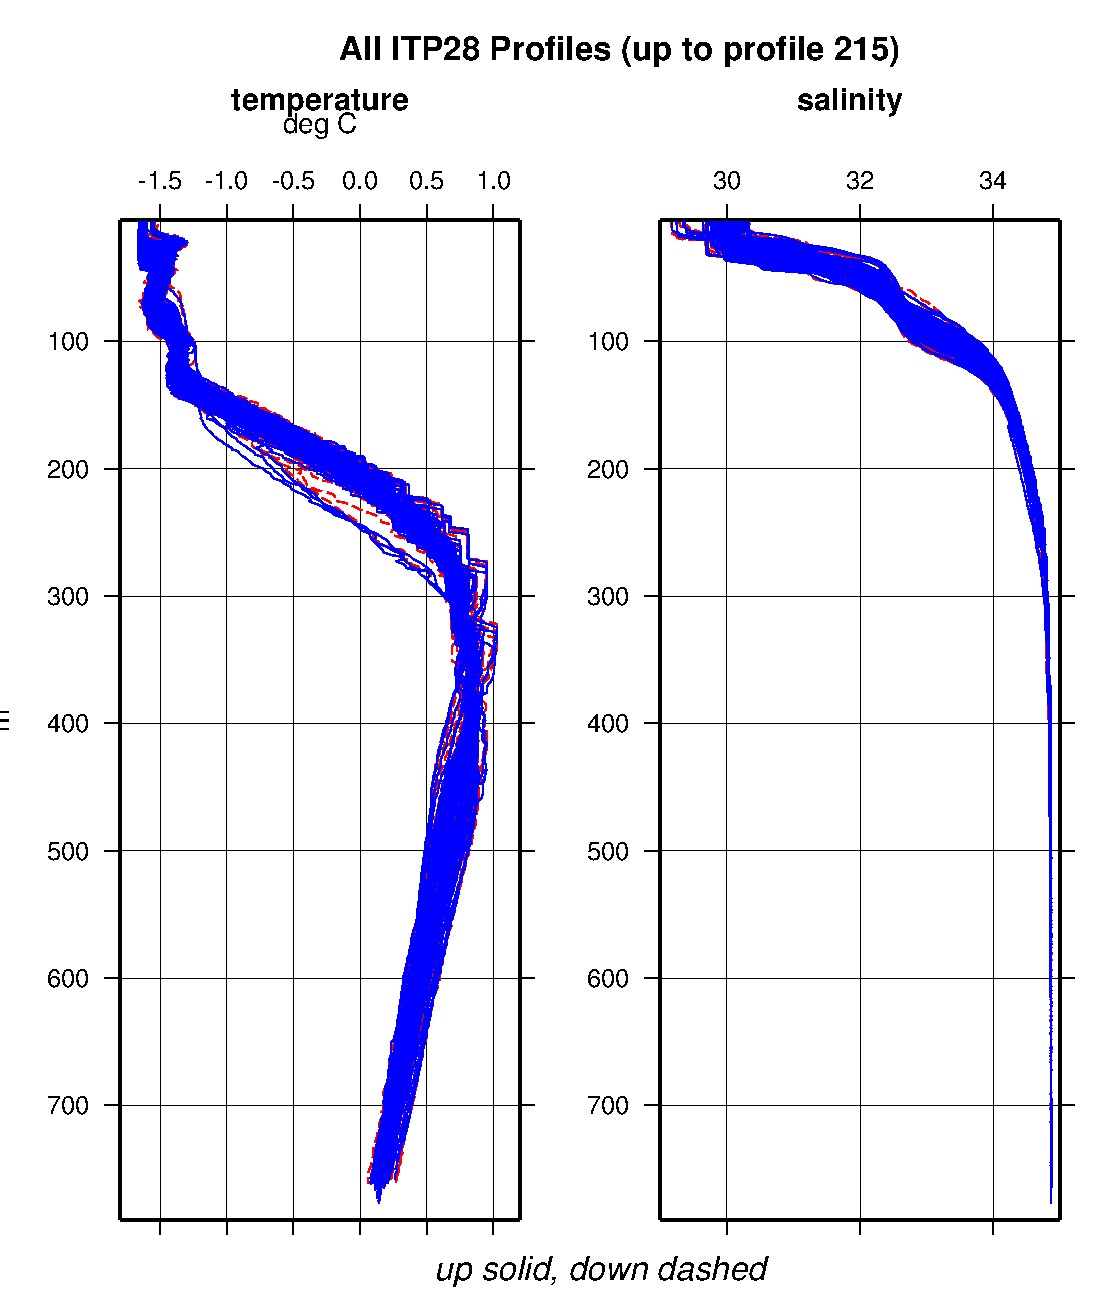
The ITP profiler was configured to operate with a standard sampling schedule of 2 one-way profiles between 7 and 750 m depth each day. In the surface package, the GPS receiver was powered hourly to obtain locations, and buoy temperature and battery voltage status were recorded. Buoy drift speeds stayed mostly between 10 and 30 cm/s, with a few spikes exceeding 40 cm/s.
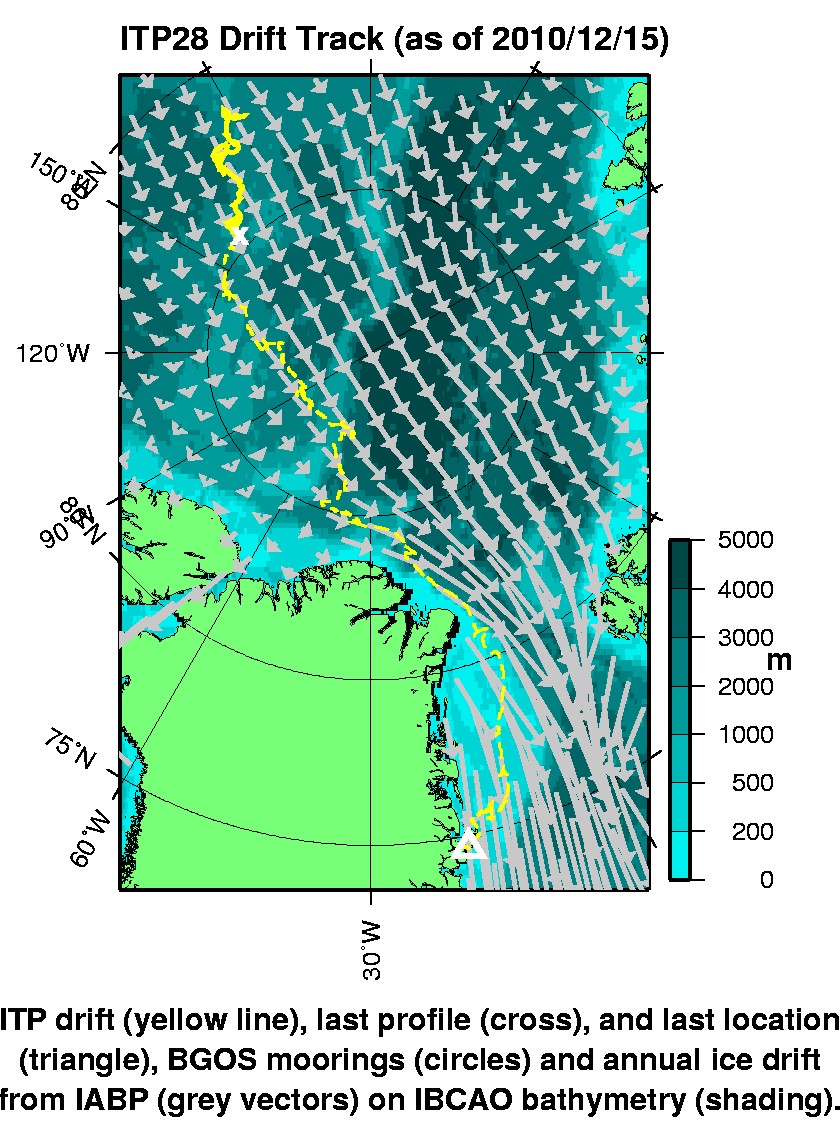
After 108 days of normal operation, the profiler began having difficulty transferring files to the surface unit on December 18, 2008. The profiler continued to ring the surface unit on the inductive modem circuit for three more days, but was not able to successfully continue file transfers. On this day, the surface unit began intermittently restarting itself indicating a potential hardware problem, and no more rings were heard from the underwater package. However, status information, including GPS locations, continued to be obtained and telemetered for 2 more years as the system drifted out of the Makarov basin, and continued along the northeast coast of Greenland and through Fram Strait.
See the Data Products tab to the left for descriptions of the three levels (I, II, III) of data processing and to access all data.
ITP 28 data can also be found at the links below:
Level II hourly buoy location data in ASCII format: itp28rawlocs.dat
Level III 1-Hz processed profile data in MATLAB format: itp28cormat.tar.Z and itp28cormat.zip
Level III 1-db bin-averaged processed profile data in MATLAB format: itp28final.mat
Level III 1-db bin-averaged processed profile data in ASCII format: itp28final.tar.Z and itp28final.zip


