ITP 6 Data Description
The ITP profiler was configured to operate on a standard burst sampling schedule of 2 one-way profiles between 9 and 760 m depth each day at 0000 and 0600 UTC. The times were chosen so as to avoid aliasing any tidal signals. GPS locations and buoy temperature and battery voltage status were recorded every hour in the surface package.
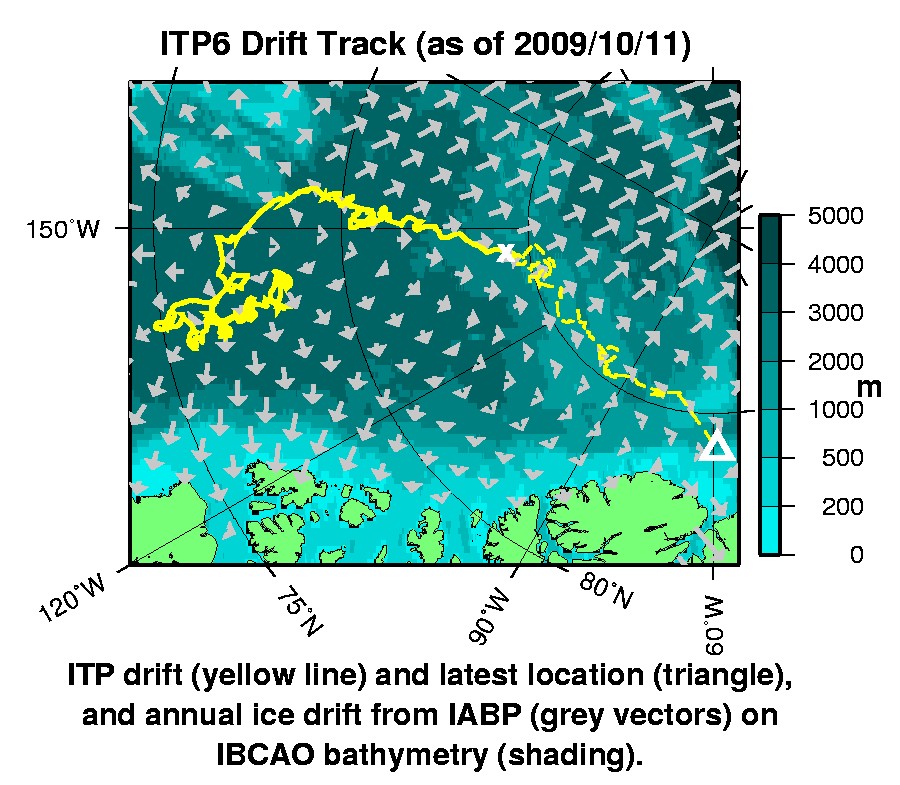
During the first year, the ITP generally drifted southward in the center of the anticyclonic circulation center of the Beaufort Gyre, then ceased communications (presumably ridged under the icefloe) for 2 months in 2007 and 8 months in 2008 (where cotemporaneous IMB locations are used for the ITP). Stored data for profiles acquired during these periods were recovered when the surface buoy resurfaced, after drifting north and eventually west toward the Canadian Archipelago. The profiler ceased operating in July 2008 and communications with the surface package ceased for good in October 2009 about 100 m north of Ellsmere Island over the continental slope.
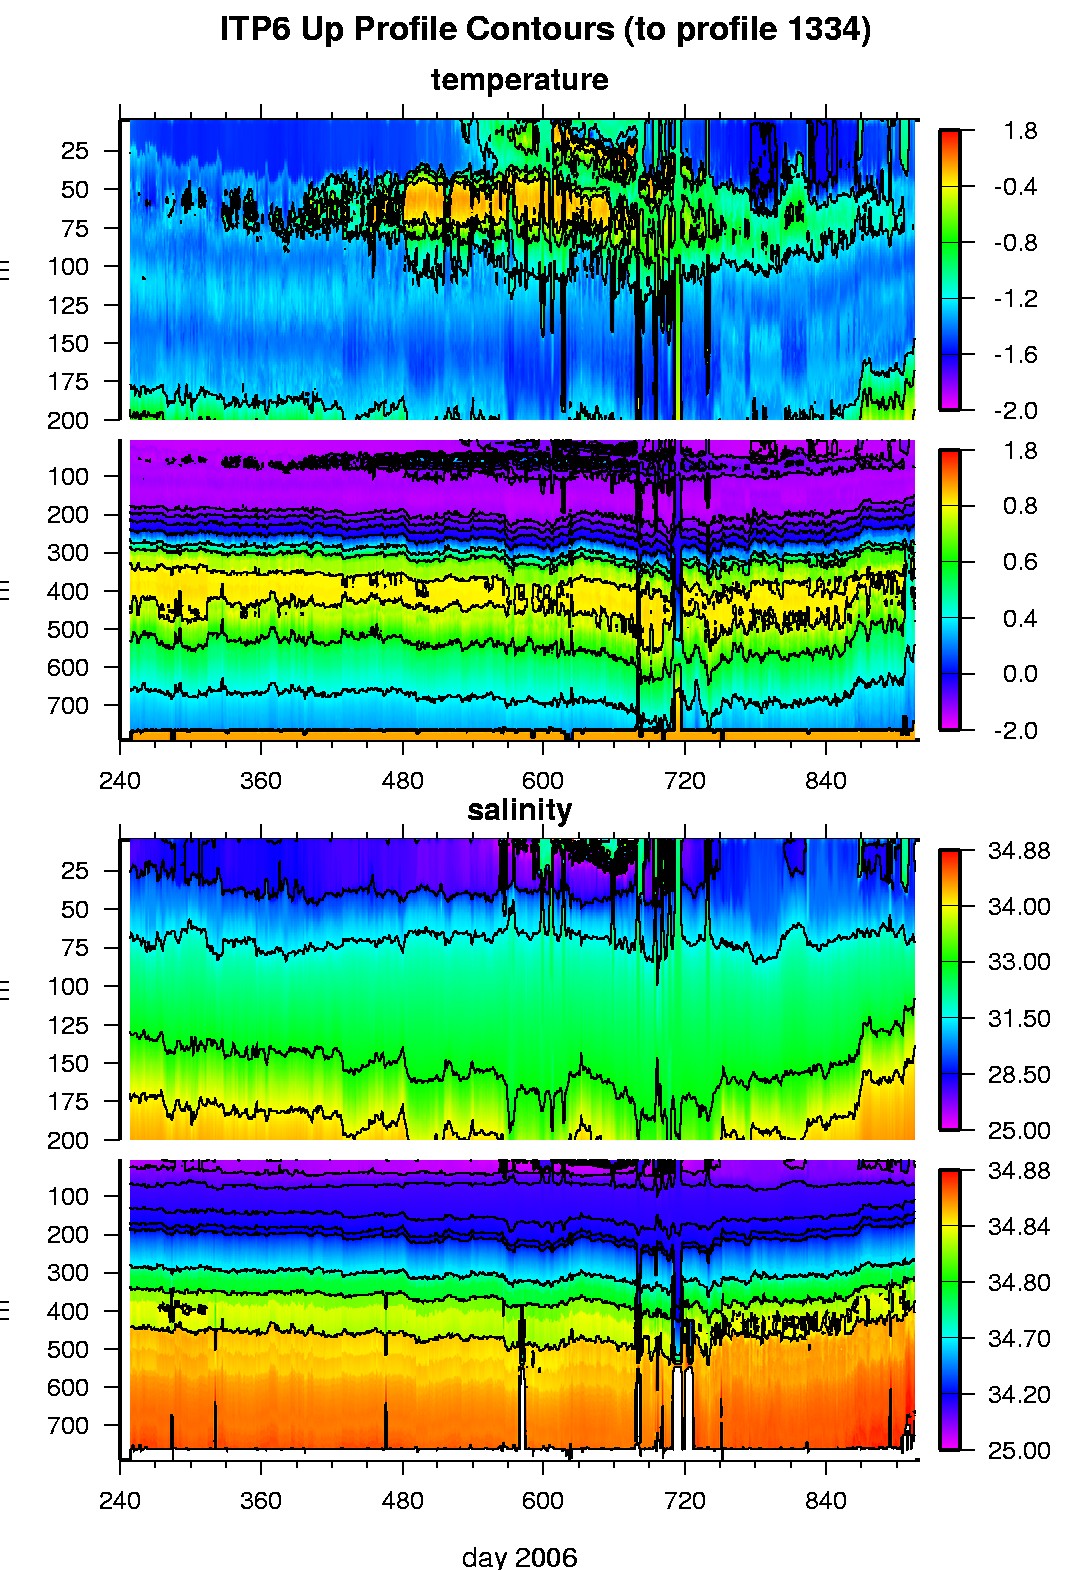
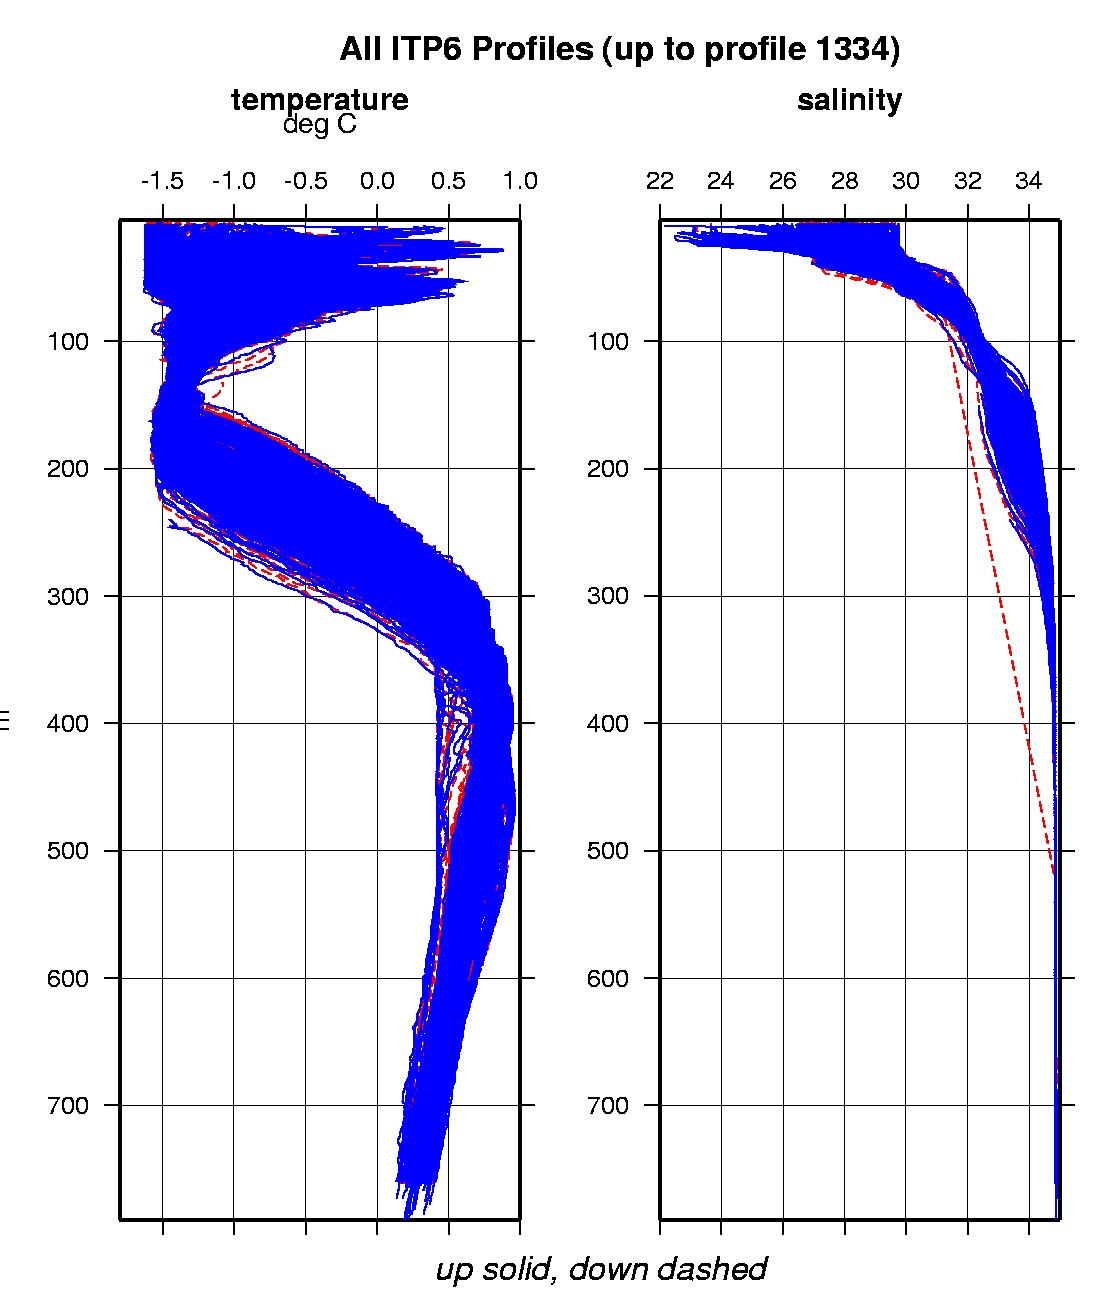
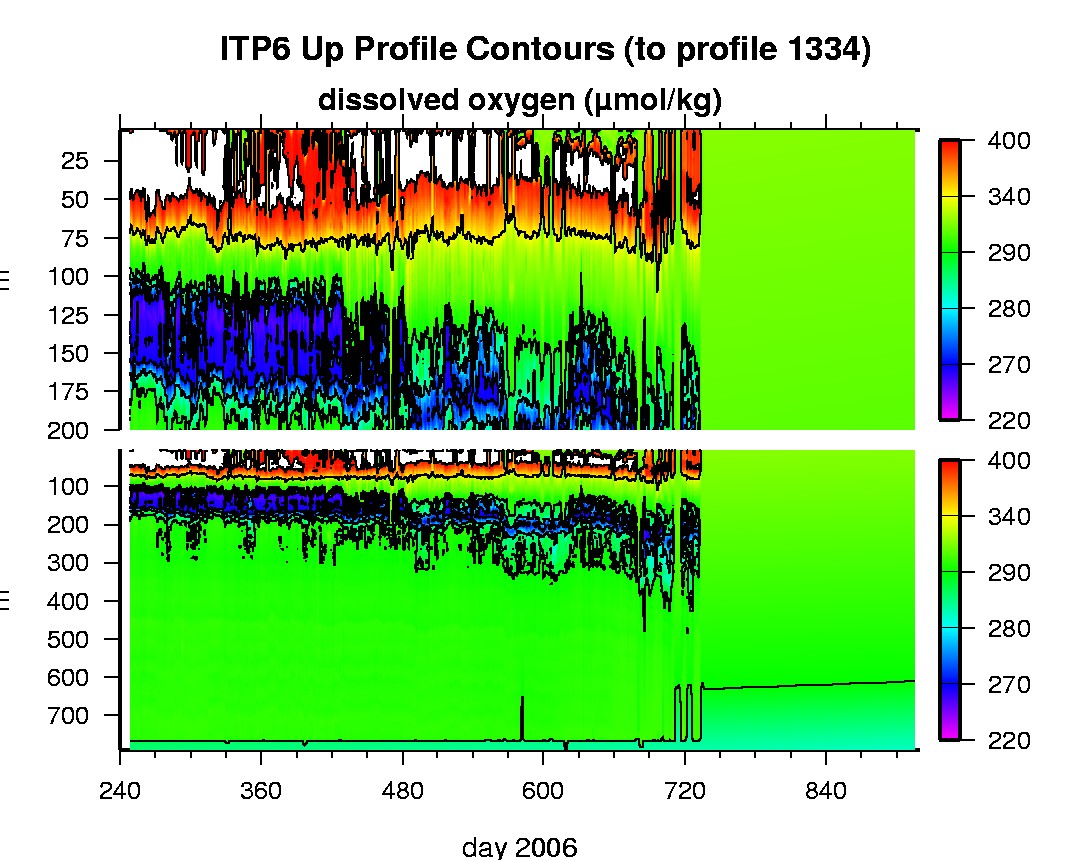
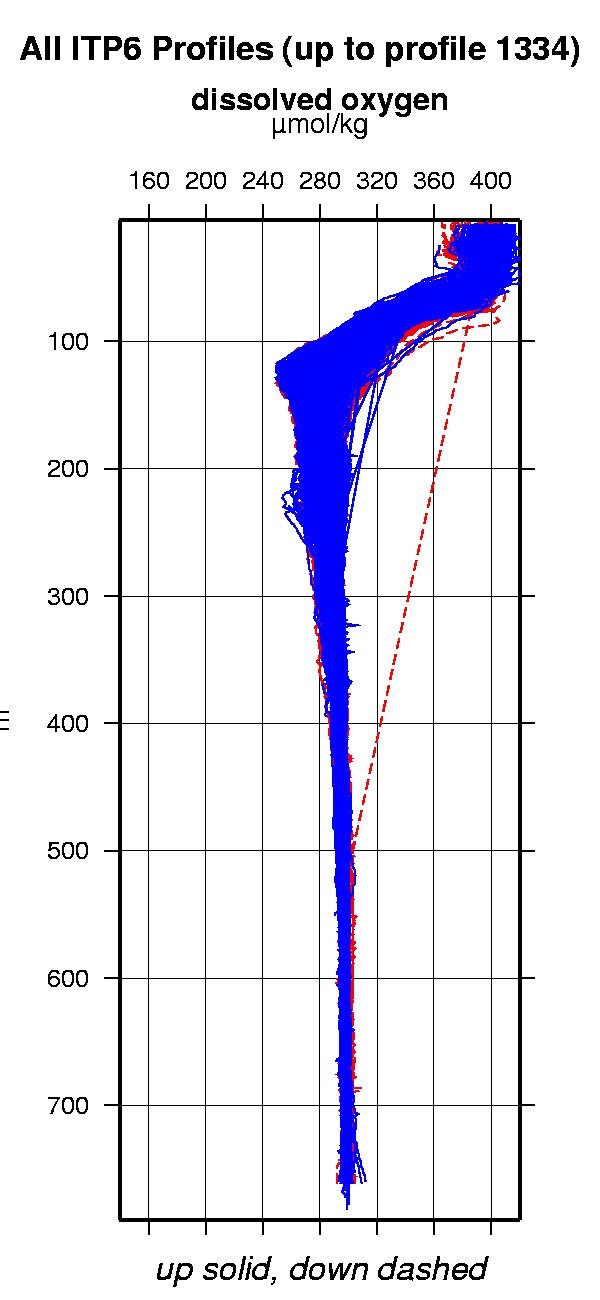
The temperature and salinity data acquired by the system are obtained entirely within the thermohaline staircase region. They highlight the evolution of the near-surface temperature maximum layer and are largely absent of eddies. The dissolved oxygen dataset is the first of its kind, covering over an entire annual cycle unattended beneath the Arctic ice pack with high vertical resolution.
The plots to the right are of the final, calibrated, edited data (as opposed to the raw data presented on the active instrument pages).
See the Data Products tab to the left for descriptions of the three levels (I, II, III) of data processing and to access all data.
ITP 6 data can also be found at the links below:
Level II hourly buoy location data in ASCII format: itp6rawlocs.dat
Level III 1-Hz processed profile data in MATLAB format: itp6cormat.tar.Z and itp6cormat.zip
Level III 1-db bin-averaged processed profile data in MATLAB format: itp6final.mat
Level III 1-db bin-averaged processed profile data in ASCII format: itp6final.tar.Z and itp6final.zip
