ITP41 Data Description
The ITP profiler was configured to operate with a standard sampling schedule of 2 one-way profiles between 7 and 750 m depth each day. In the surface package, the GPS receiver was powered hourly to obtain locations, and buoy temperature and battery voltage status were recorded.
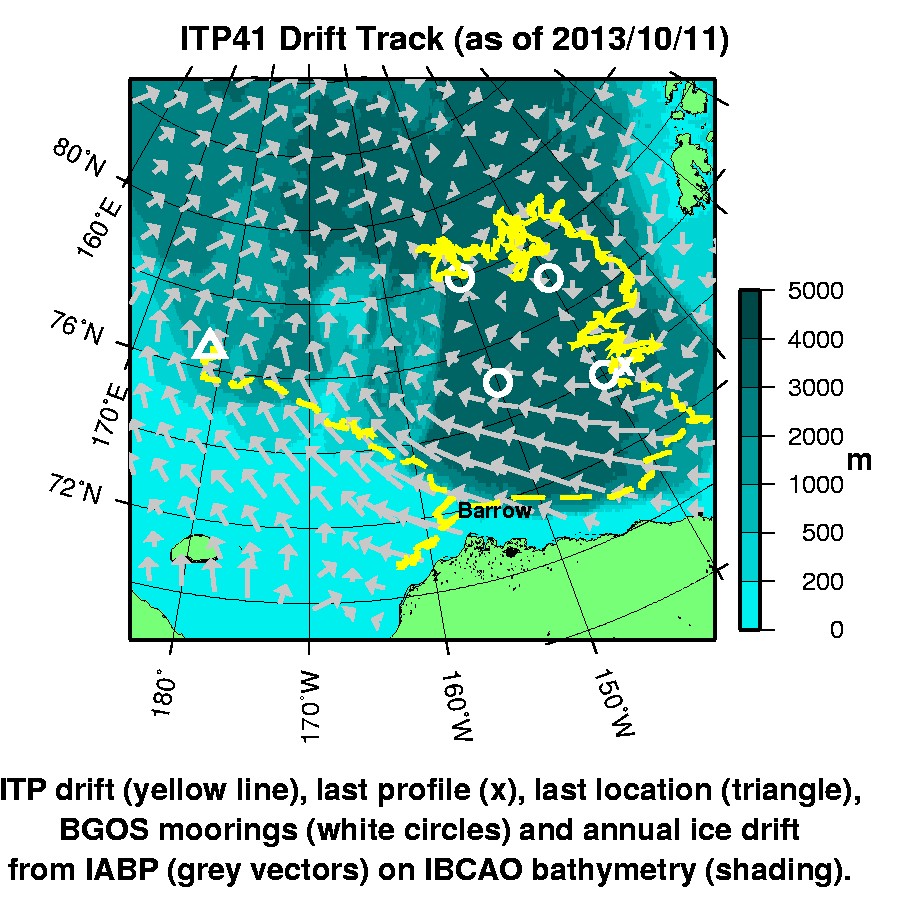
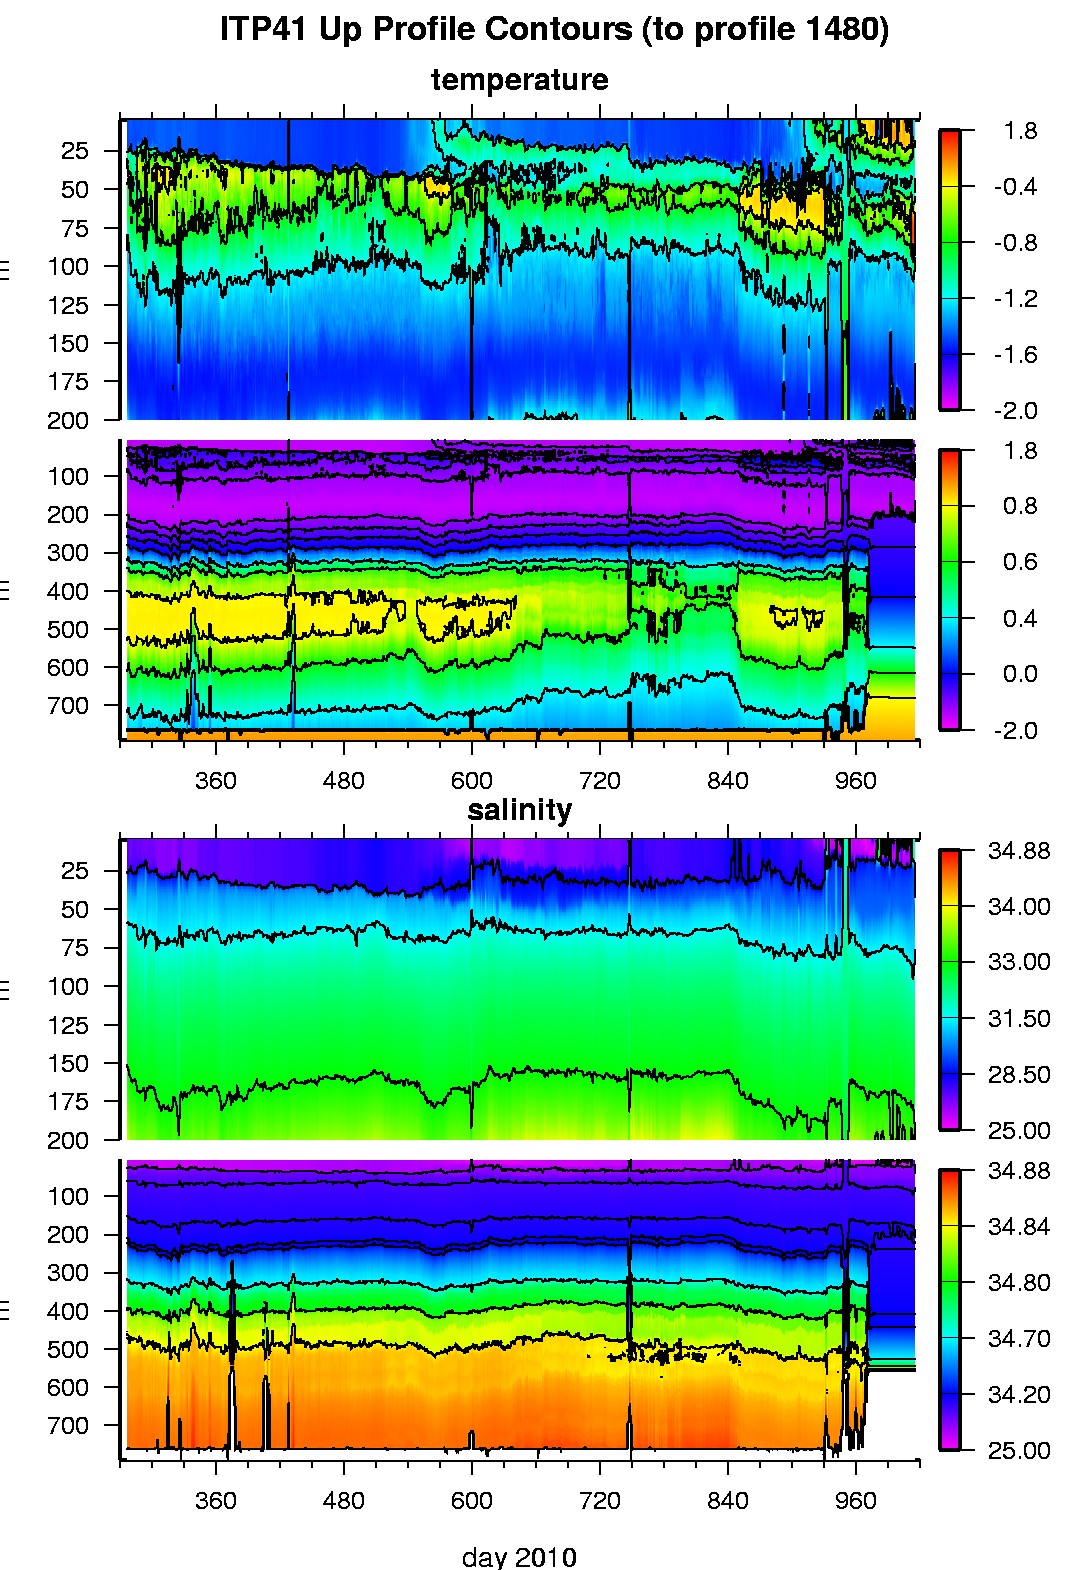
Deployed in the northwest Beaufort Gyre, the buoy drifted with the anticyclonic circulation first east between 77 and 79 °N latitude, then south between 130 and 140 °W longitude. The hydrographic time series that was broadcast during this period shows the development of near surface temperature maximum (and freshwater) layers in June-July of both 2011 and 2012. After 2 years, the profiler battery expired, but the buoy continued south, then west, drifting up and back down Barrow Canyon, then northwesterly across the shallow topography just off of the Chukchi Shelf. Three years after deployment, the surface package ceased communicating over the southern Mendeleyev Ridge after drifting over 9800 km.
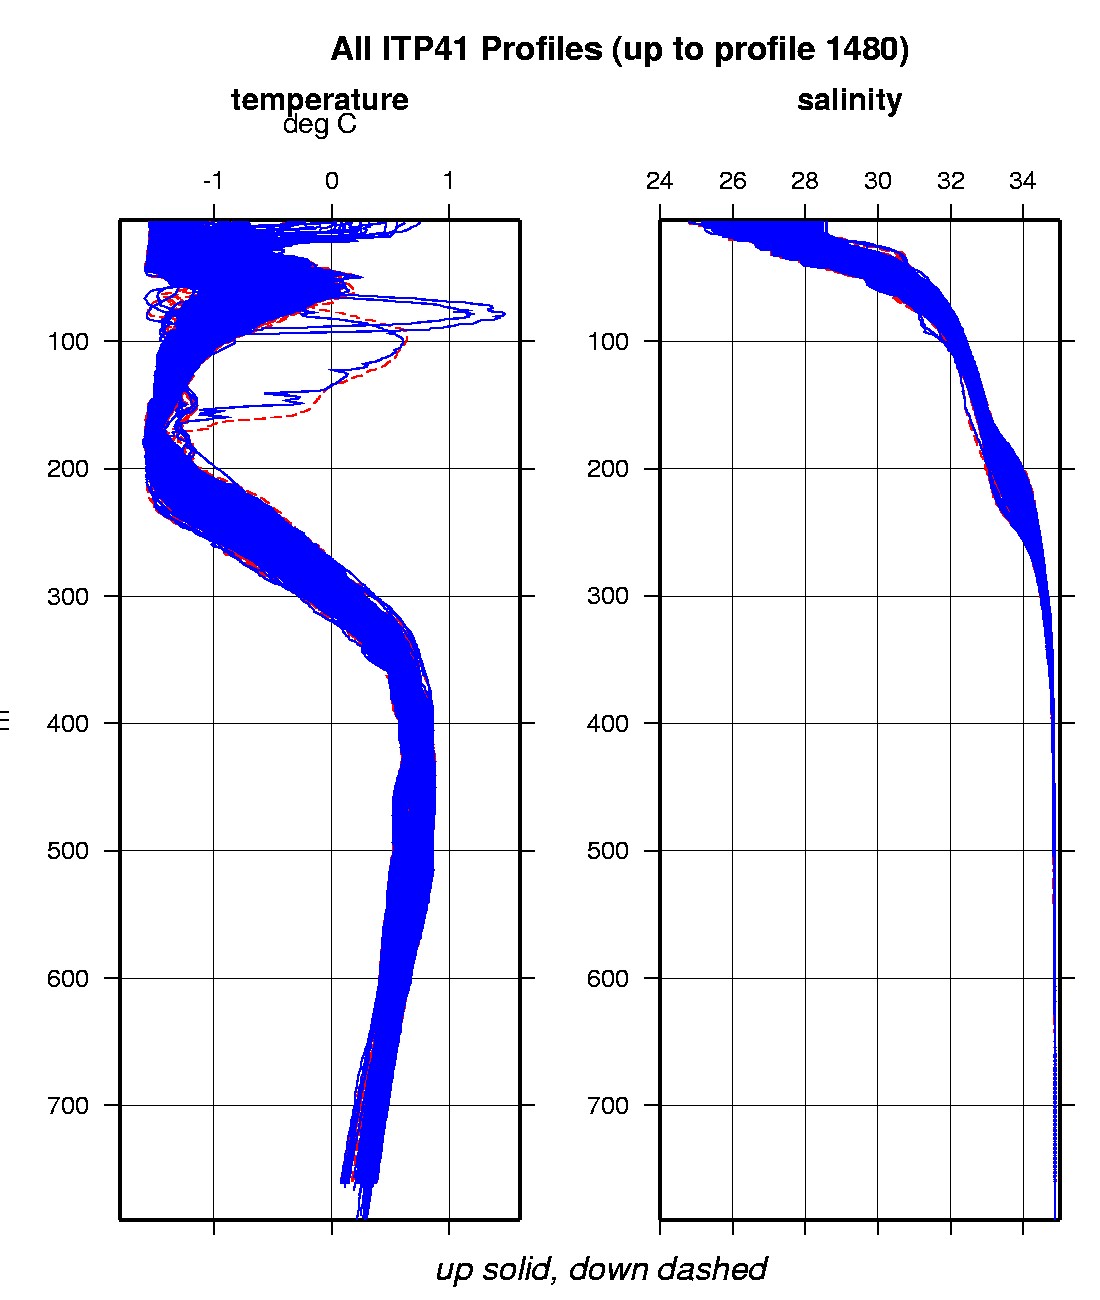
The plots to the right are of the final, calibrated, edited data (as opposed to the raw data presented on the active instrument pages).
See the Data Products tab to the left for descriptions of the three levels (I, II, III) of data processing and to access all data.
ITP 41 data can also be found at the links below:
Level II hourly buoy location data in ASCII format: itp41rawlocs.dat
Level III 1-Hz processed profile data in MATLAB format: itp41cormat.tar.Z and itp41cormat.zip
Level III 1-db bin-averaged processed profile data in MATLAB format: itp41final.mat
Level III 1-db bin-averaged processed profile data in ASCII format: itp41final.tar.Z and itp41final.zip


