ITP 12 Data Processing
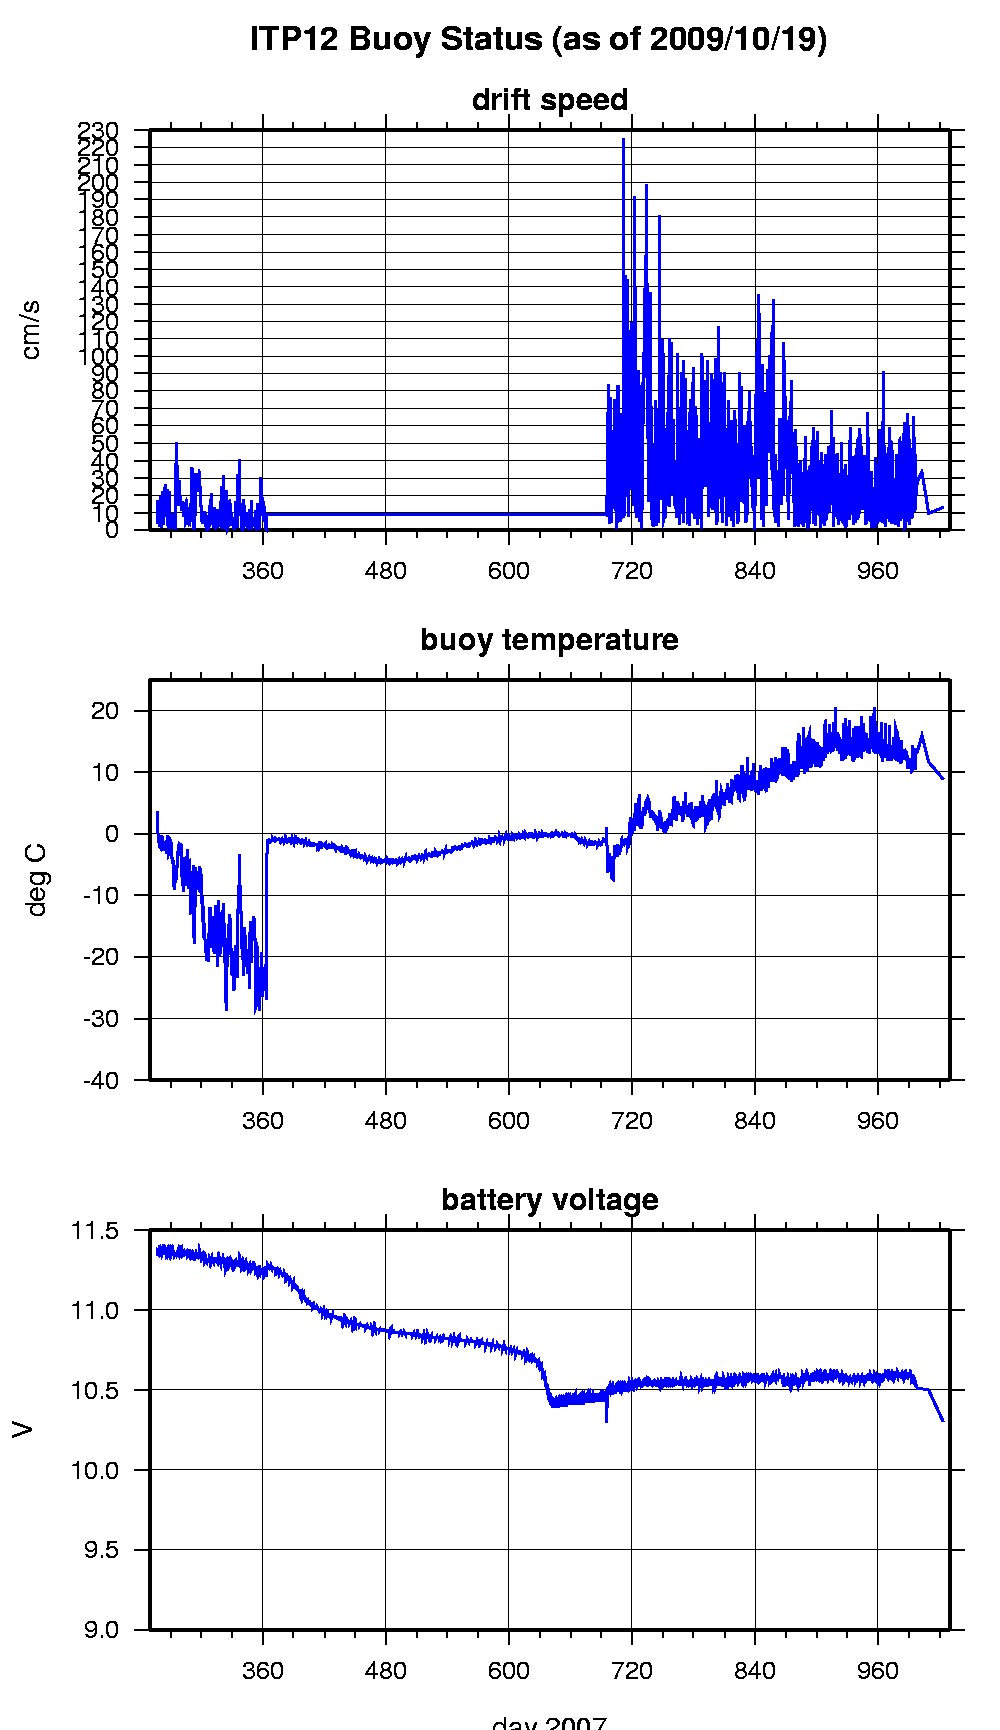
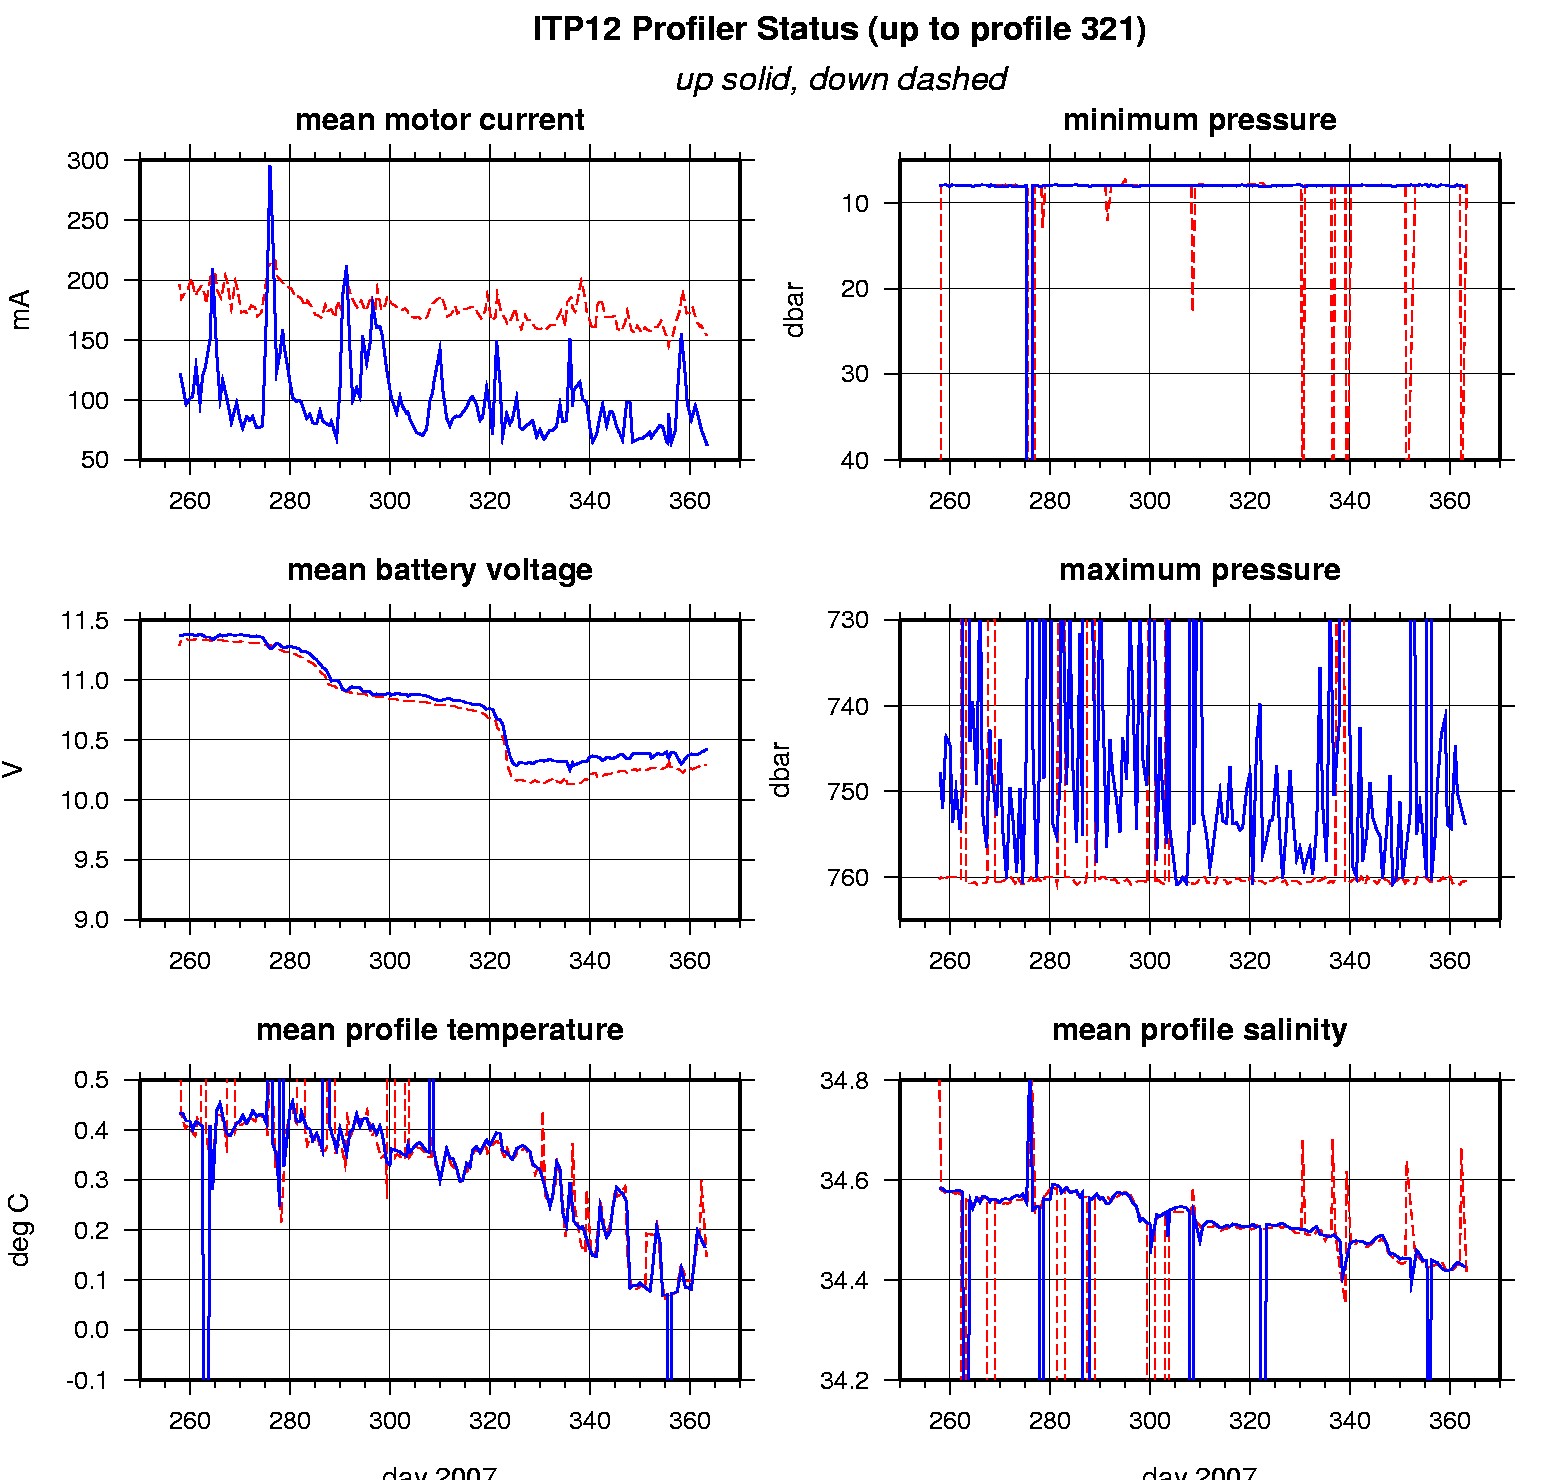
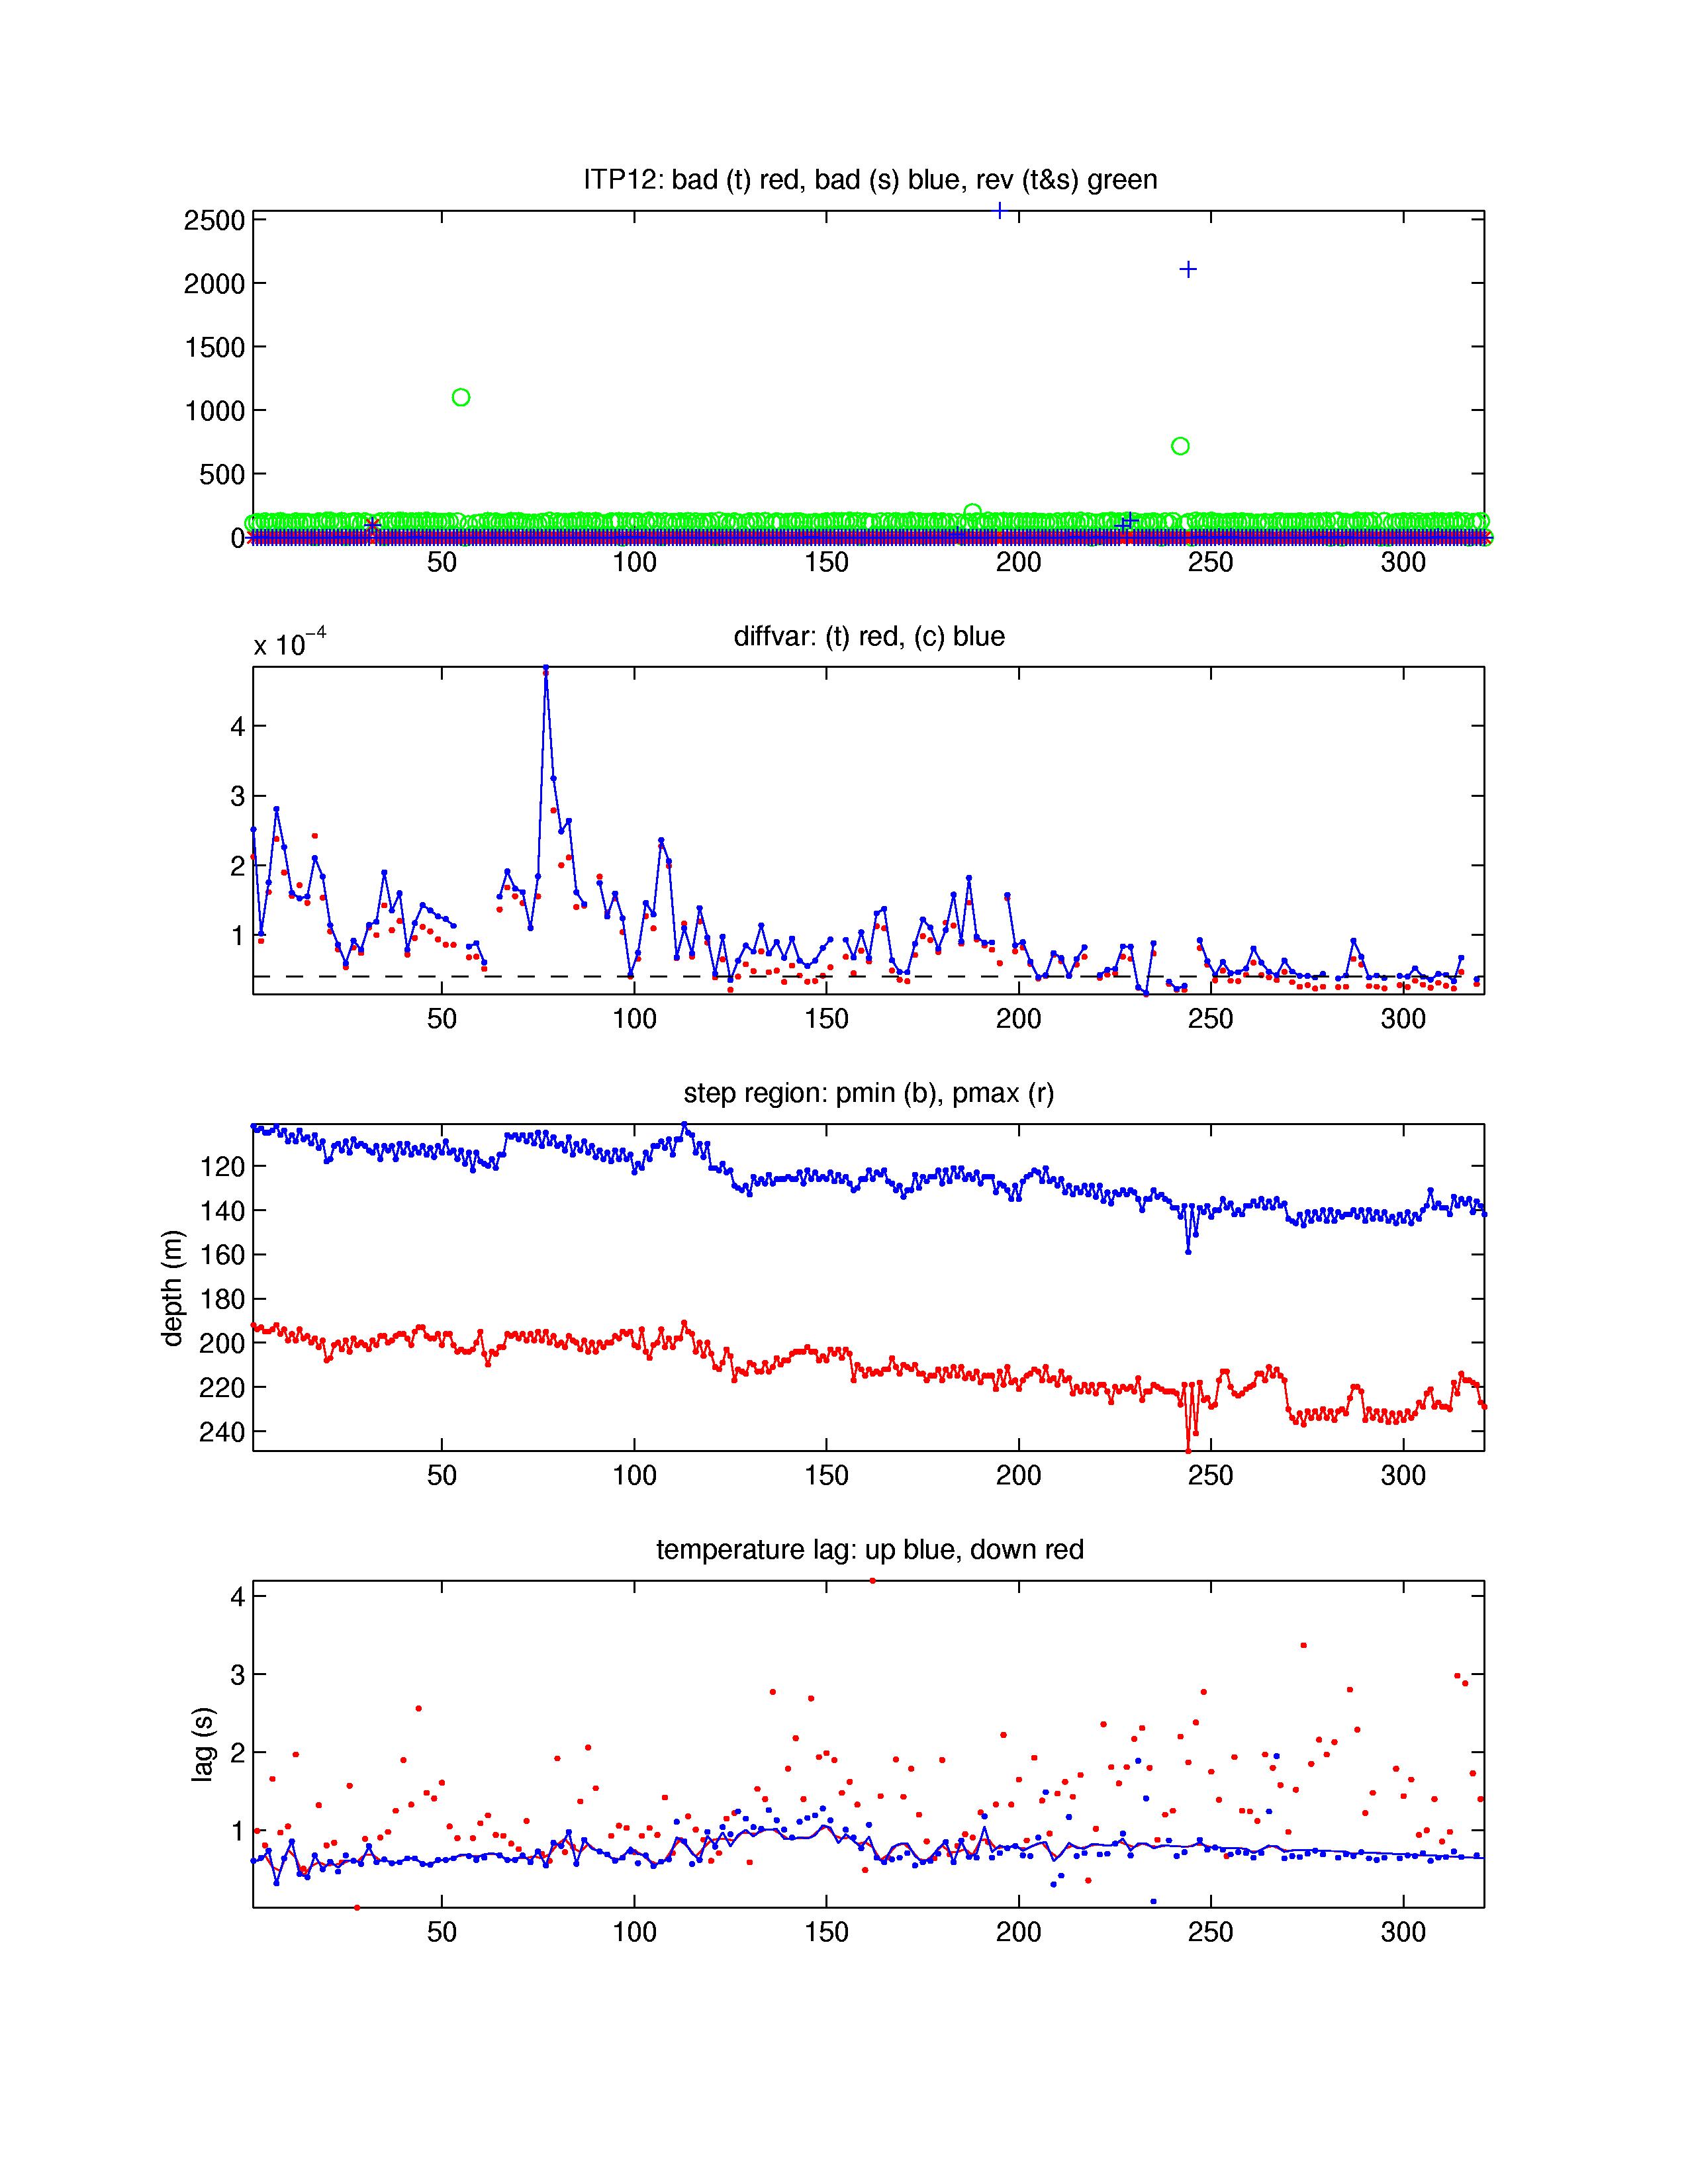
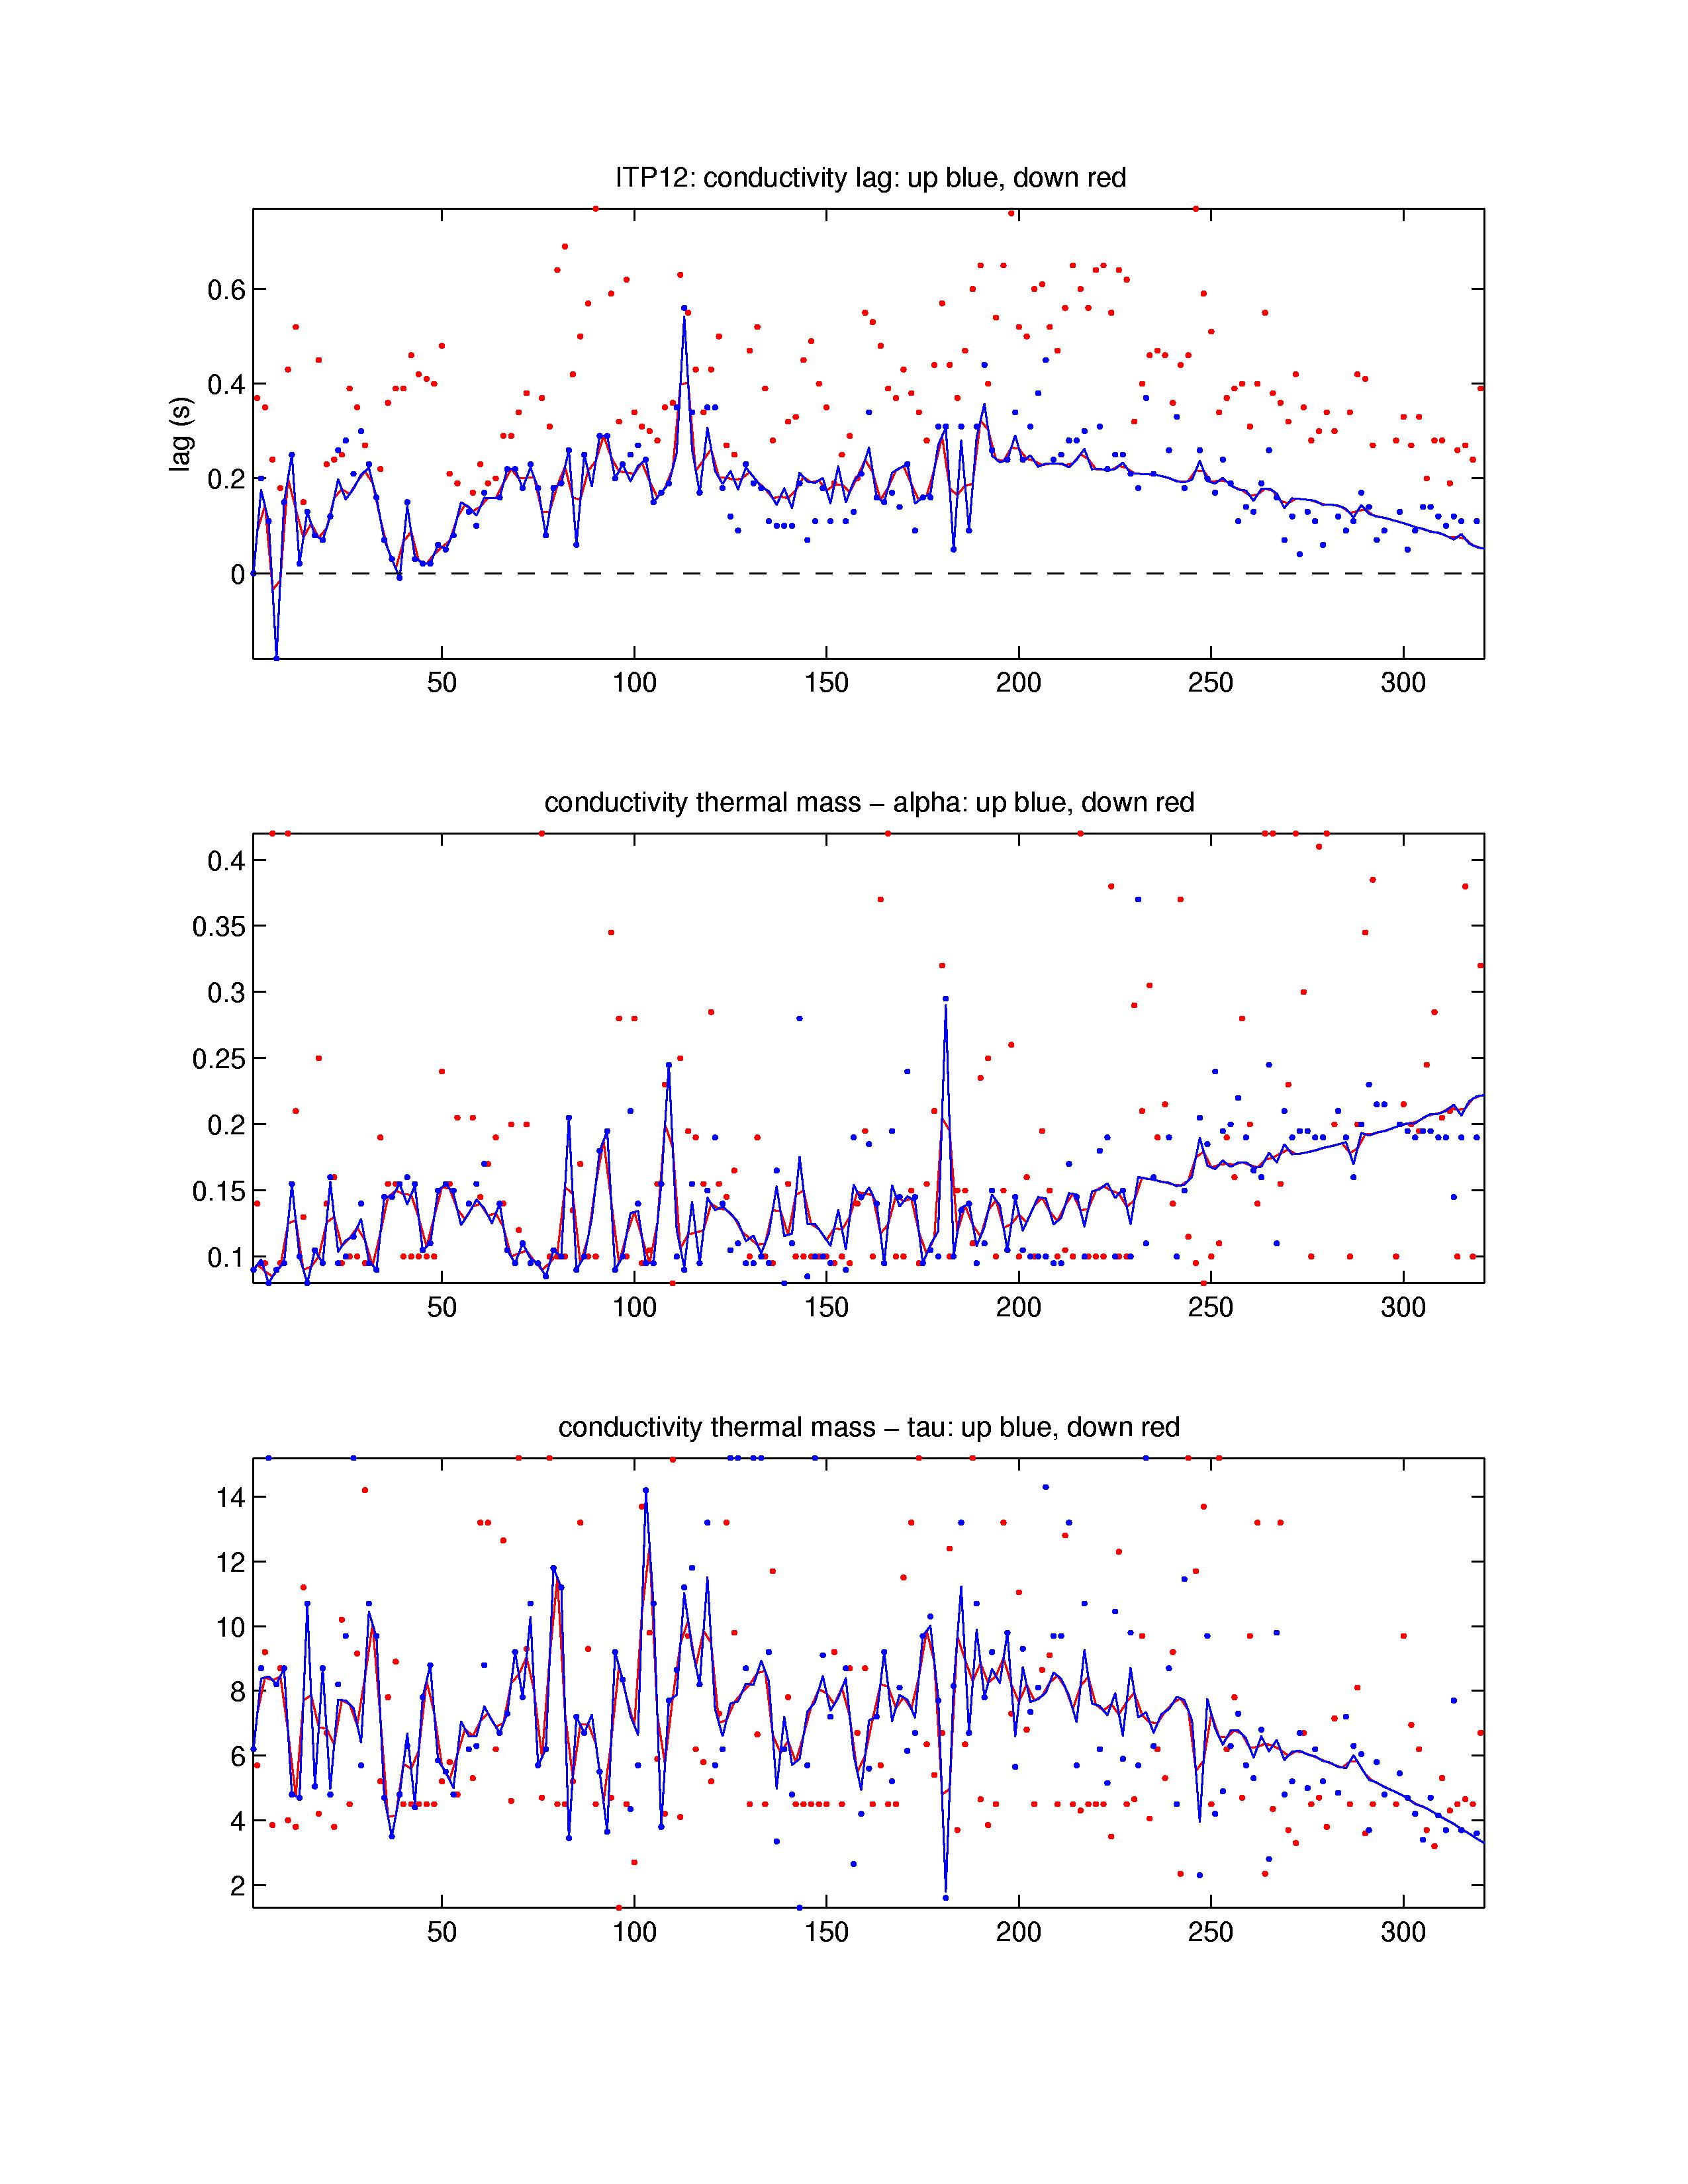
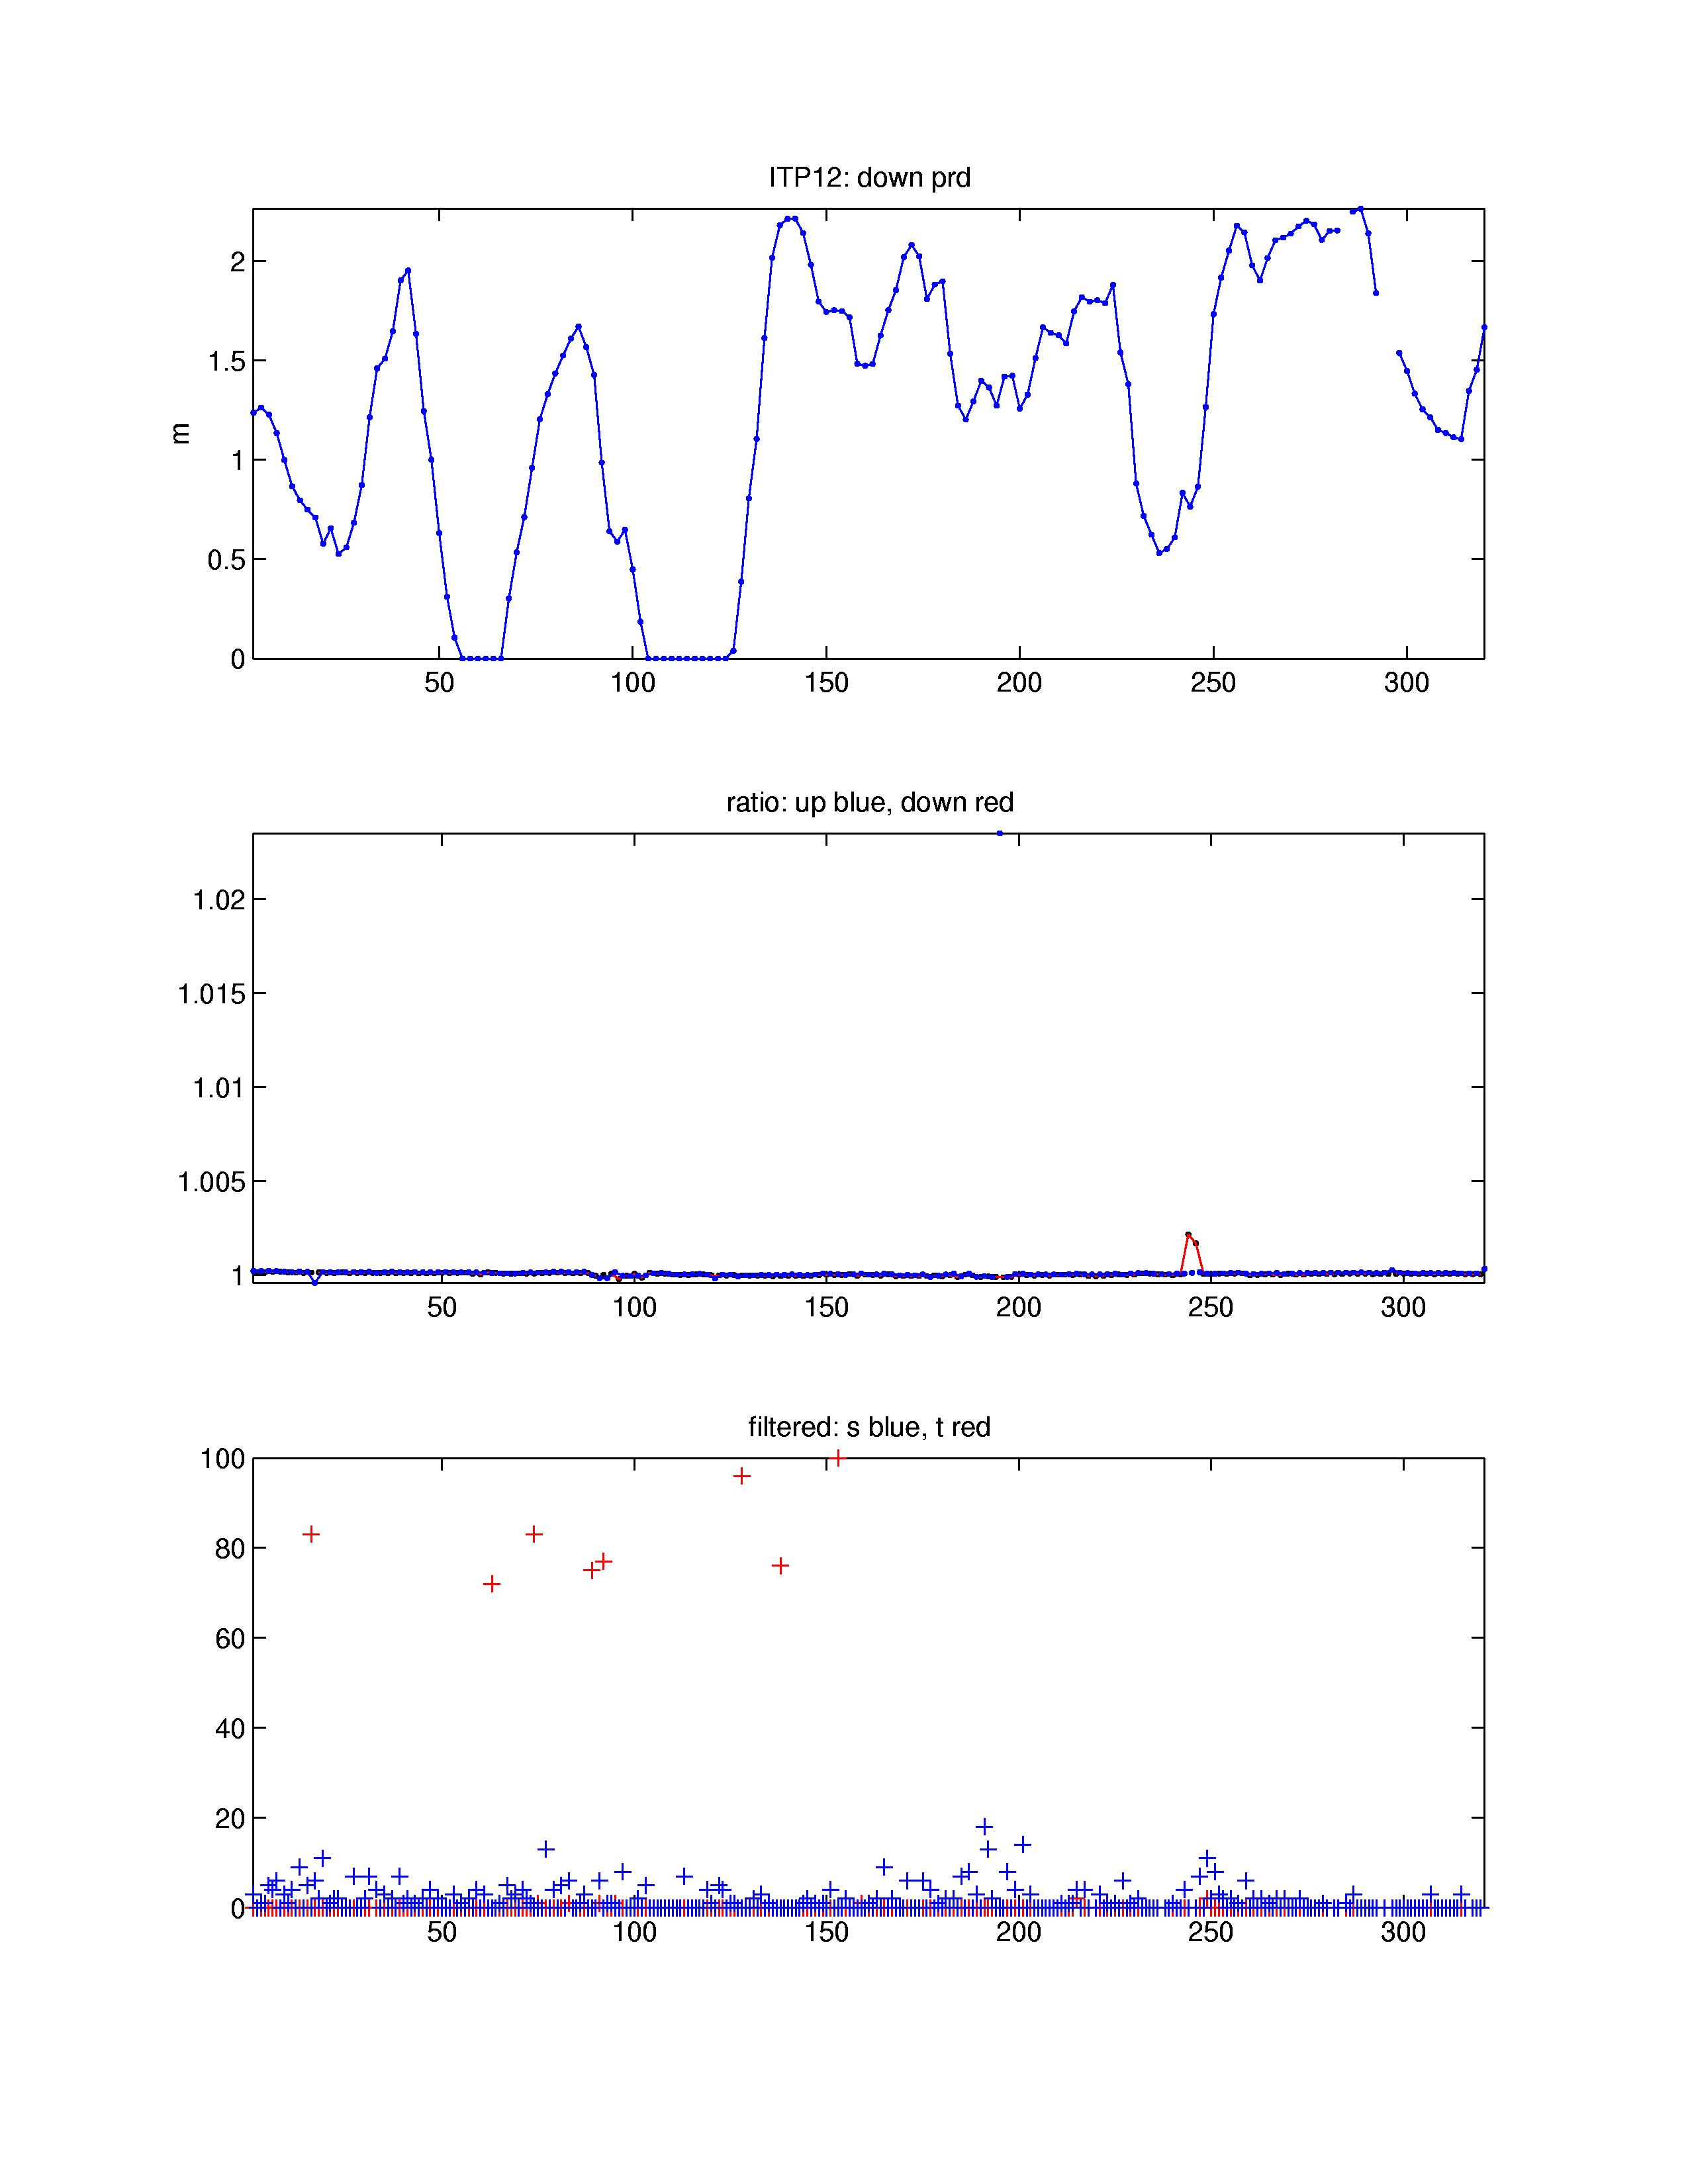
The 321 profiles that were recovered from the ITP were processed according to the procedures described in the ITP Updated Data Processing Procedures. The processing parameters for ITP 12 are shown in the figures to the right. Consistent sensor lags are obtained through thermohaline staircases through most of the timeseries, except at the end when the system apparently crossed into a water mass with different characteristics so that lags are extrapolated values. Only one profile was unable to profile the full extent vertically due to excessive ice drift speed, but there were 18 resets with complete loss of data for these profiles, and typically incomplete vertical coverage for the next subsequent profiles due to an operating software bug in the 2007 profilers. Virtually no points were removed for biofouling, and the conductivity sensor was extremely stable between profiles.
See the Data Products tab to the left for descriptions of the three levels (I, II, III) of data processing and to access all data.
