ITP56 Data Processing
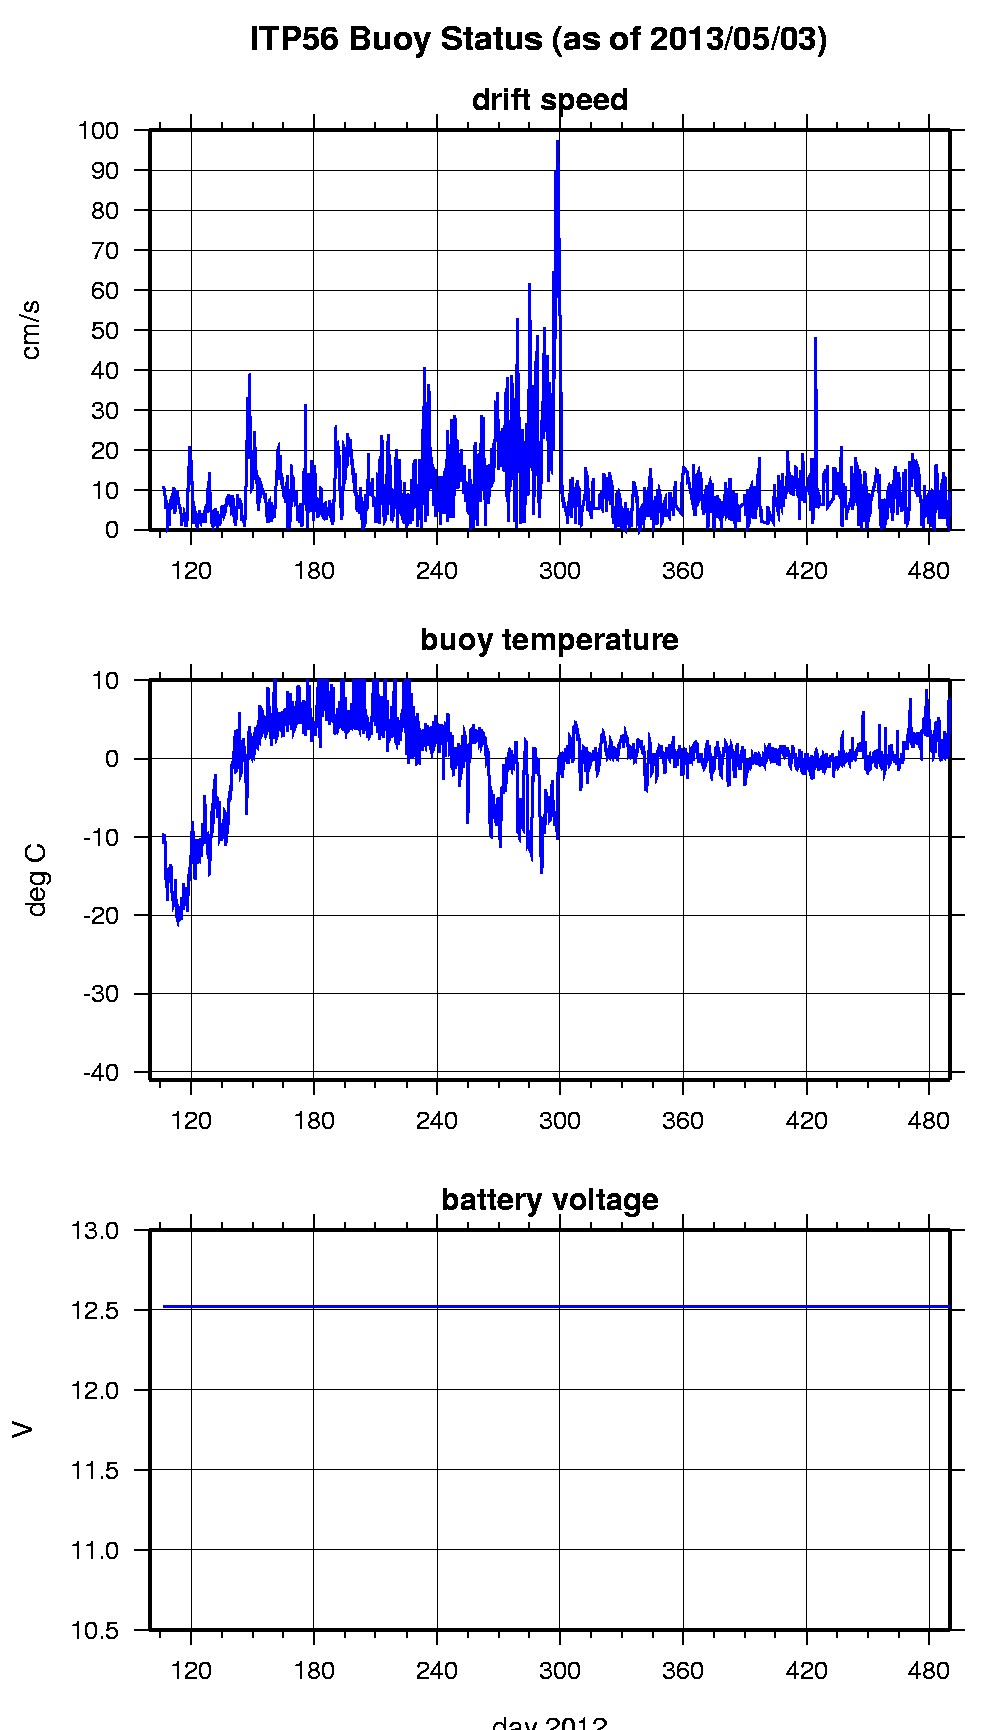
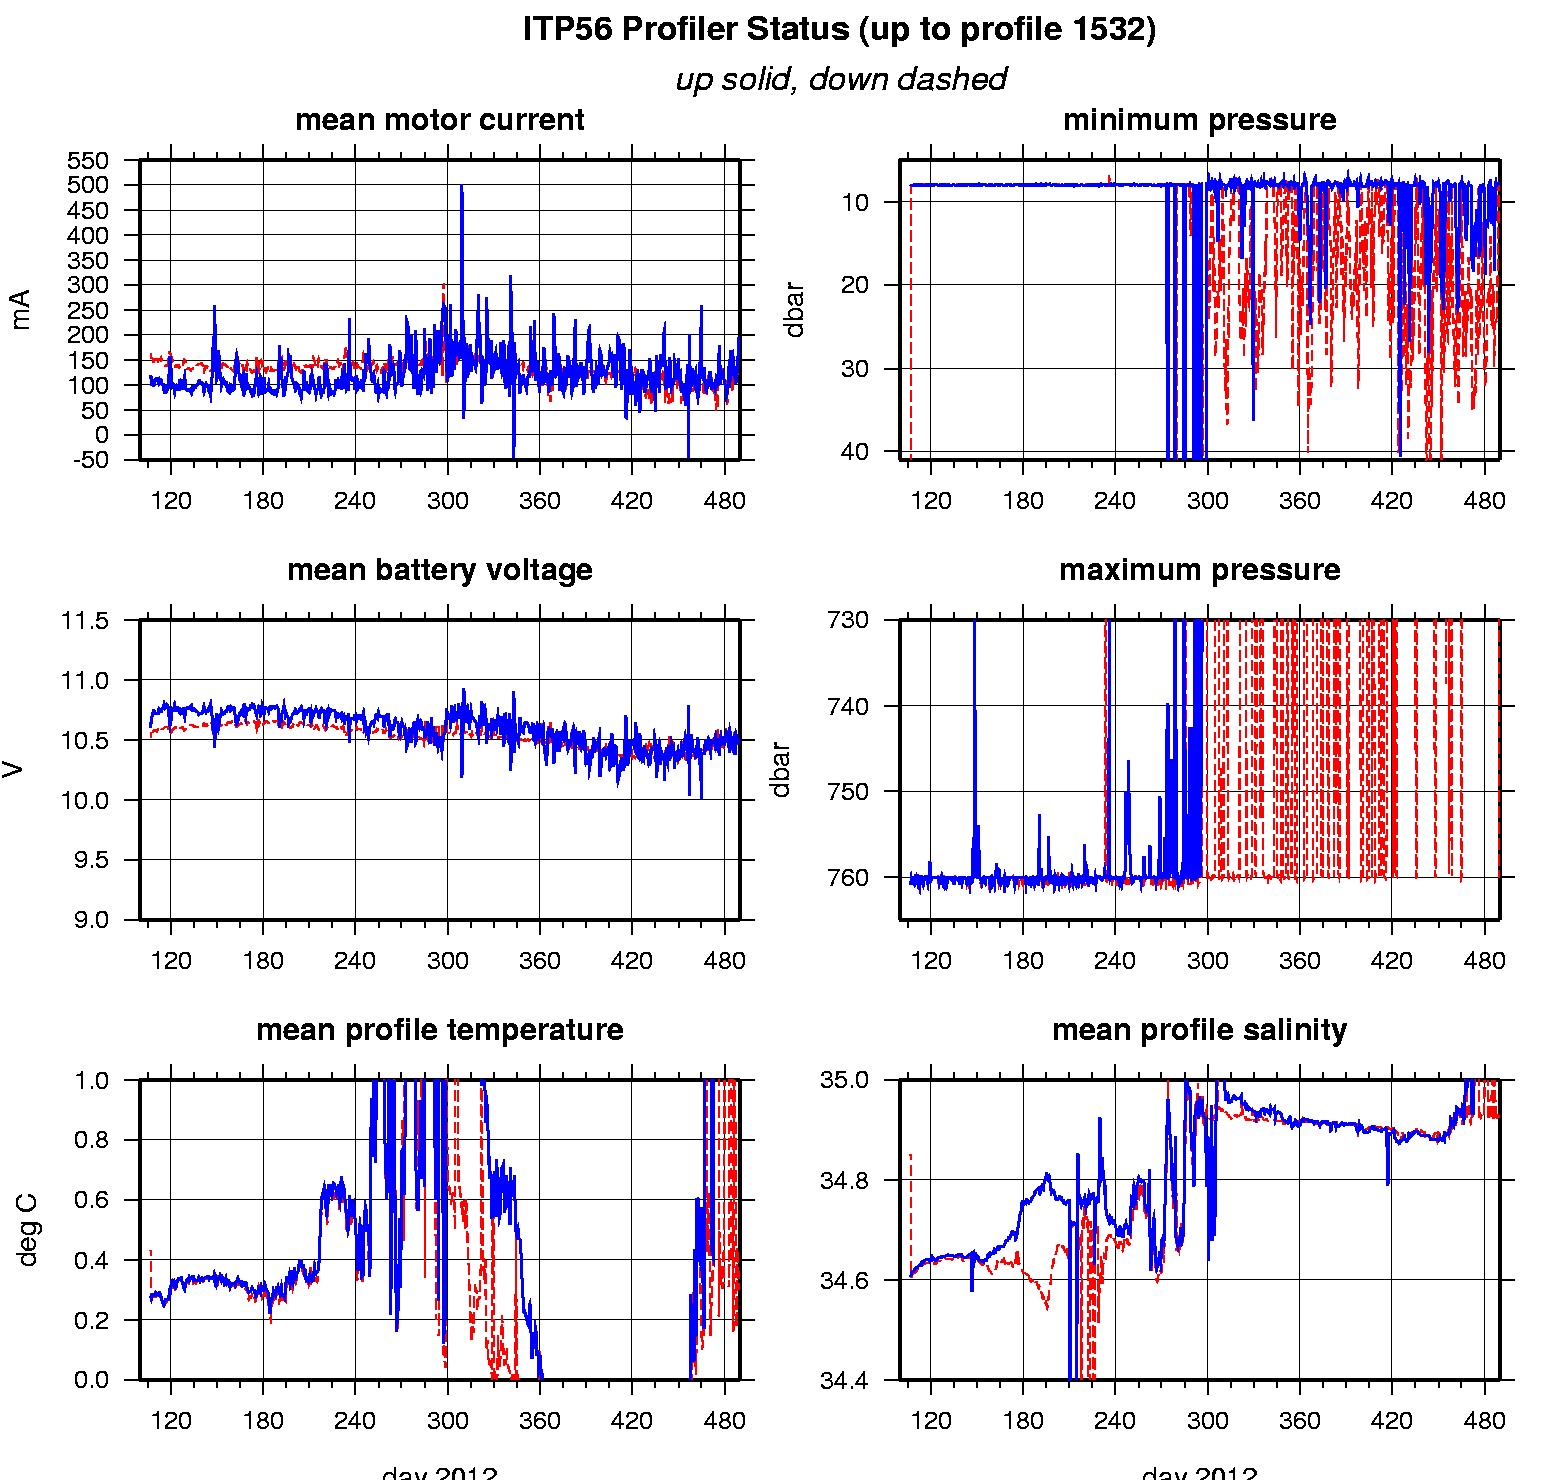
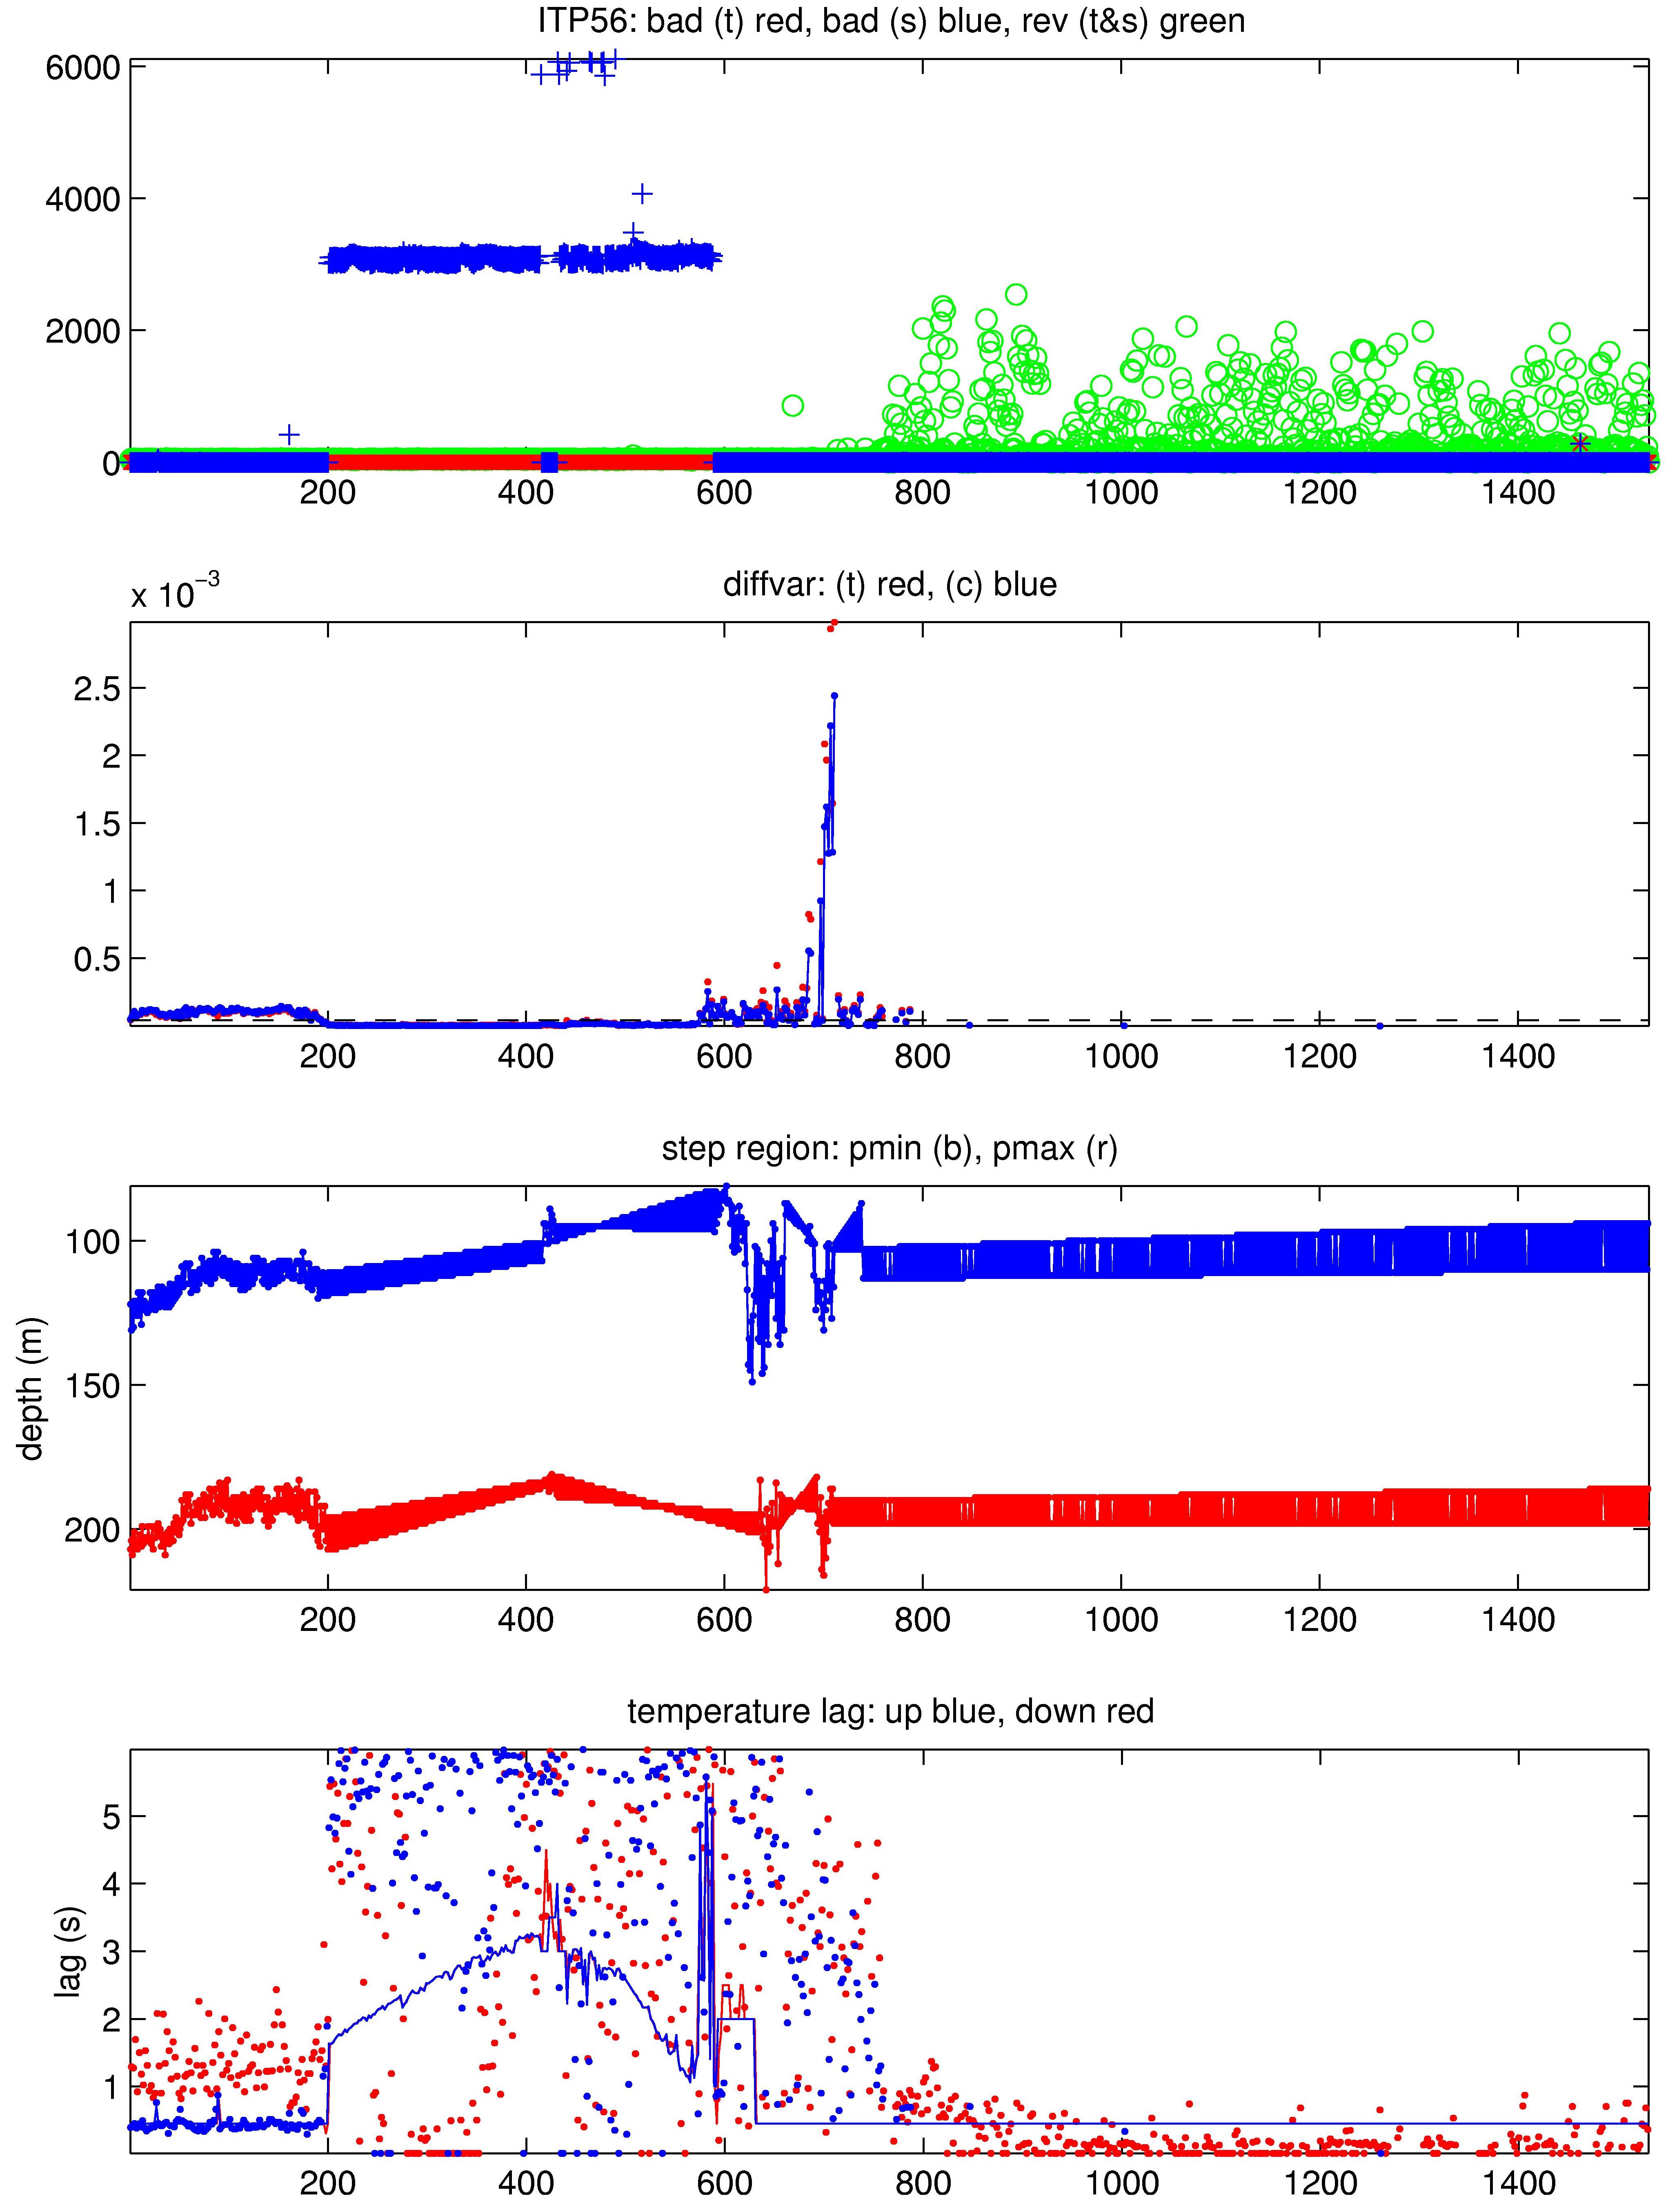
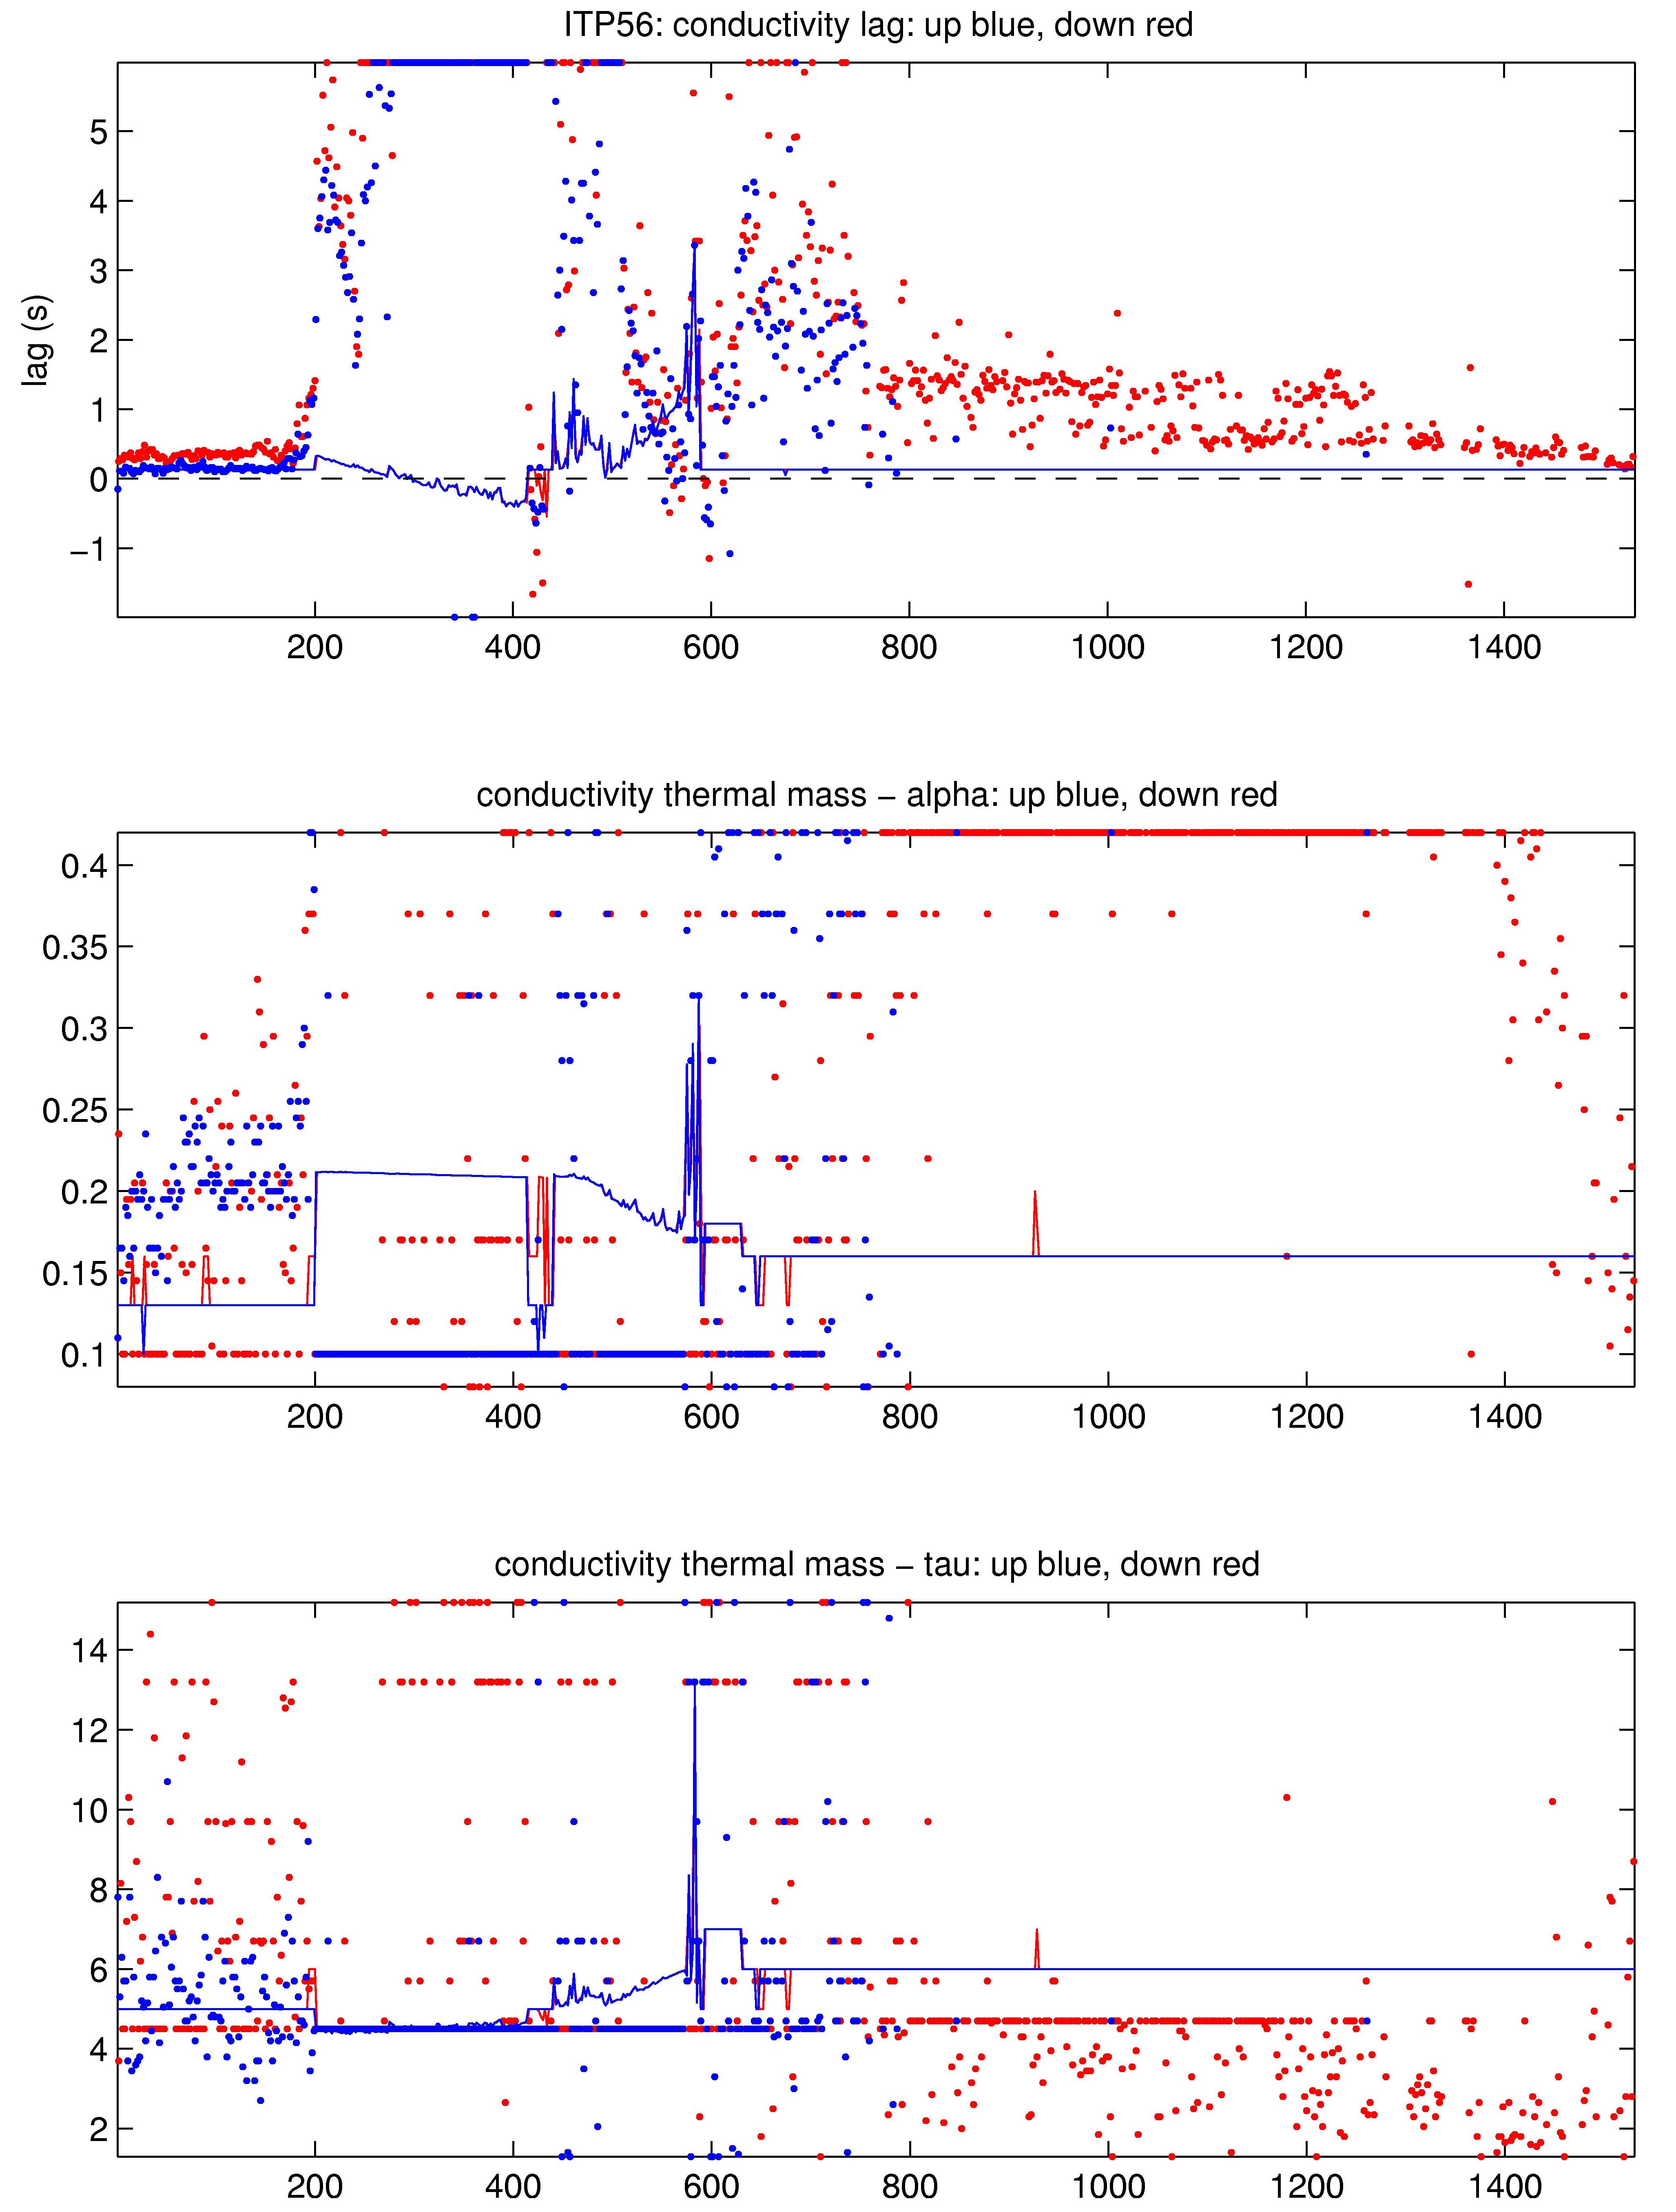
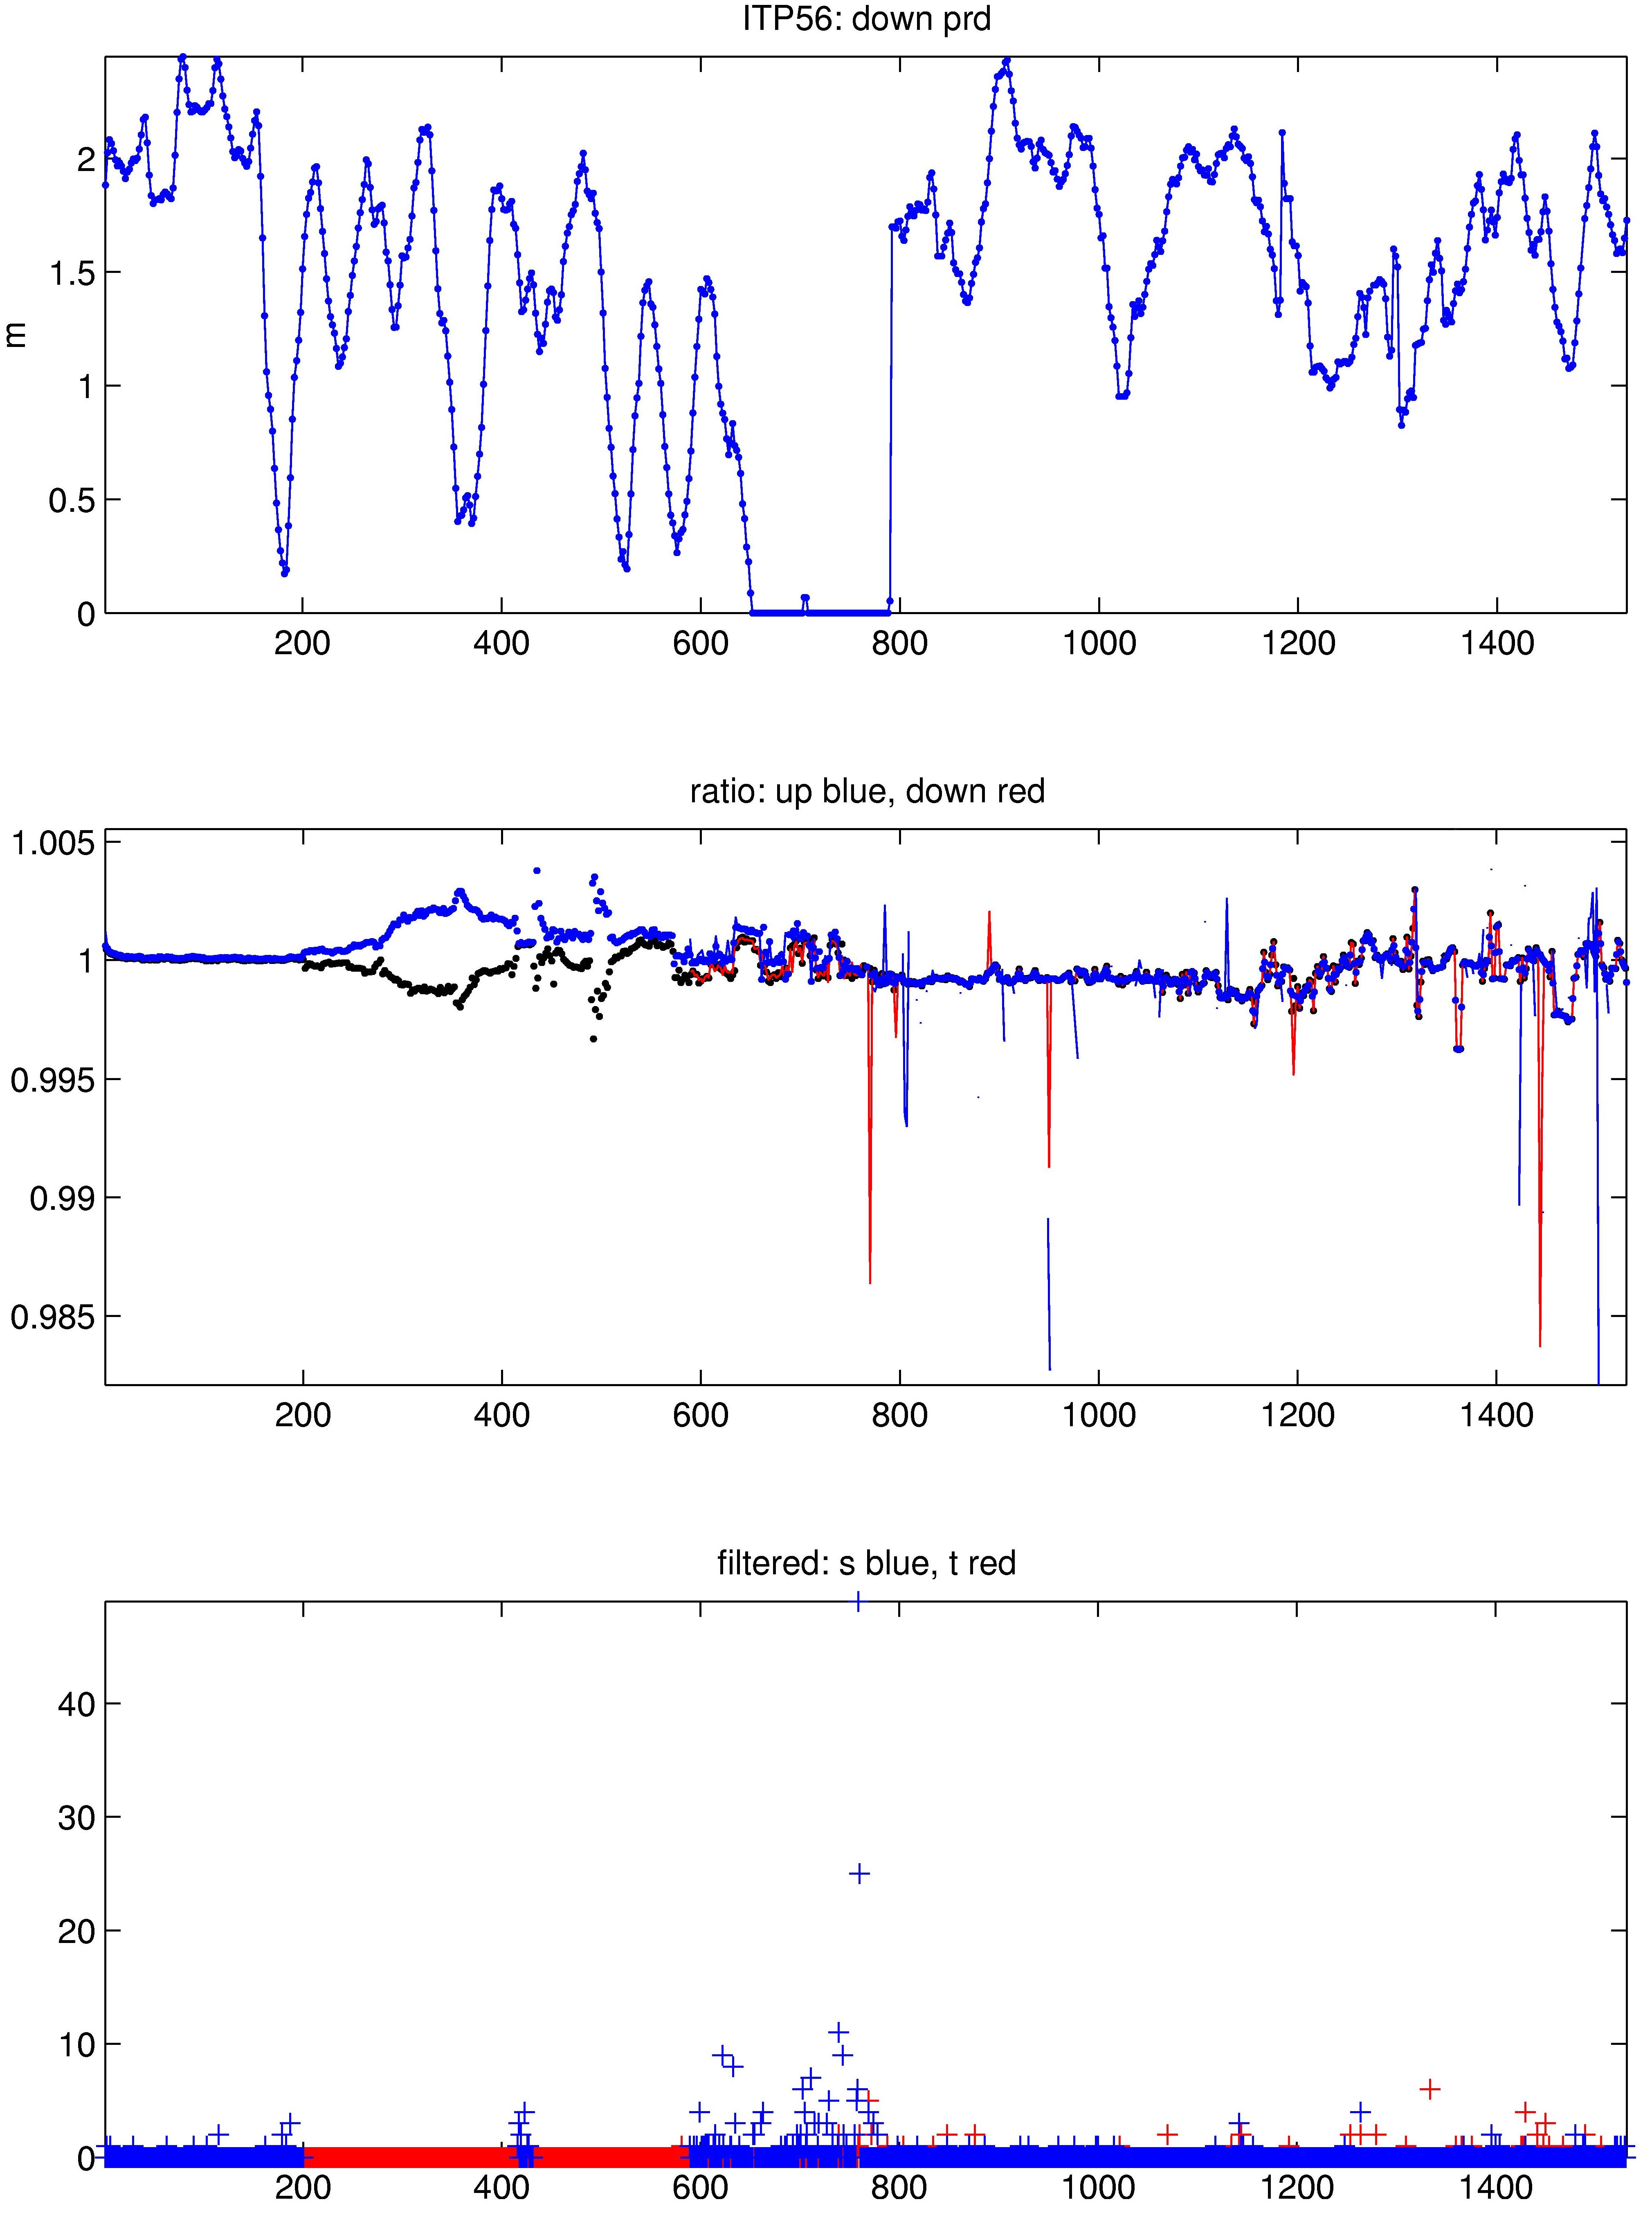
The 1532 profiles that were recovered from the ITP were processed according to the procedures described in the ITP Updated Data Processing Procedures. The processing parameters for are shown in the figures to the right. Until the buoy reached Fram Strait and broke out of the in early October, there were only a few instances where the drift speed exceeded 30 cm/s which prevented the profiler from obtaining full profiles.
The ITP worked well for the first 200 profiles, but was then struck by either massive obstructions and/or pump problems. A significant number of the worst conductivity (salinity) profiles were removed. Performance improved somewhat later in the record so that more profiles were retained, but all salinities were marked as questionable (qflag=1) starting with profile 589. Temperature was considered less affected, and was retained throughout.
Passing through Fram Strait, the drift speed approached 1 m/s, and after breaking out of the ice around profile 760, the ITP ceased collecting up profiles. Due to the dense seawater characteristics and roller wear, it is likely that the instrument may have been sliding up the wire towards the top stop after completing the down profile, so that little upward travel distance remained before each up profile.
See the Data Products tab to the left for descriptions of the three levels (I, II, III) of data processing and to access all data.
