ITP57 Data Processing
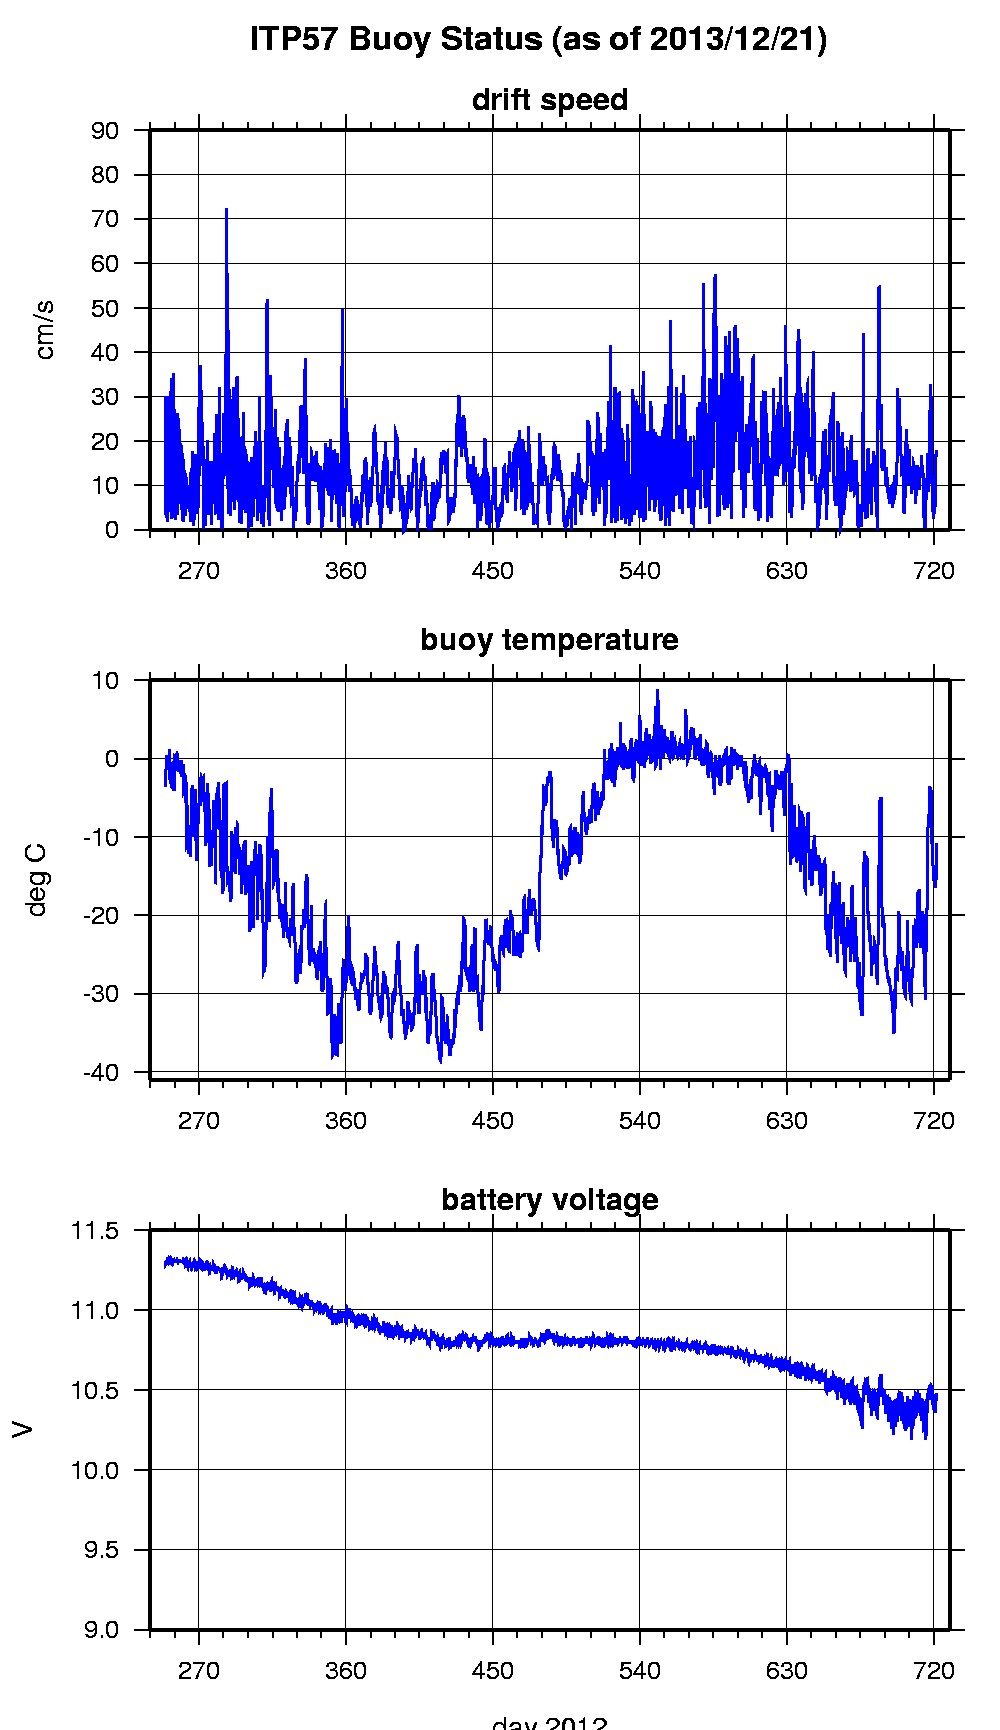
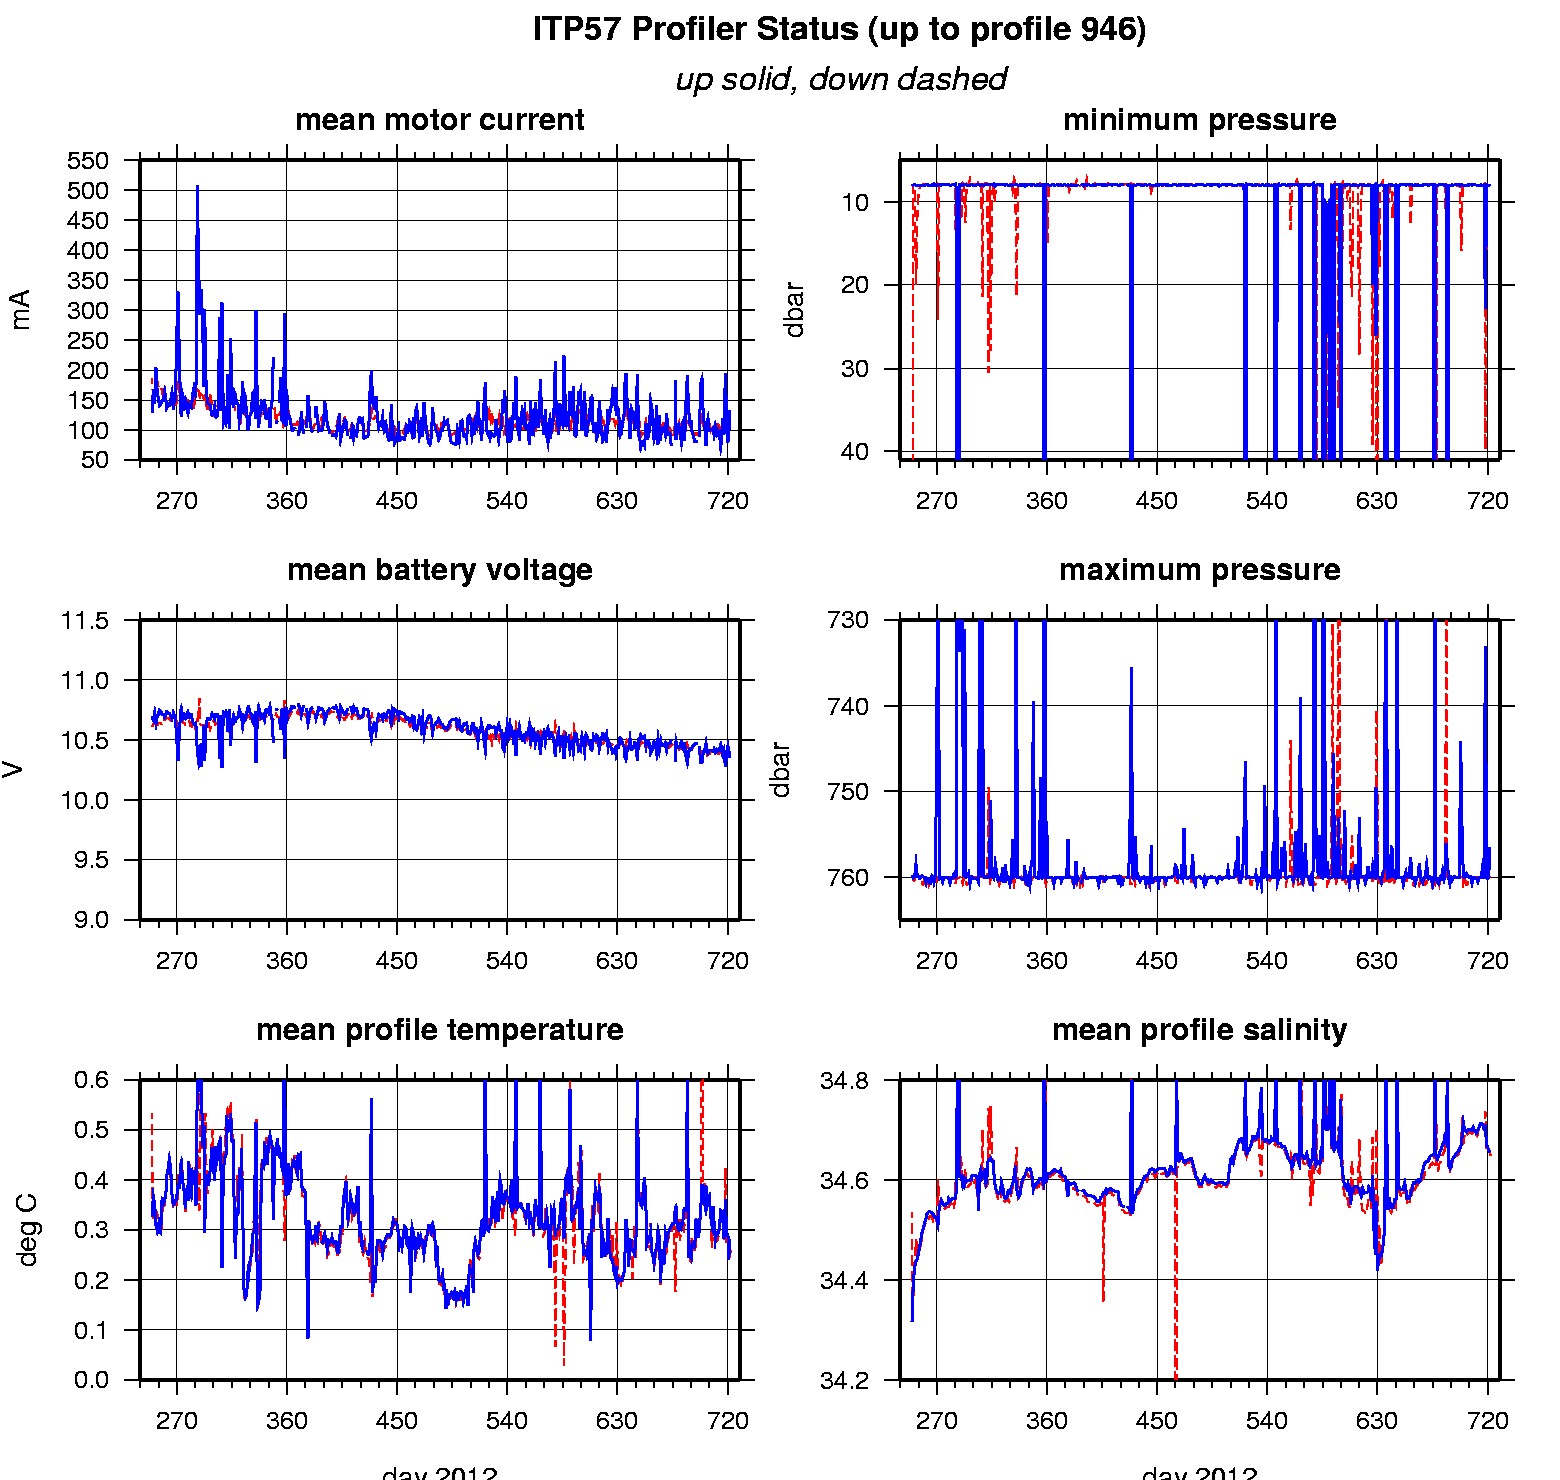
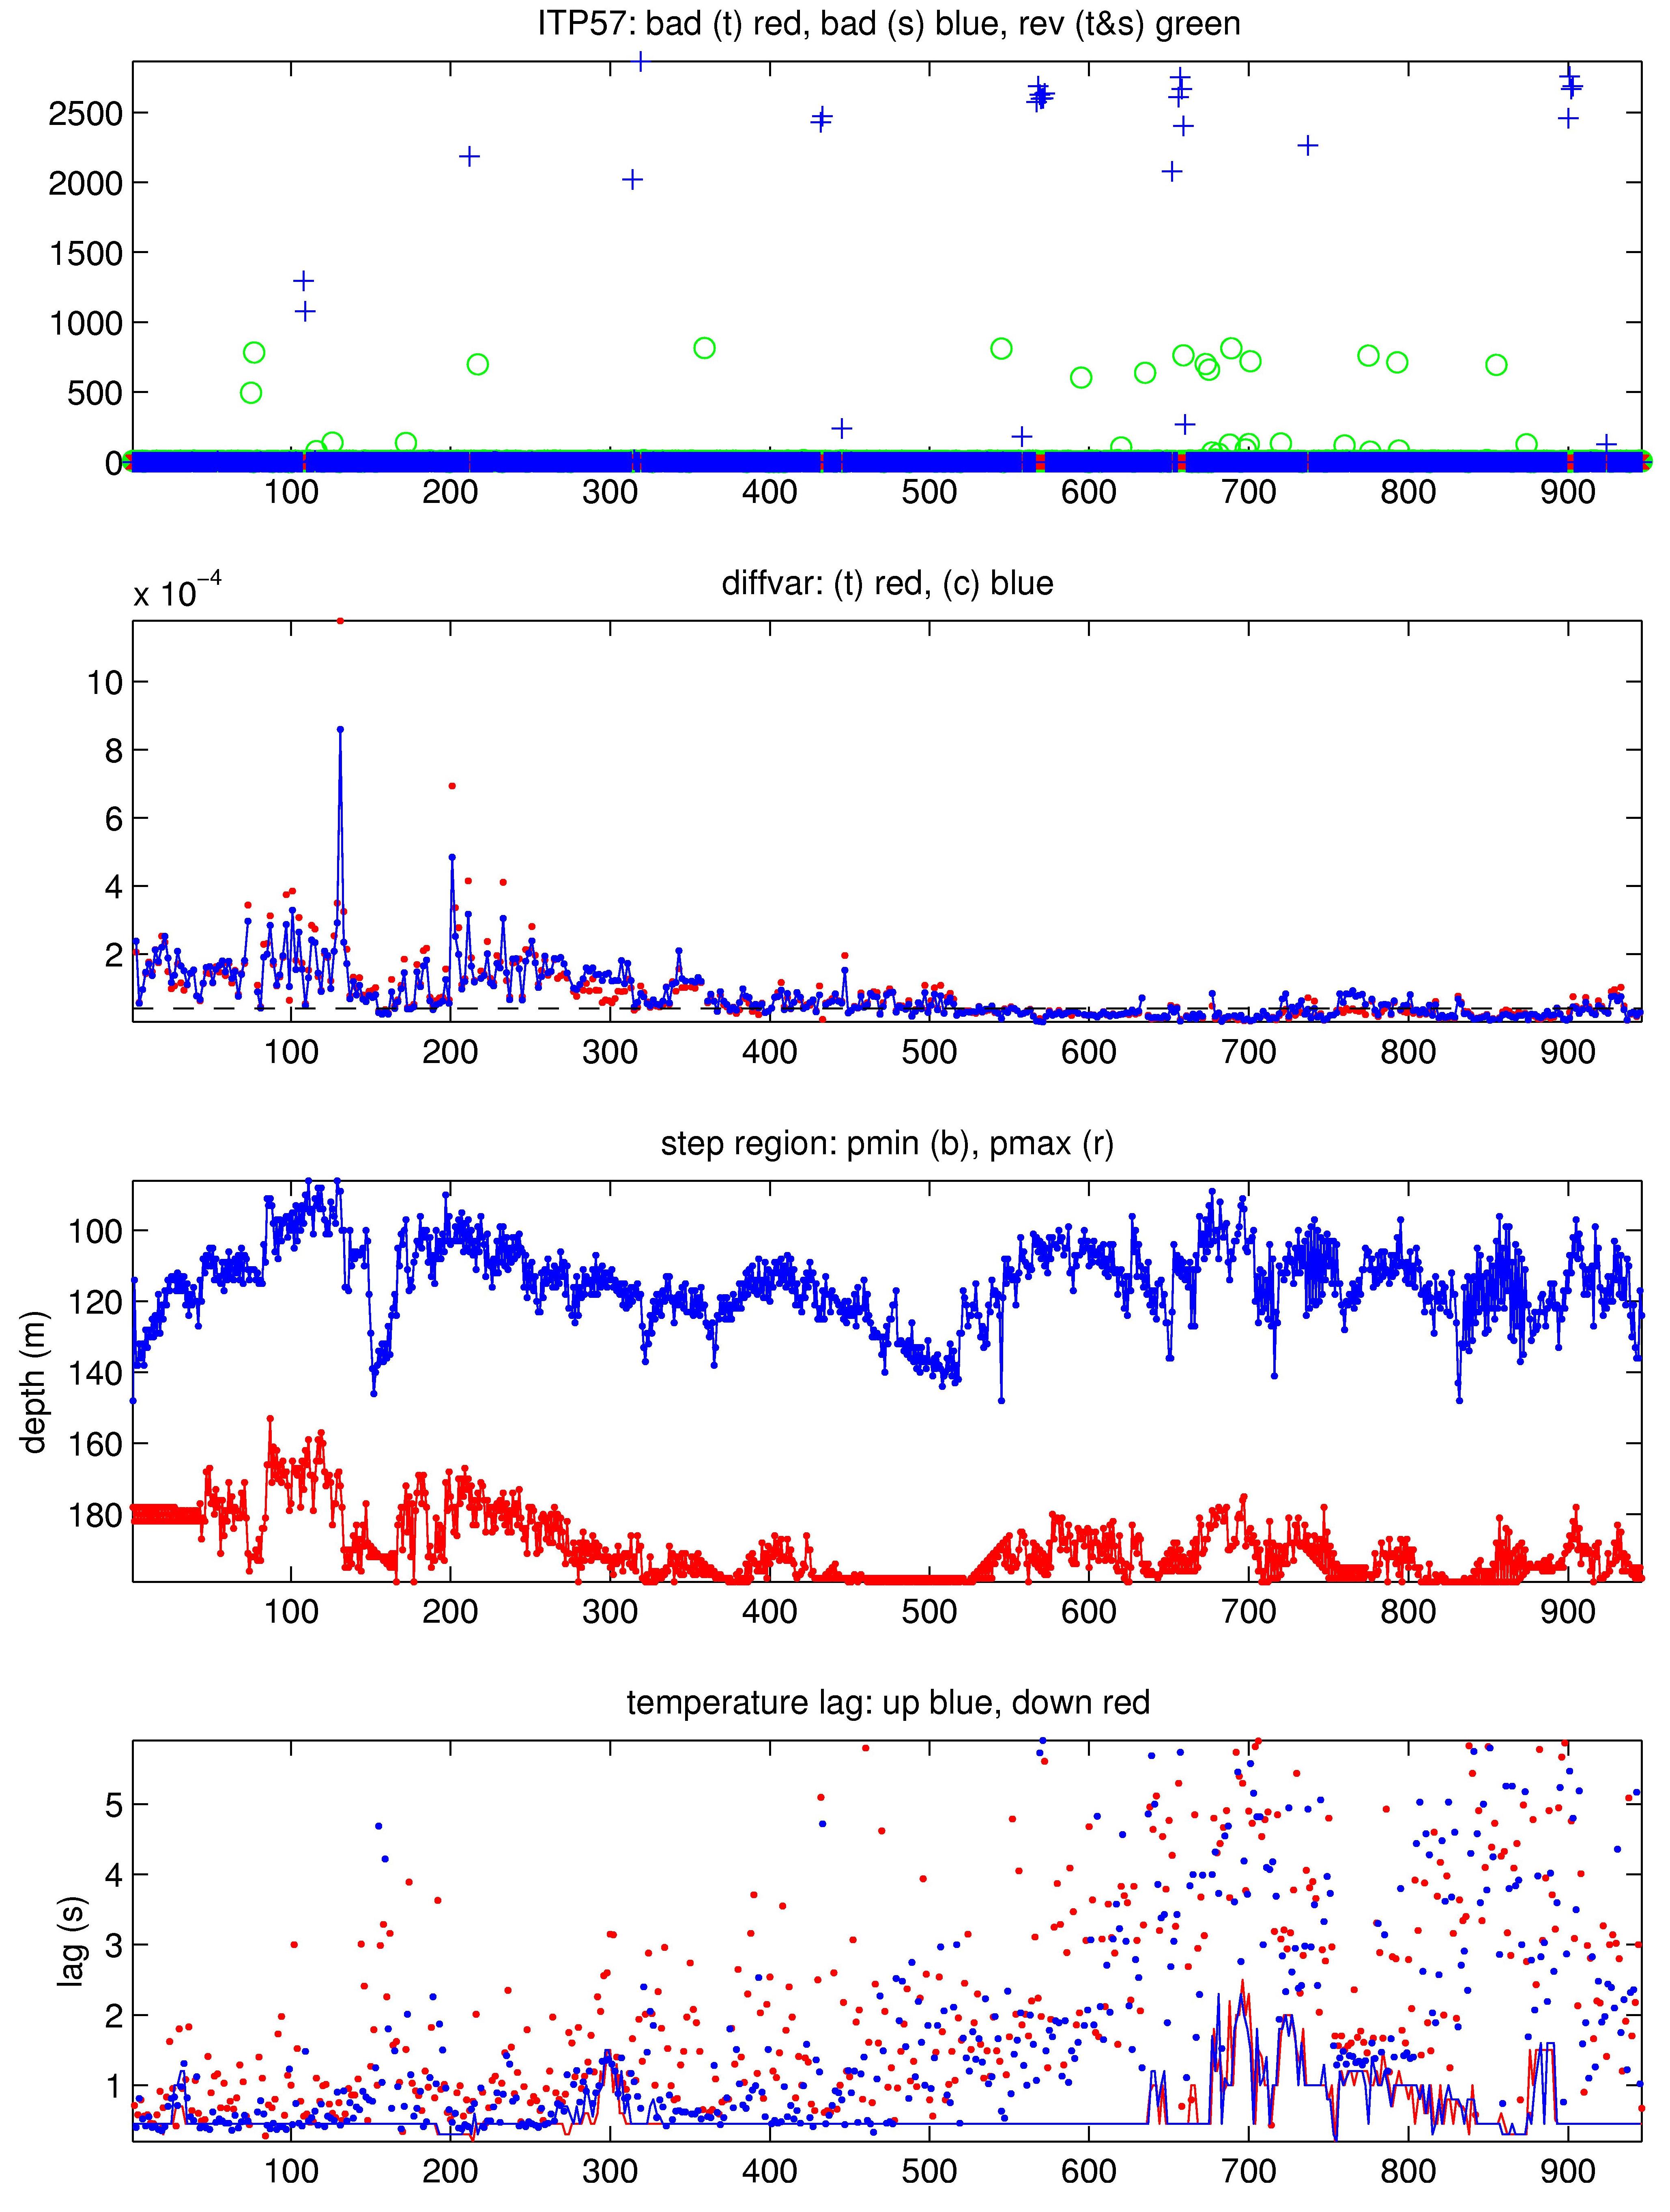
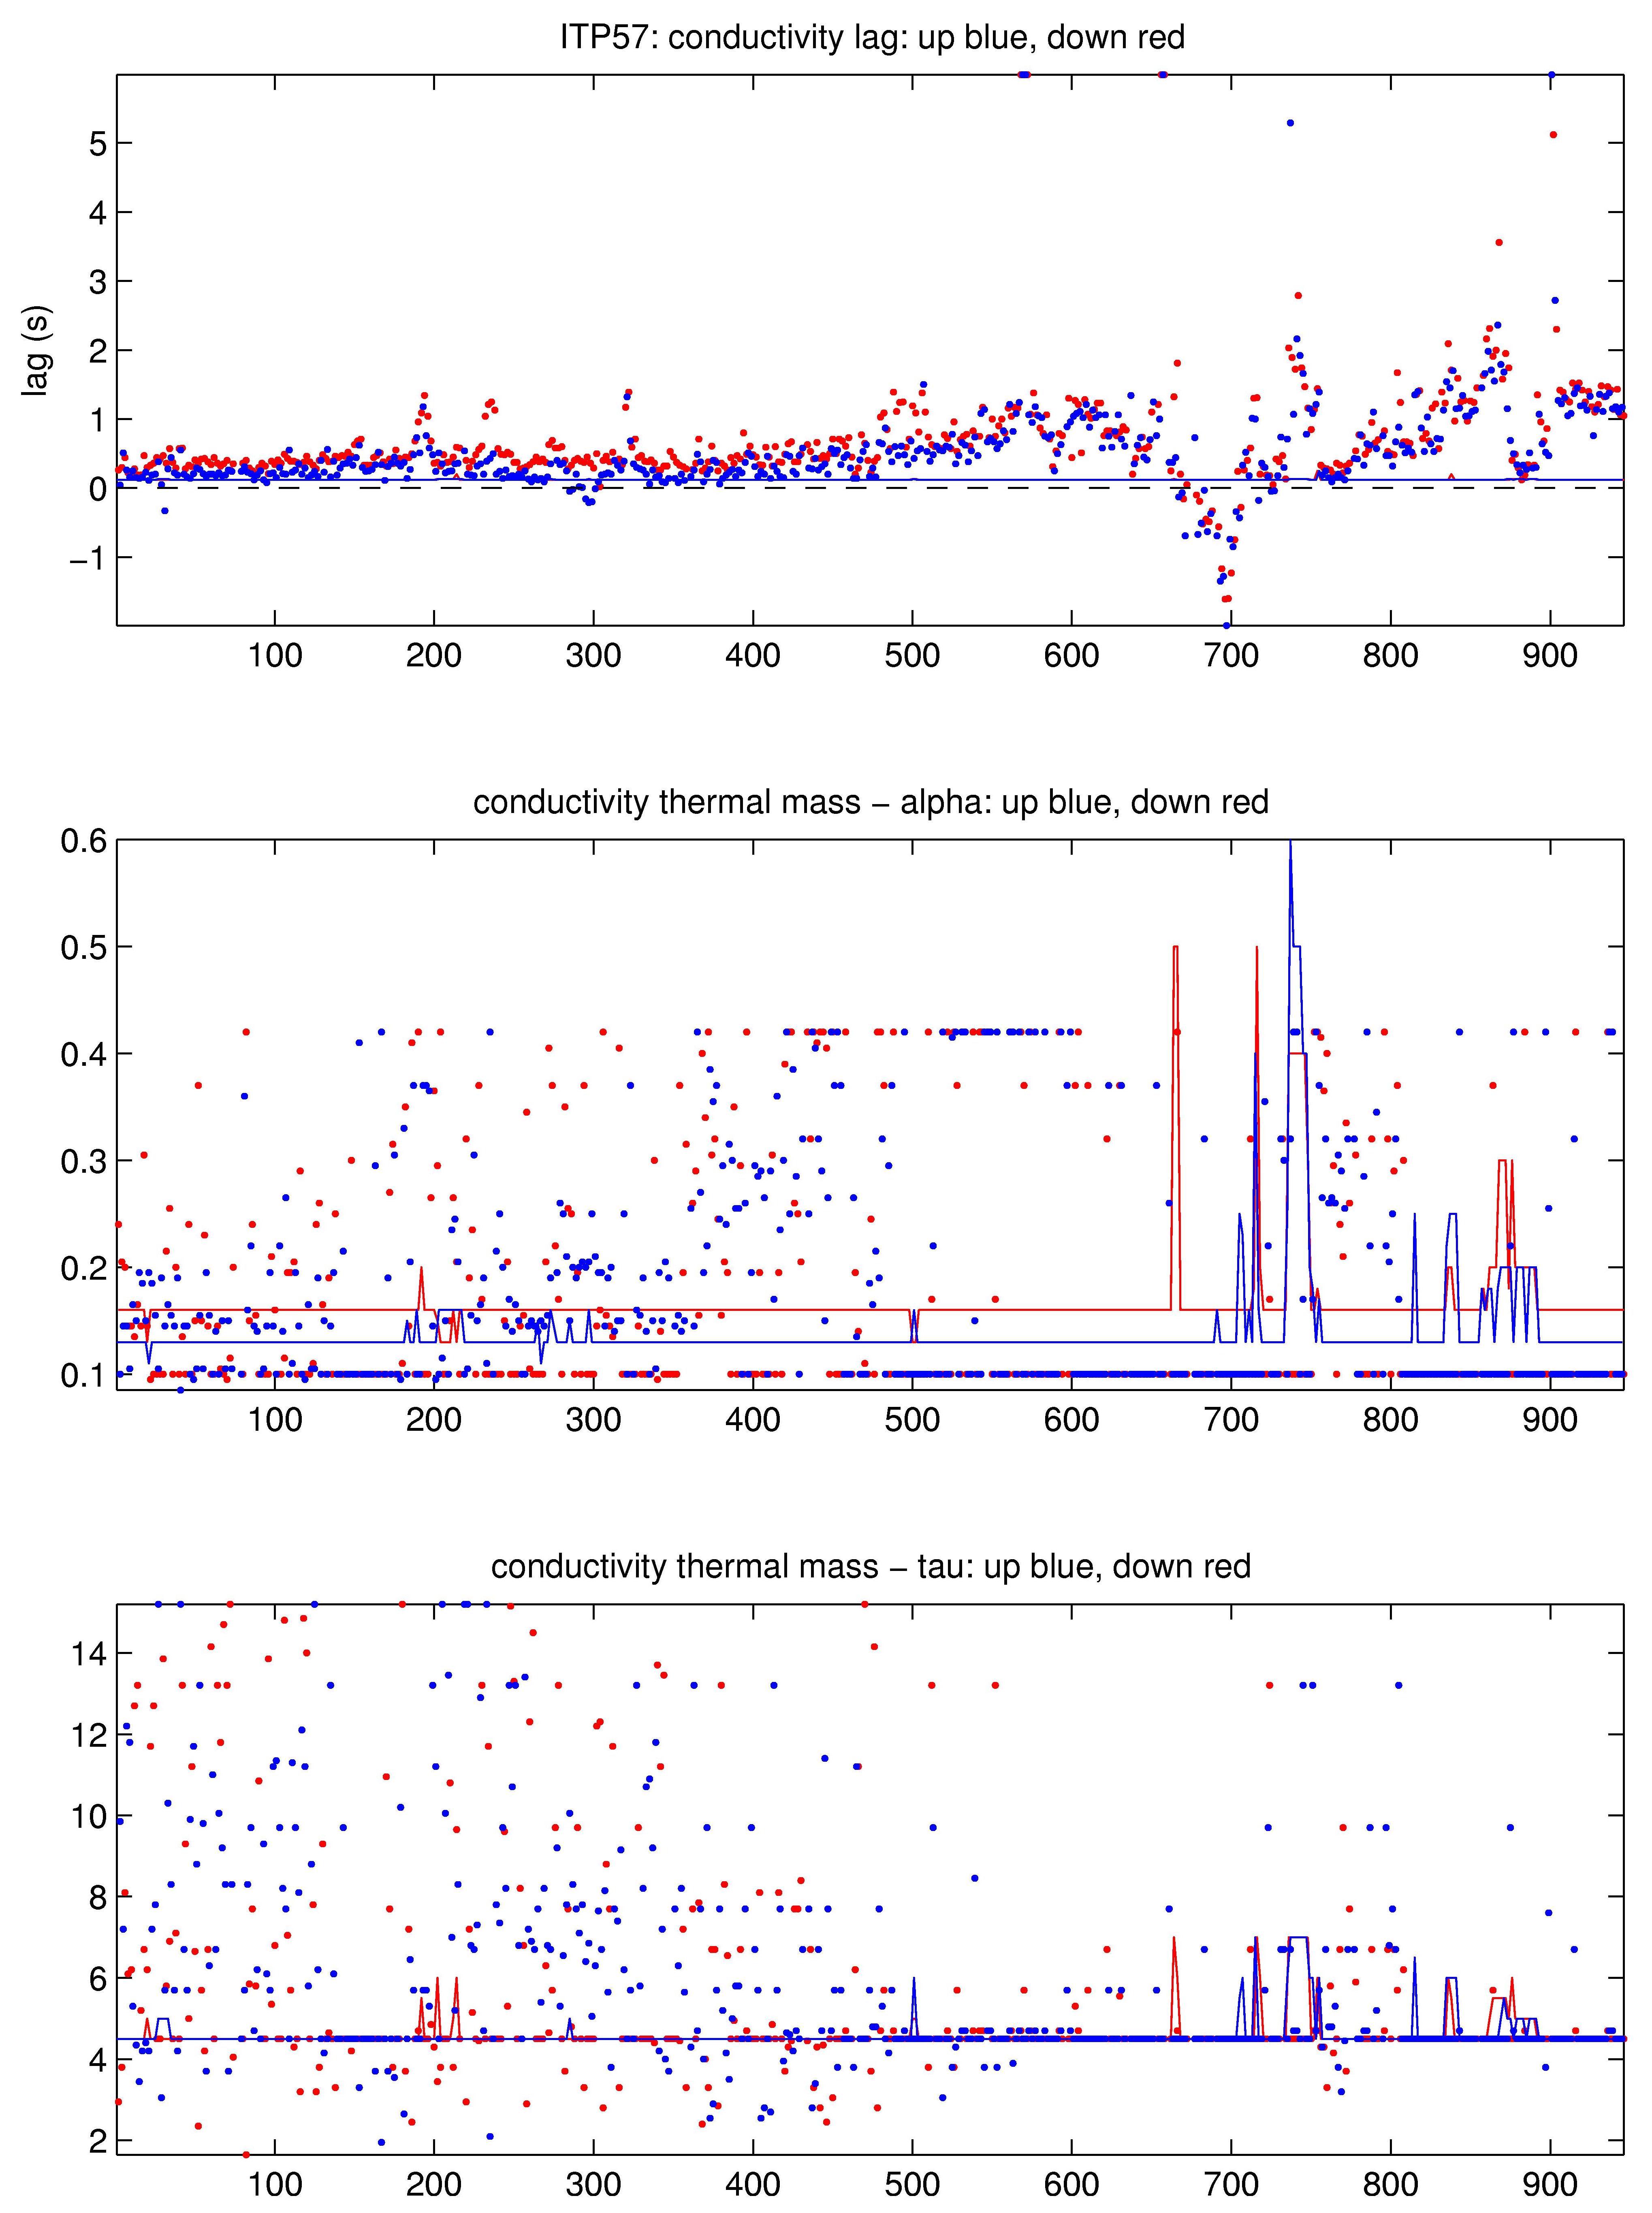
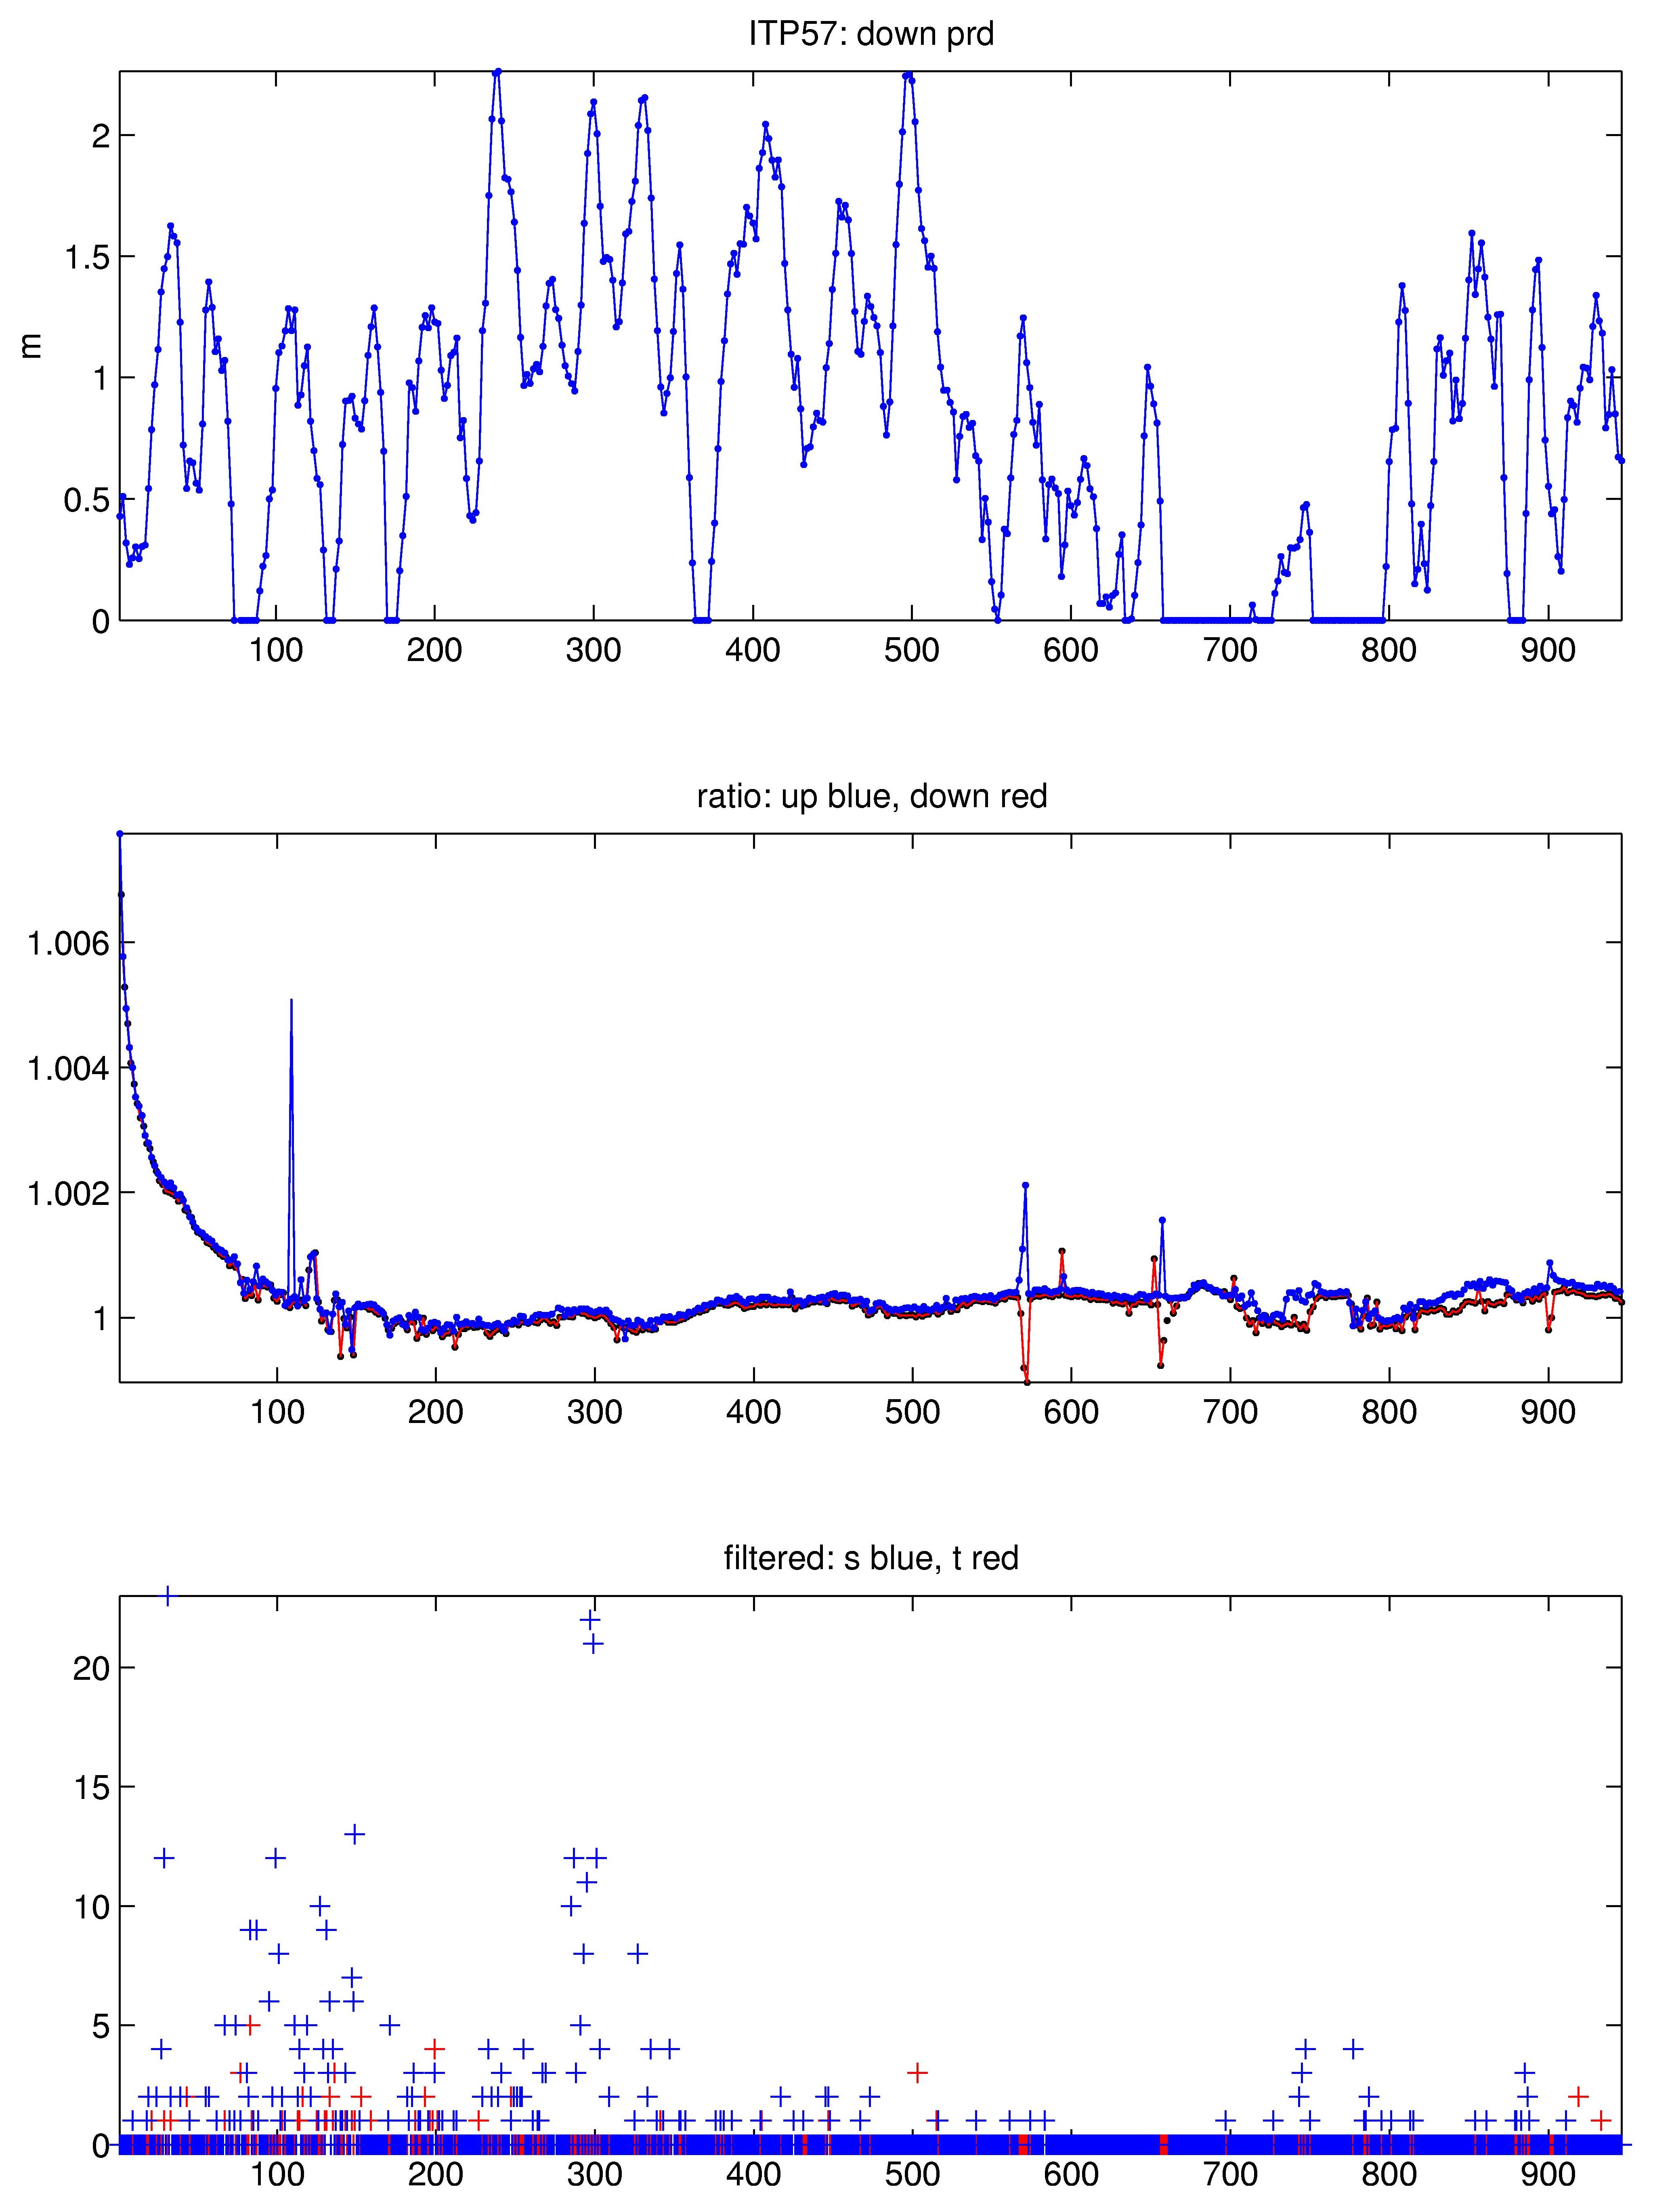
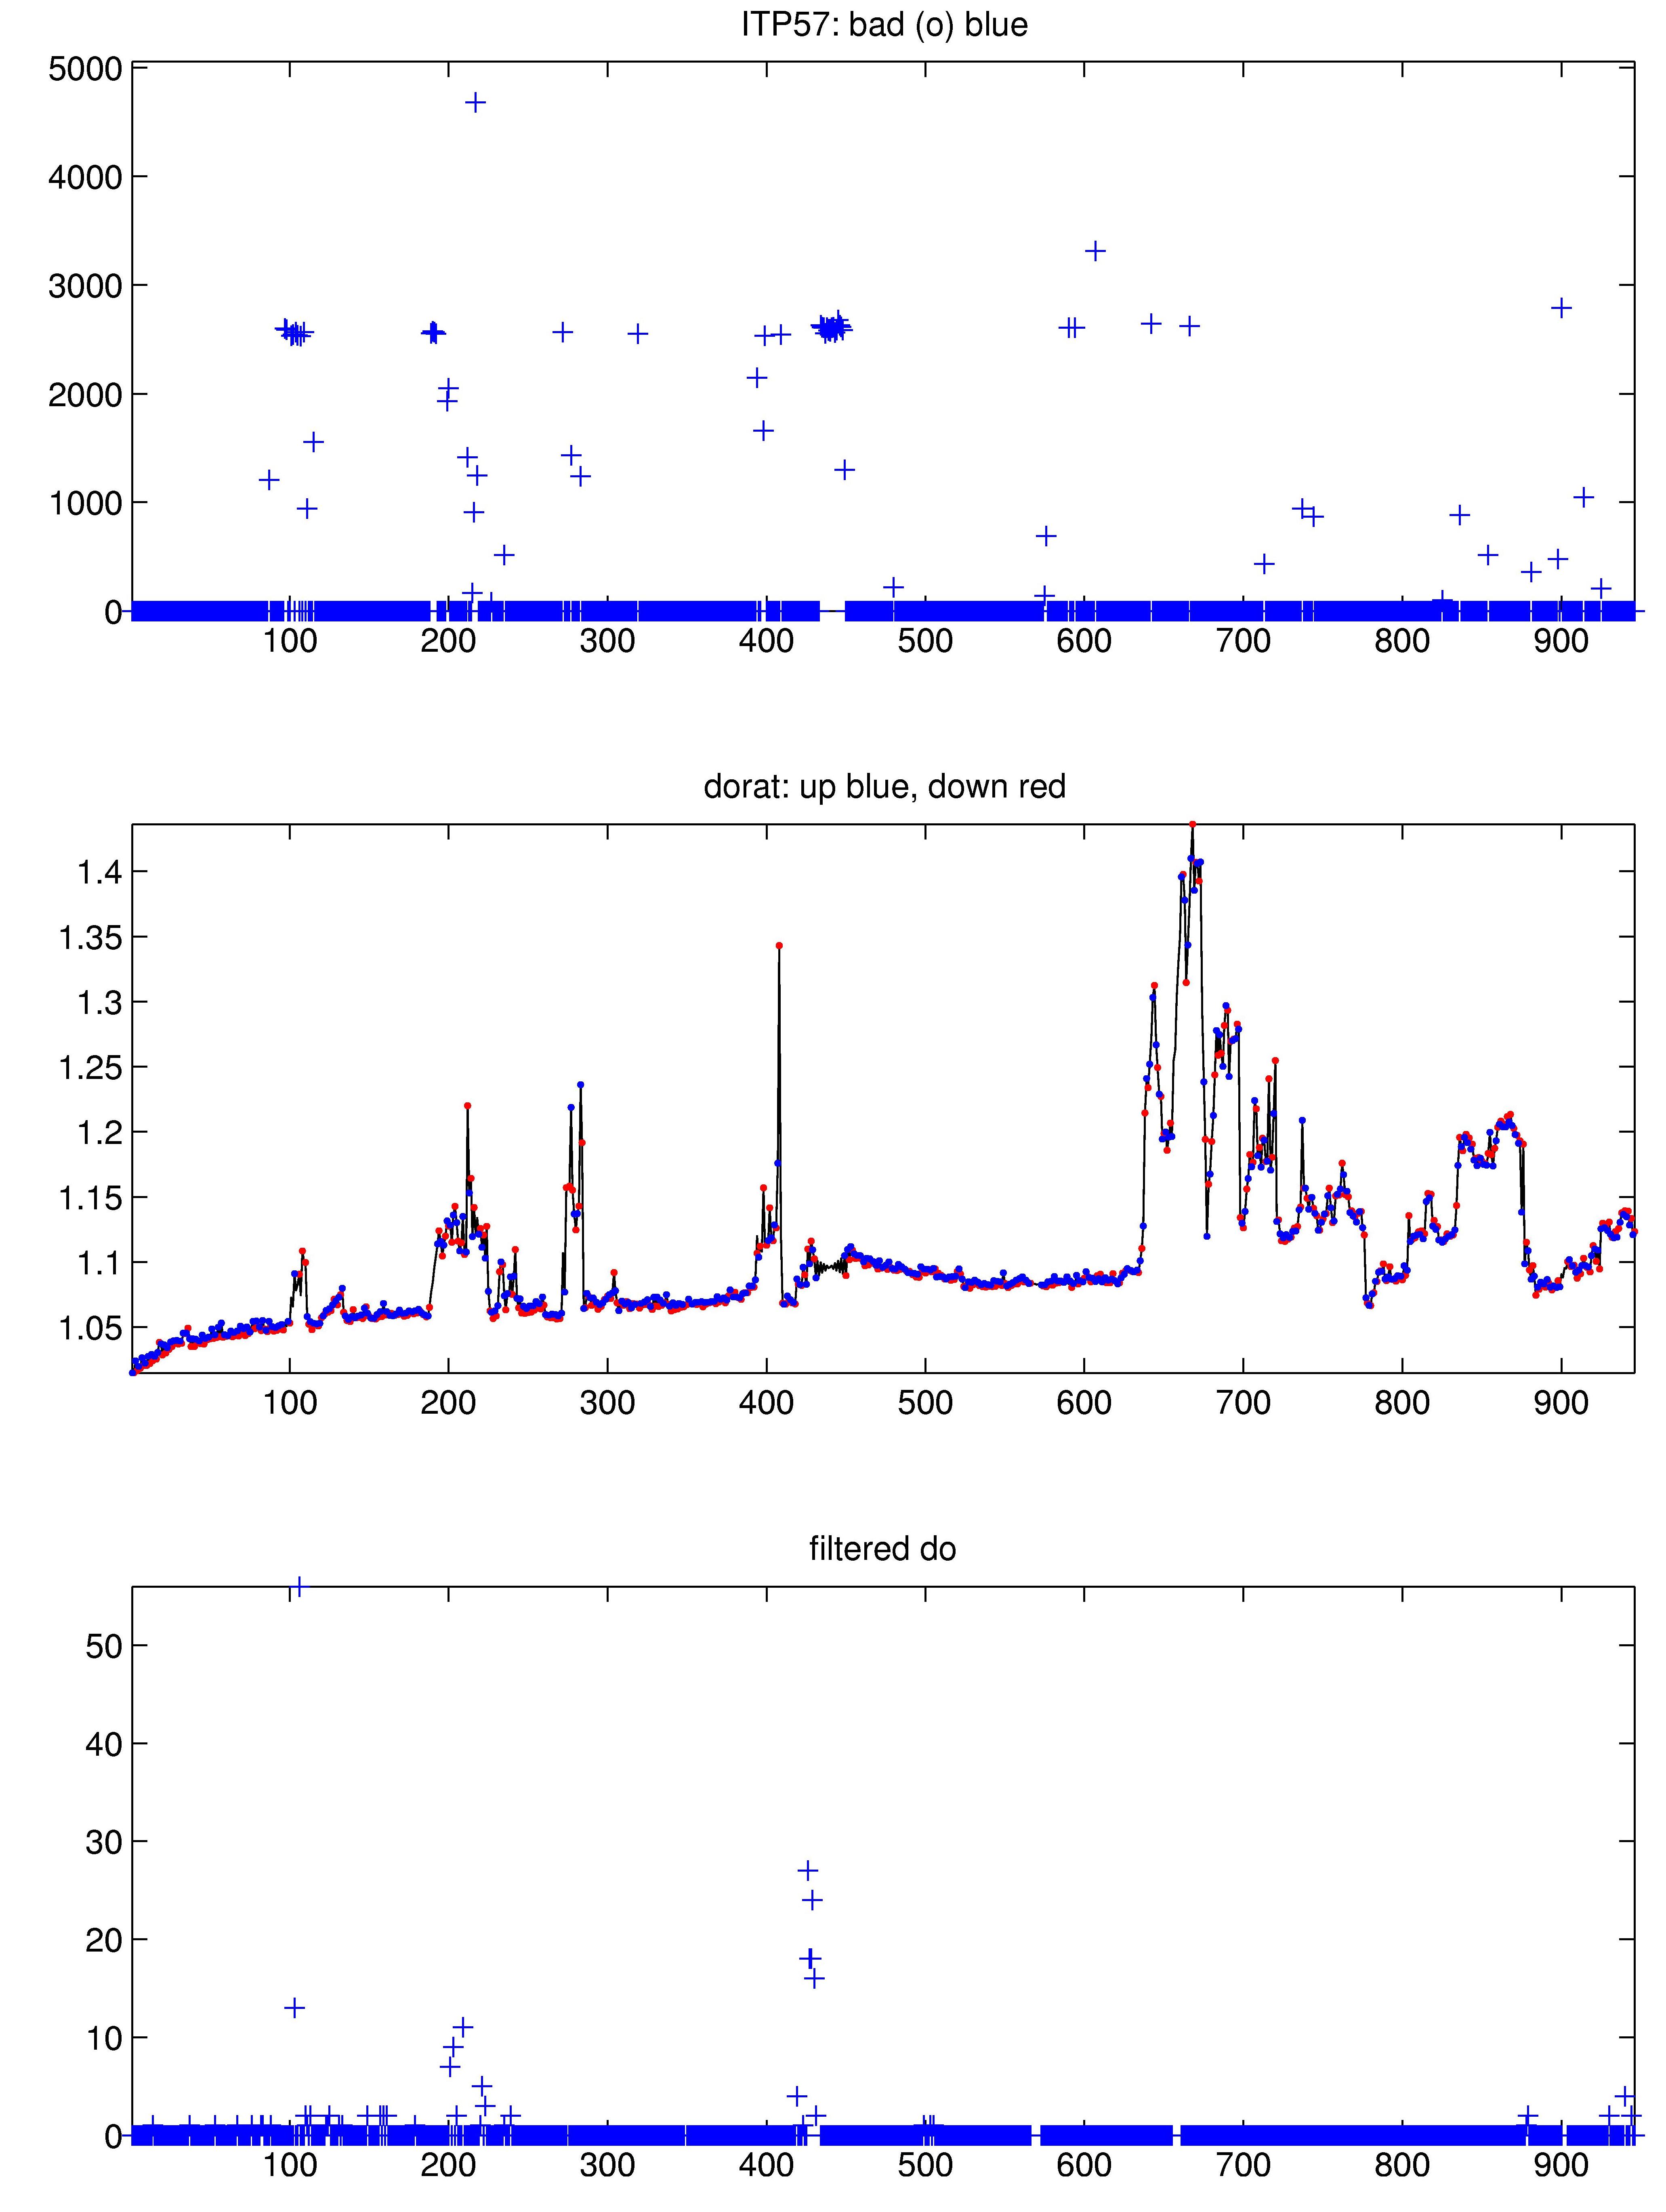
The 946 profiles that were transmitted from the ITP were processed according to the procedures described in the ITP Updated Data Processing Procedures. The processing parameters for this ITP are shown in the figures to the right. Thermohaline staircases were not well defined, especially over the early part of the record, so that initial estimates for CTD lag corrections could not be determined from sharp interfaces. Instead, constant values based on standard values were mostly used and modified slightly where needed to address occasional density spikes and inversions presumably related to reduced flow through the sensors.
Over 96% of the profiles spanned more than 700 m of the vertical range and nearly 90% contained both good temperature and conductivity data. A few small periods of contaminated conductivity profiles were removed (the largest contiguous series consisted of 6 profiles, with a total of 20 for the whole record). Some small amount of up/down hysteresis remains for a few short periods (e.g., profiles 730 to 740 and 840 to 870).
See the Data Products tab to the left for descriptions of the three levels (I, II, III) of data processing and to access all data.
