ITP 9 Data Processing
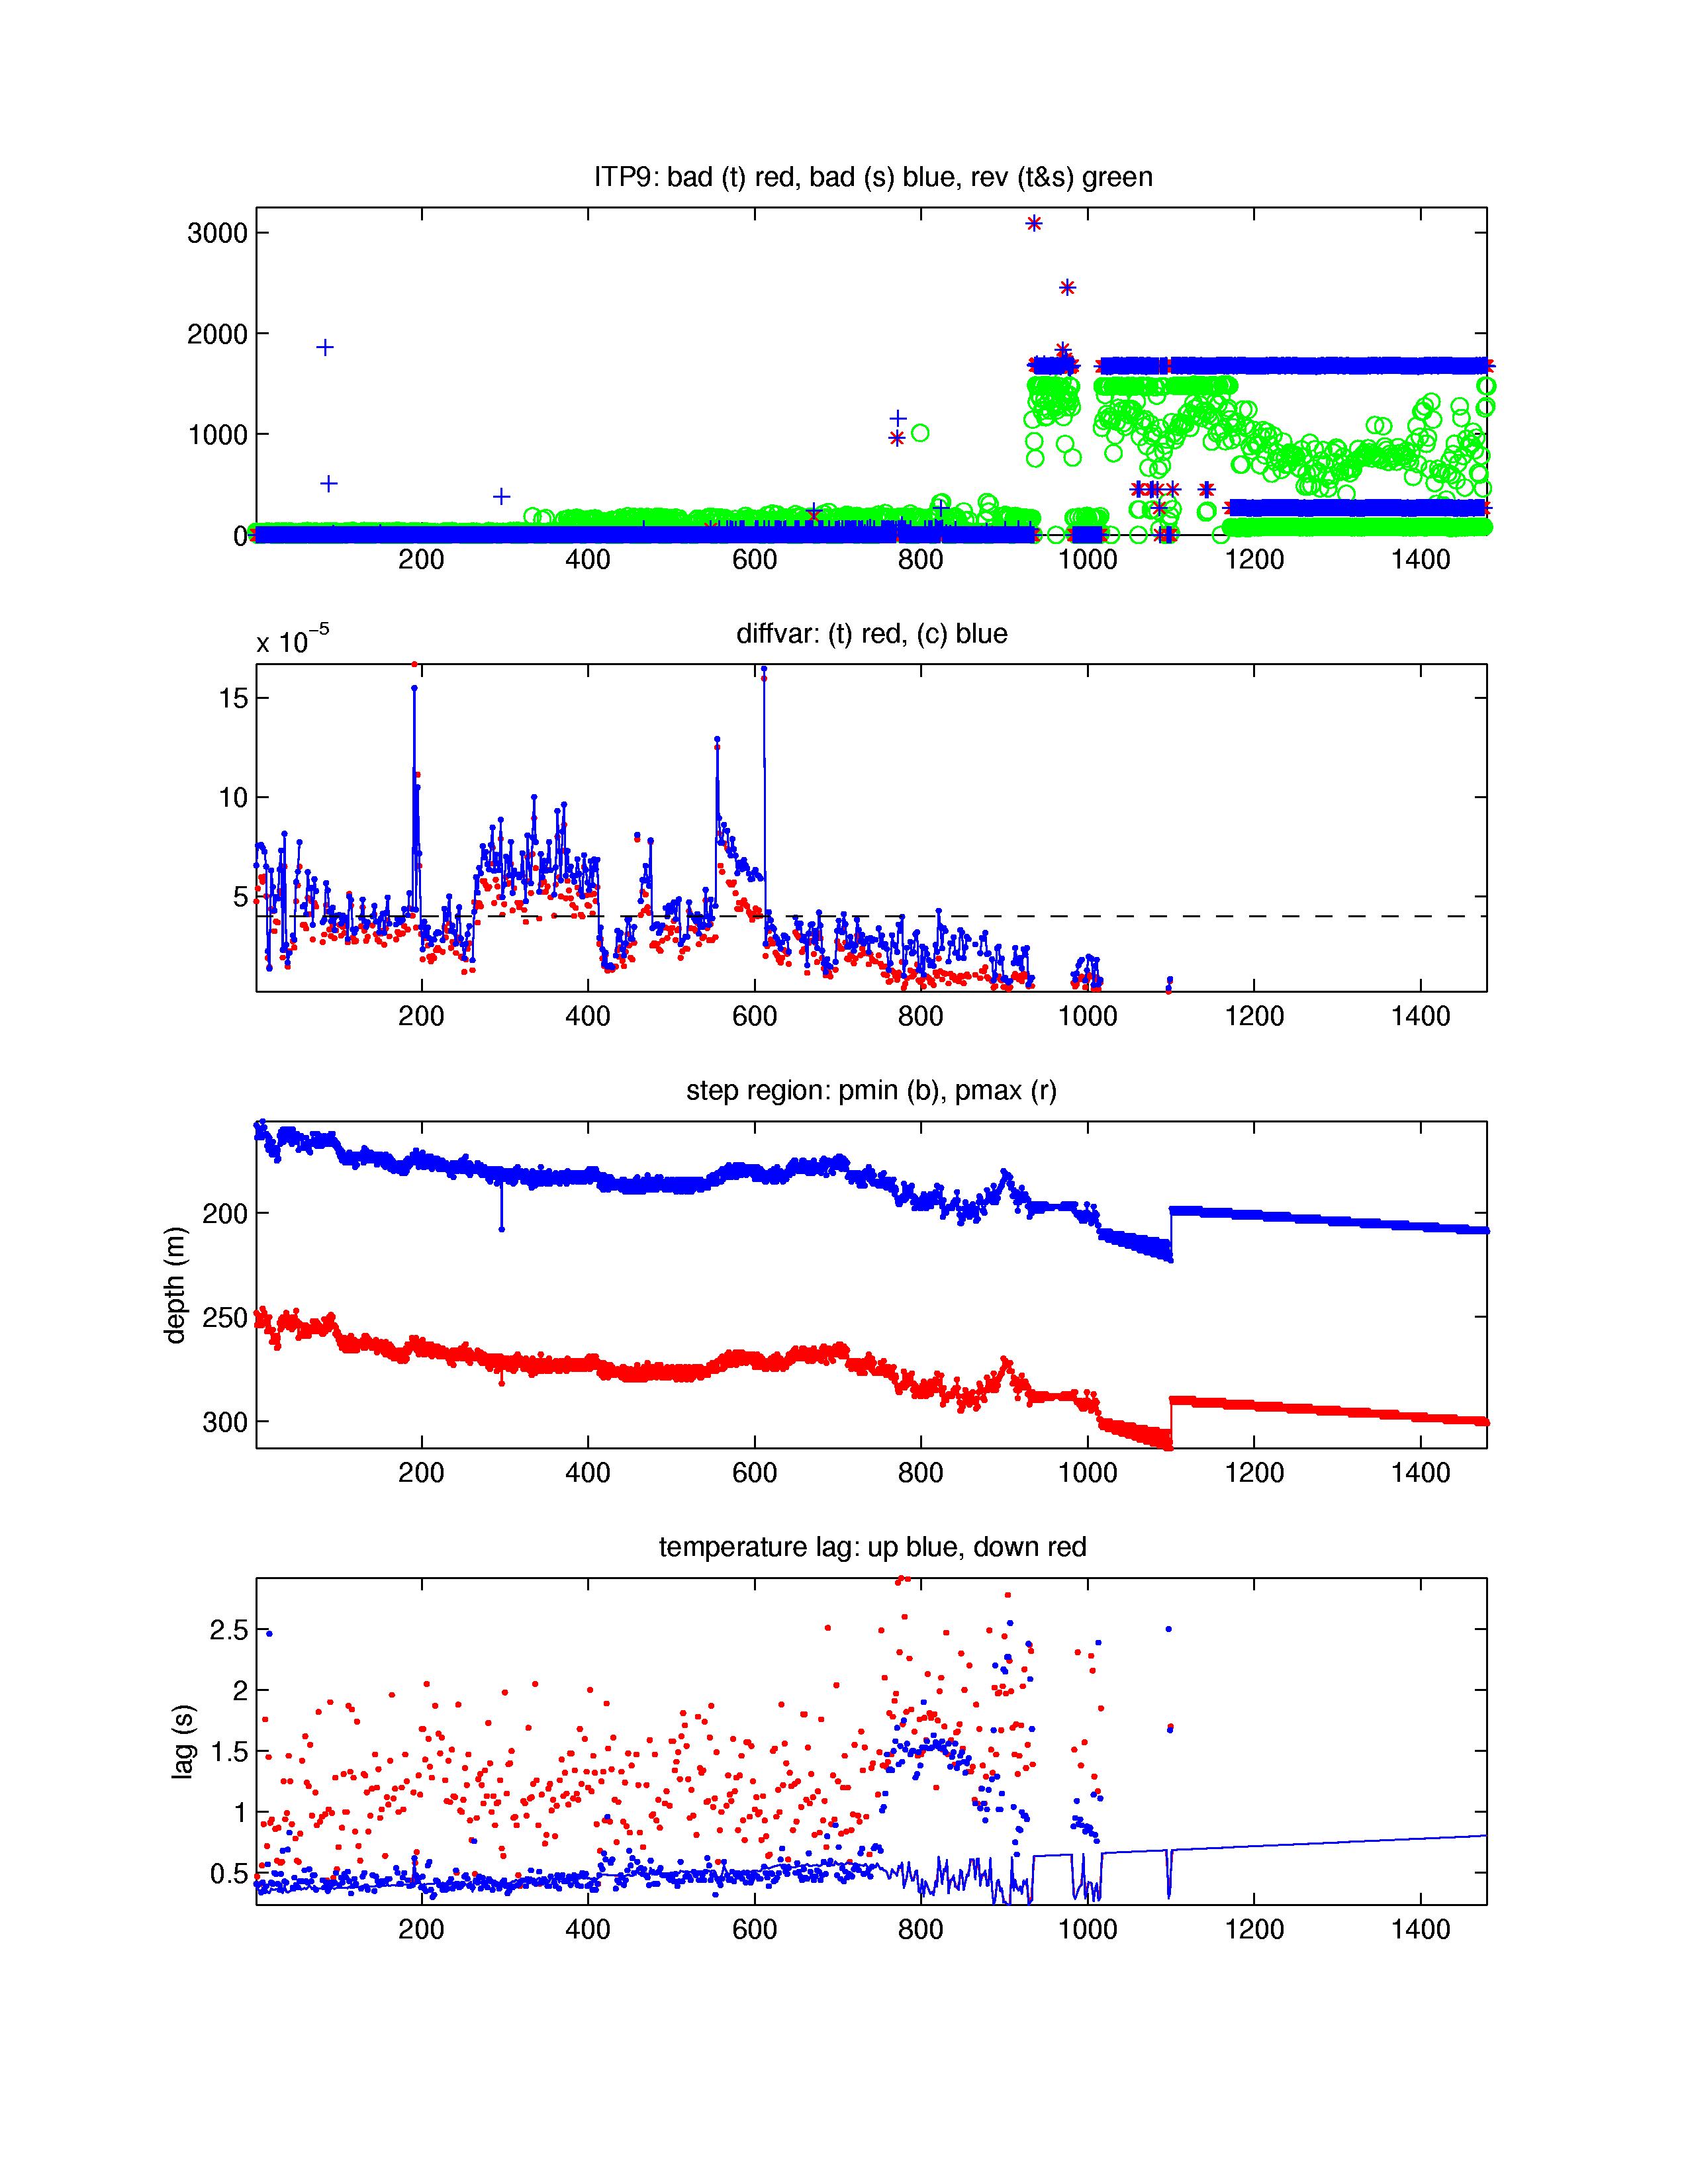
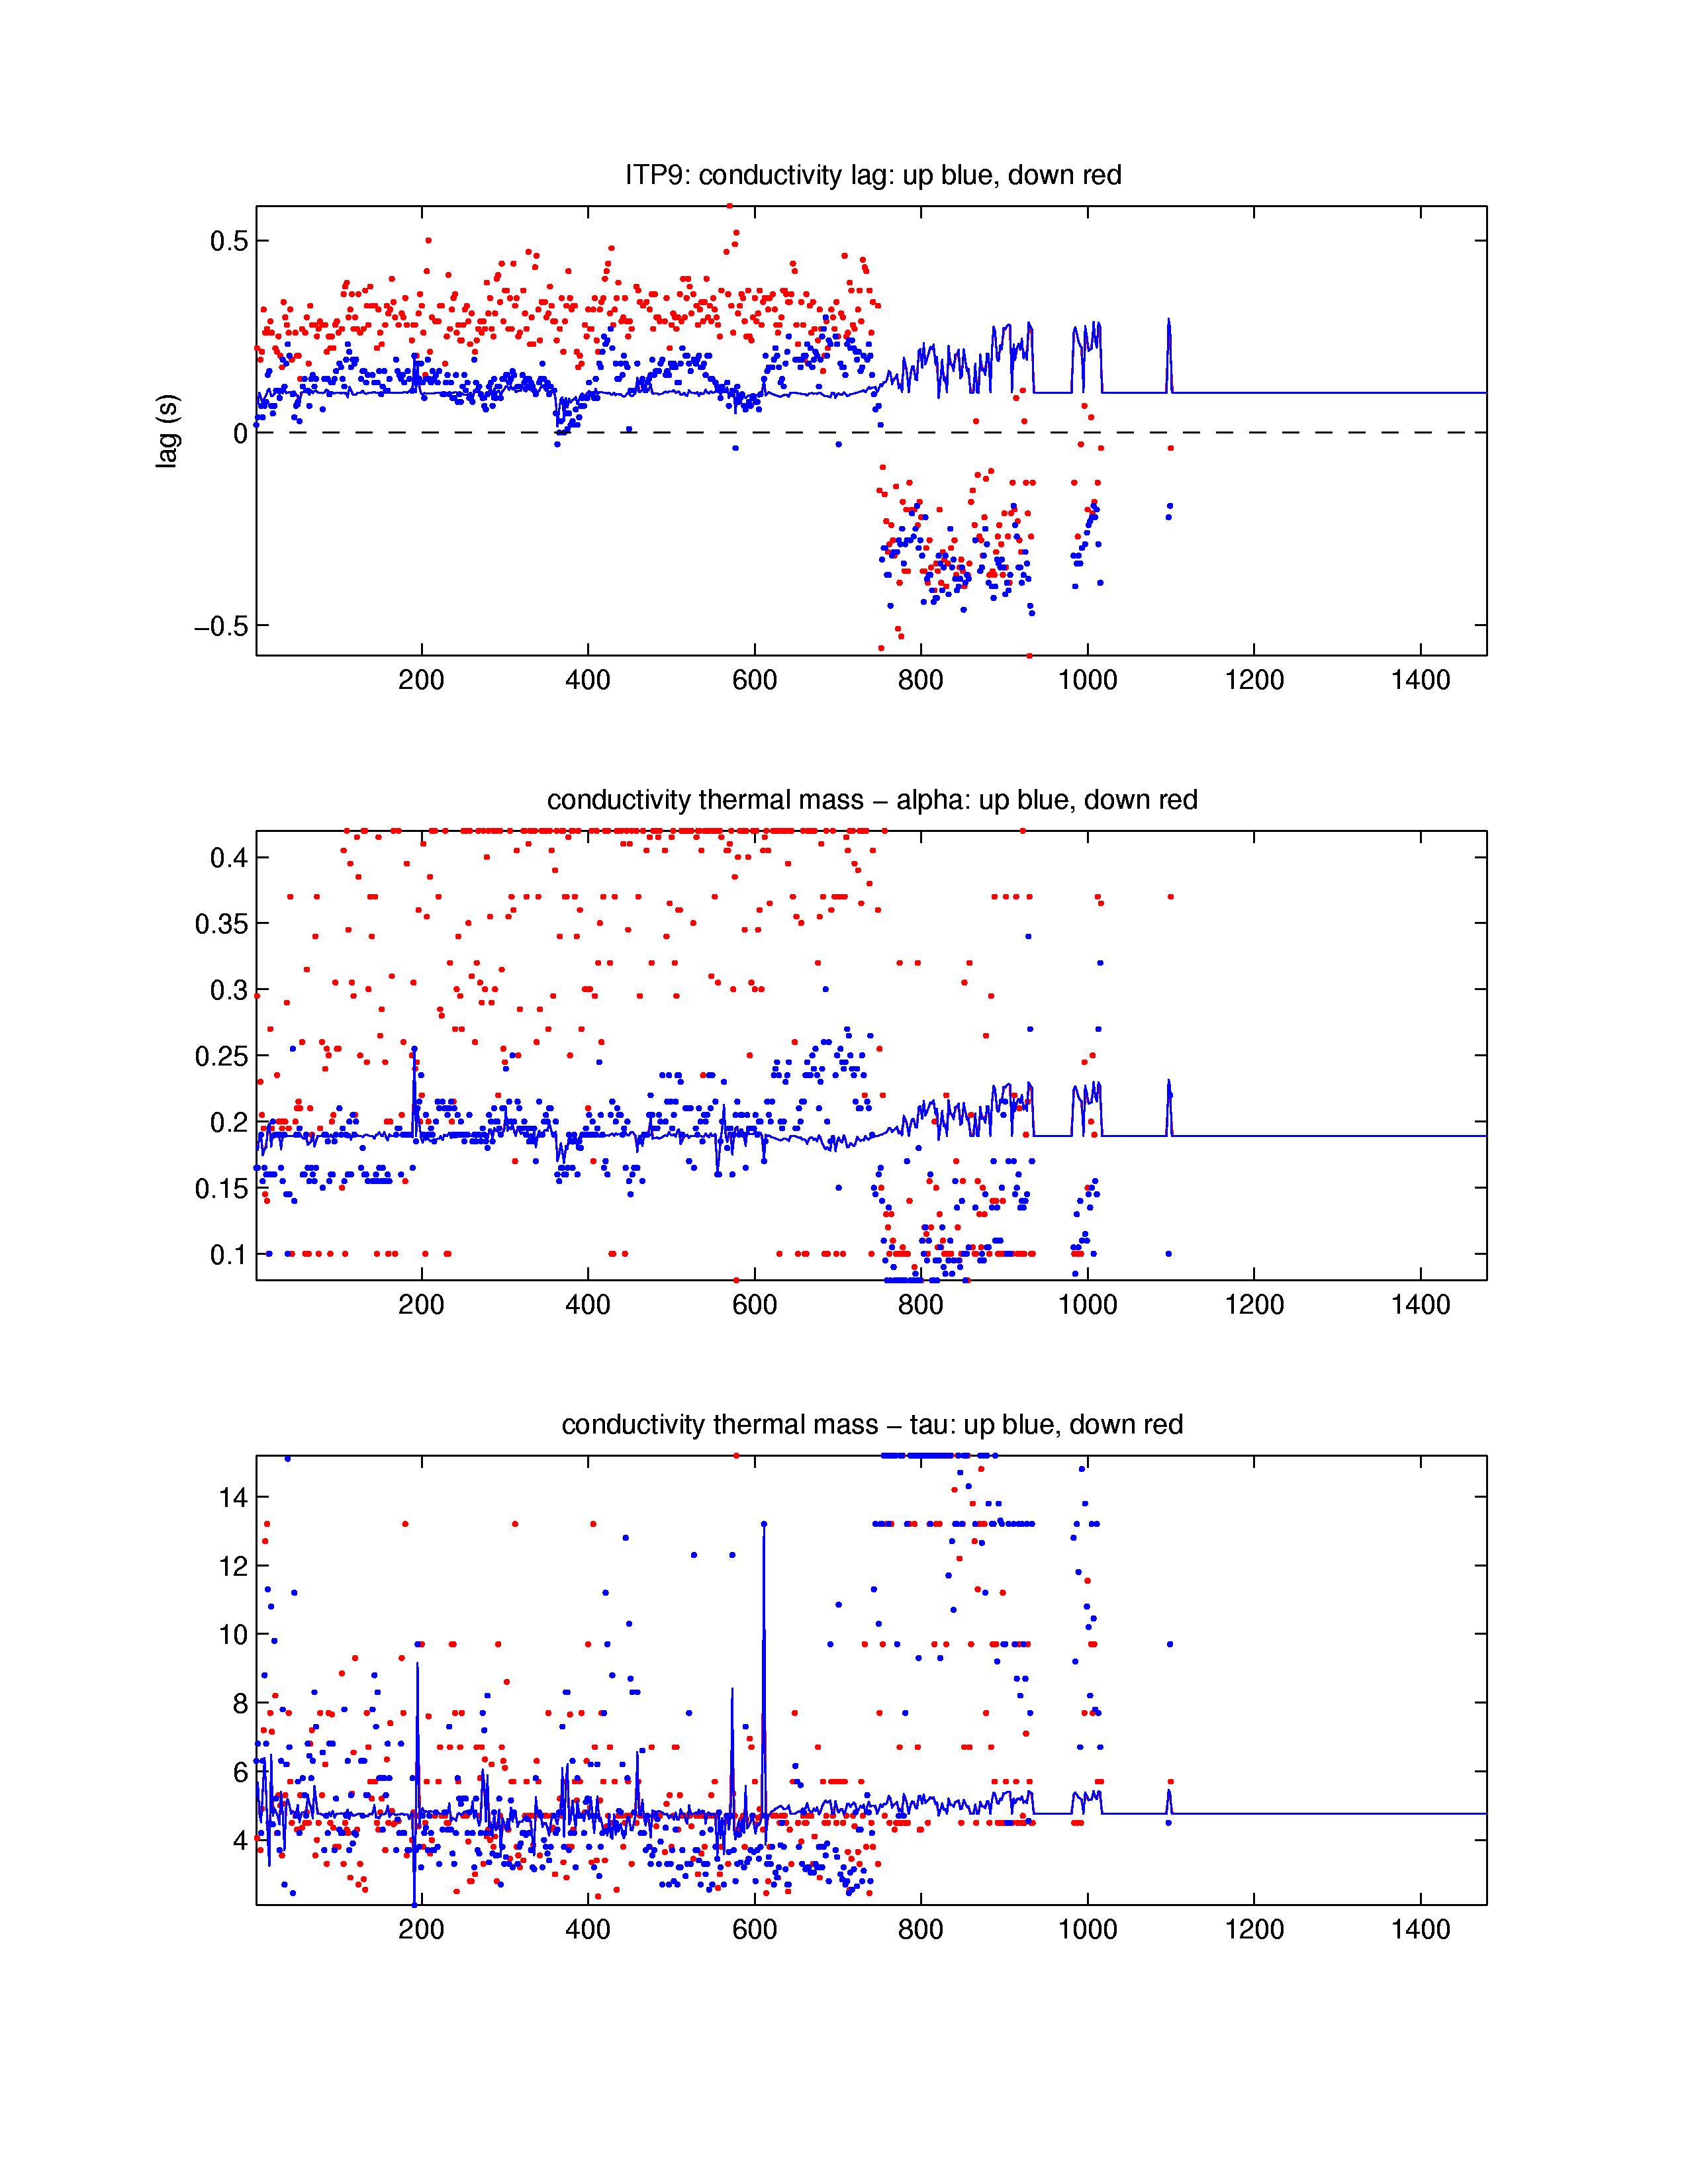
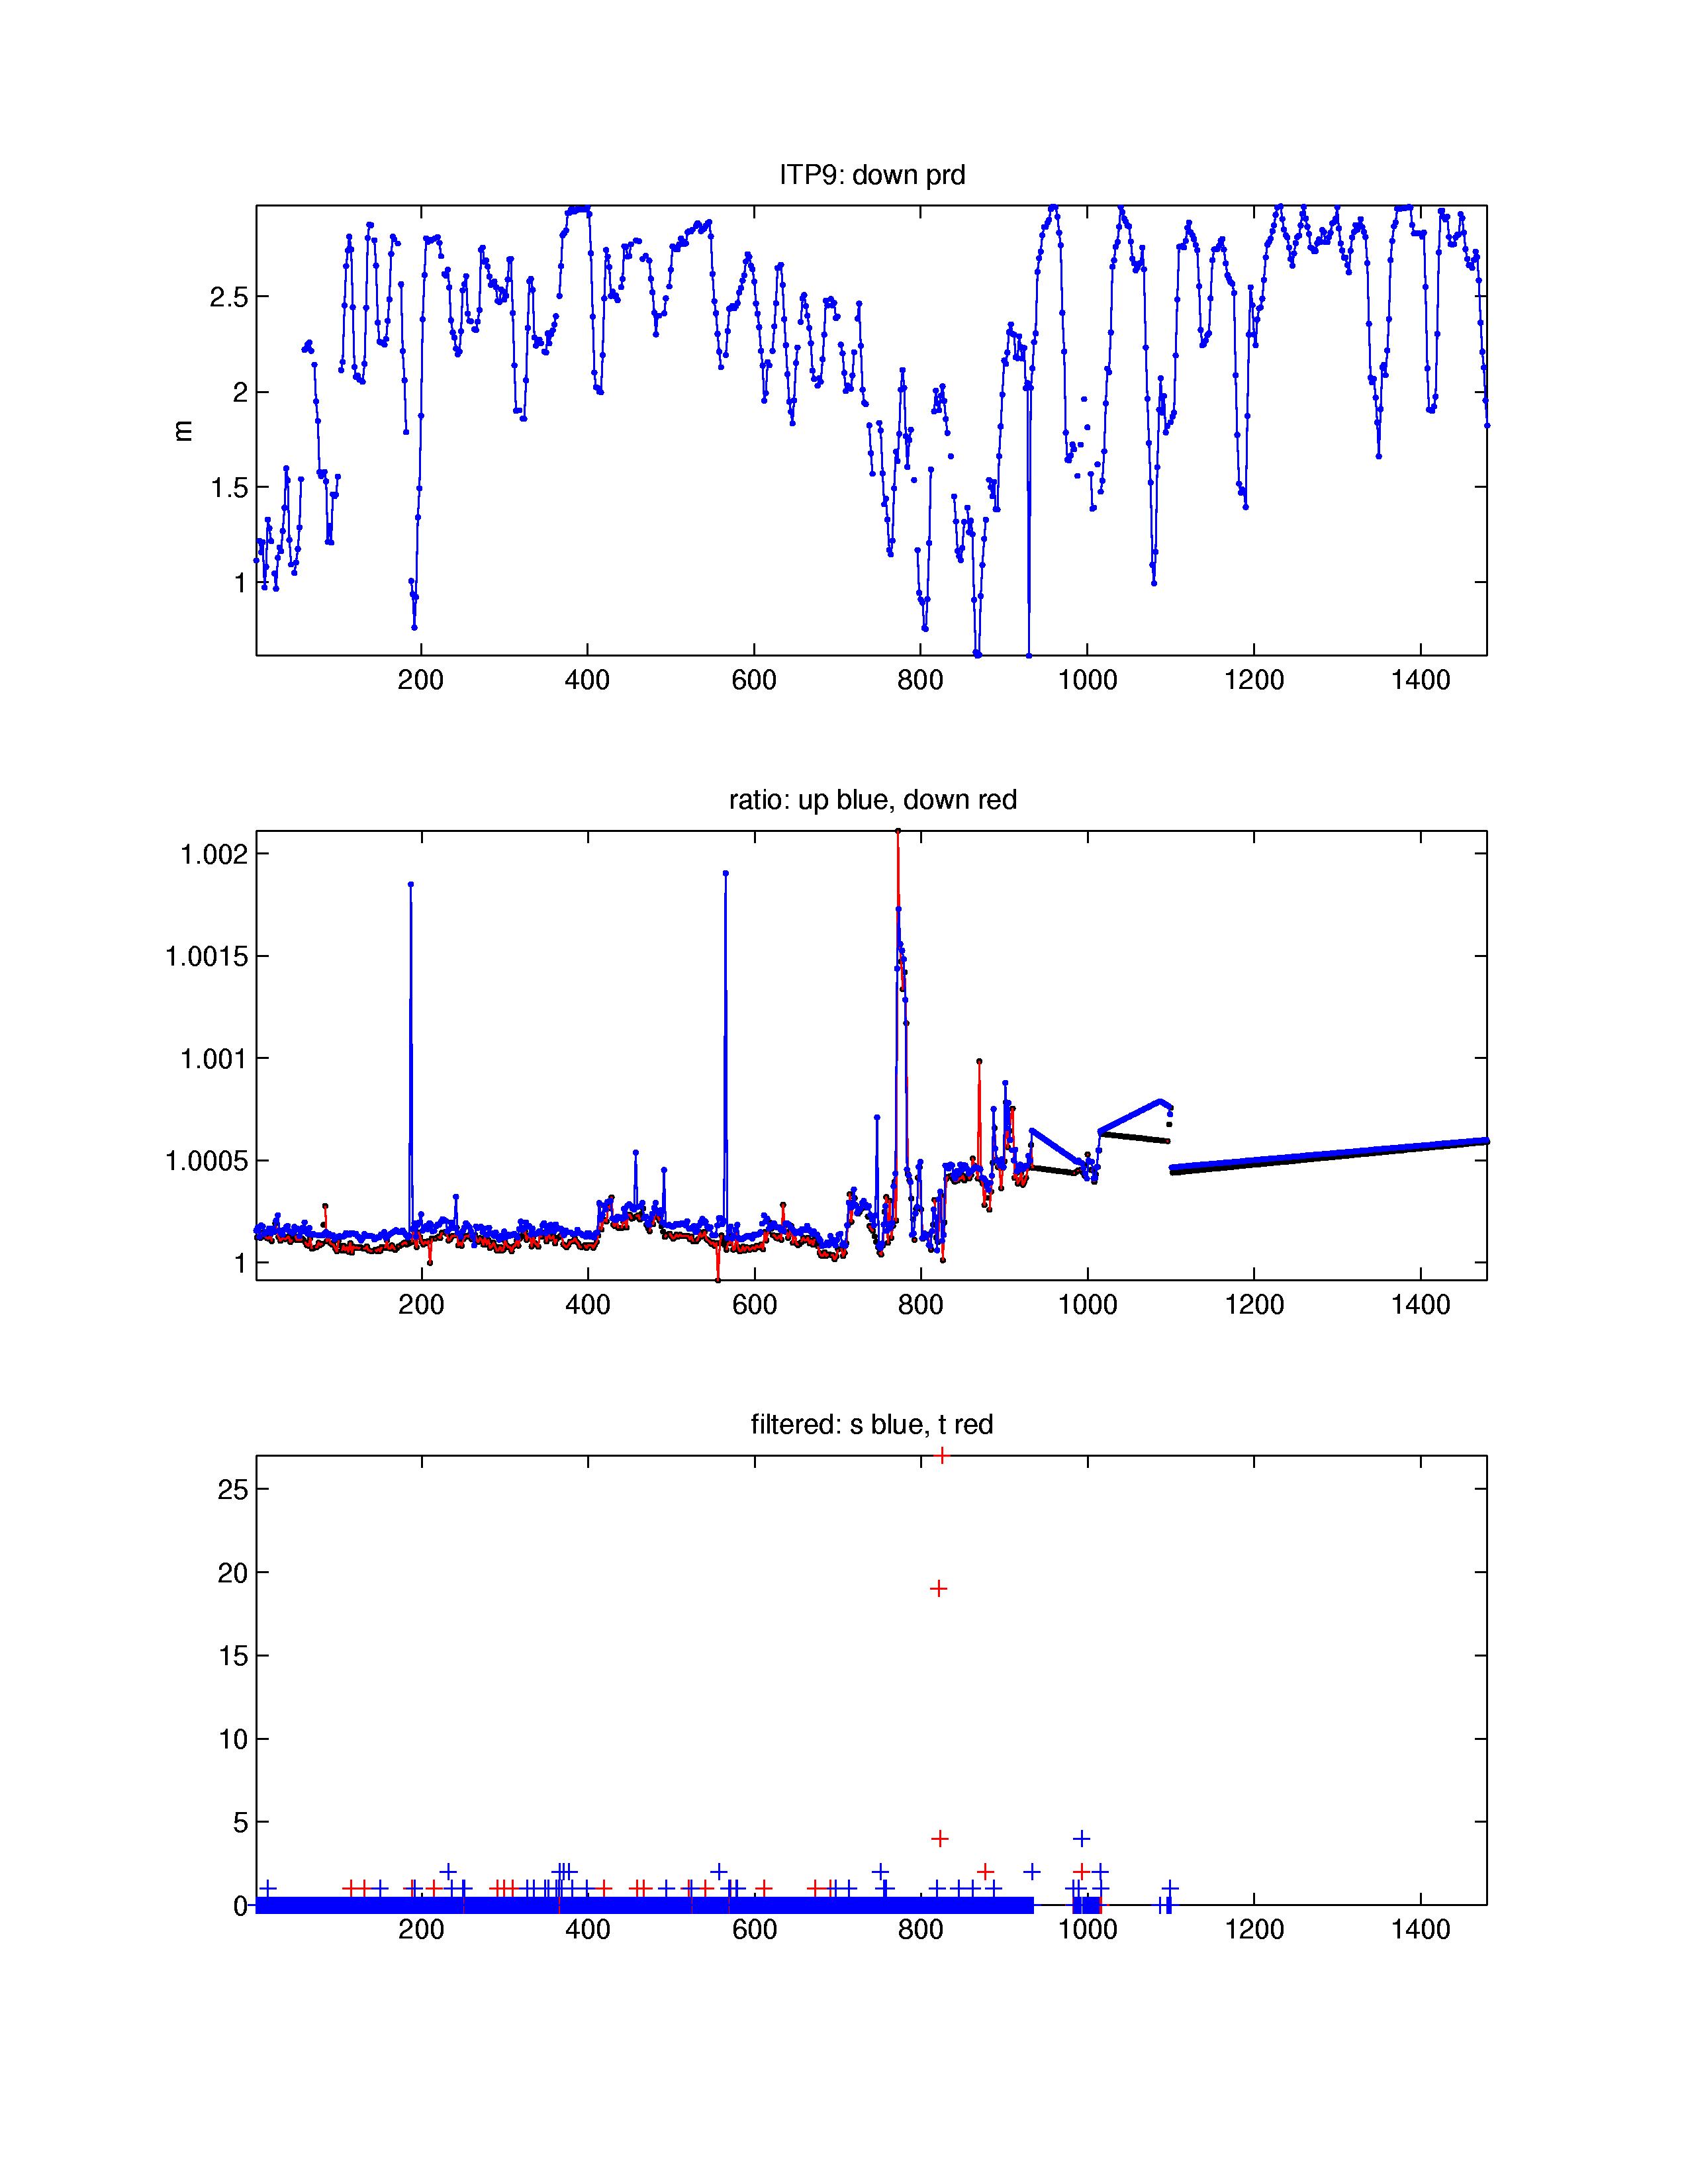
The 1480 attempted profiles that were retrieved from the ITP profiler were processed according to the procedures described in the ITP Updated Data Processing Procedures. However, only 883 (or about 60%) were uncorrupted or non-stationary, as a result of the mooring and profiler dragging in shallow bathymetry west of Ellesmere Island. The processing parameters are shown in the figures to the right.
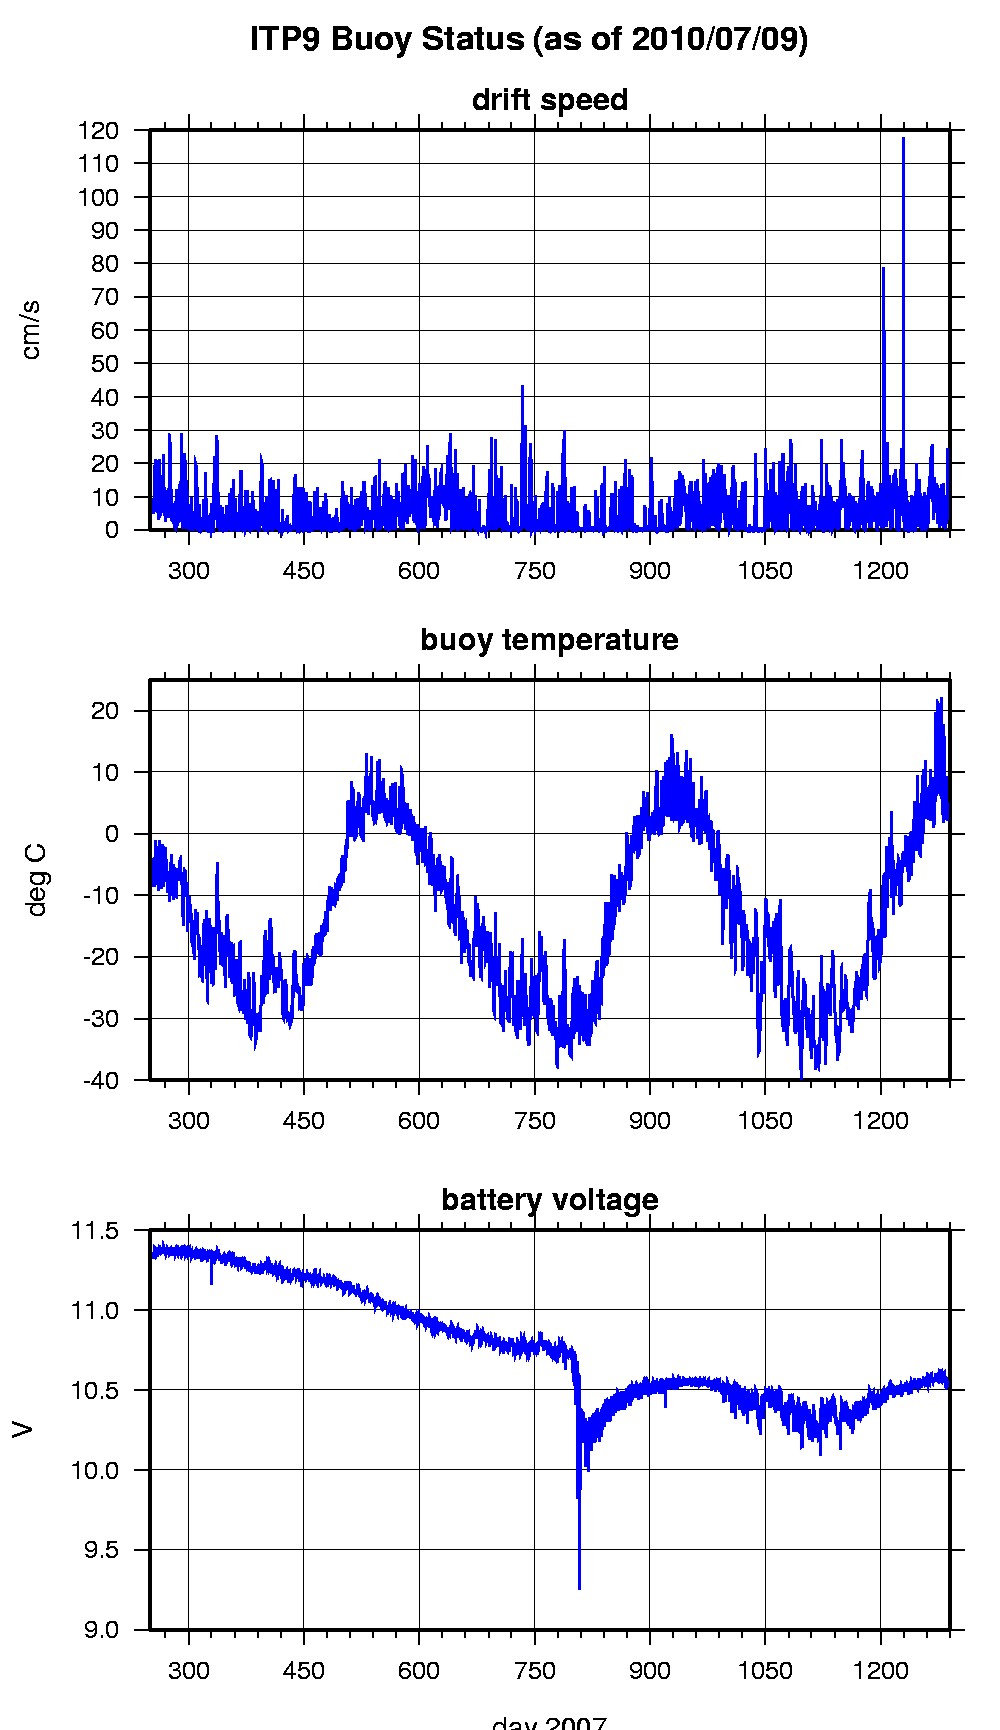
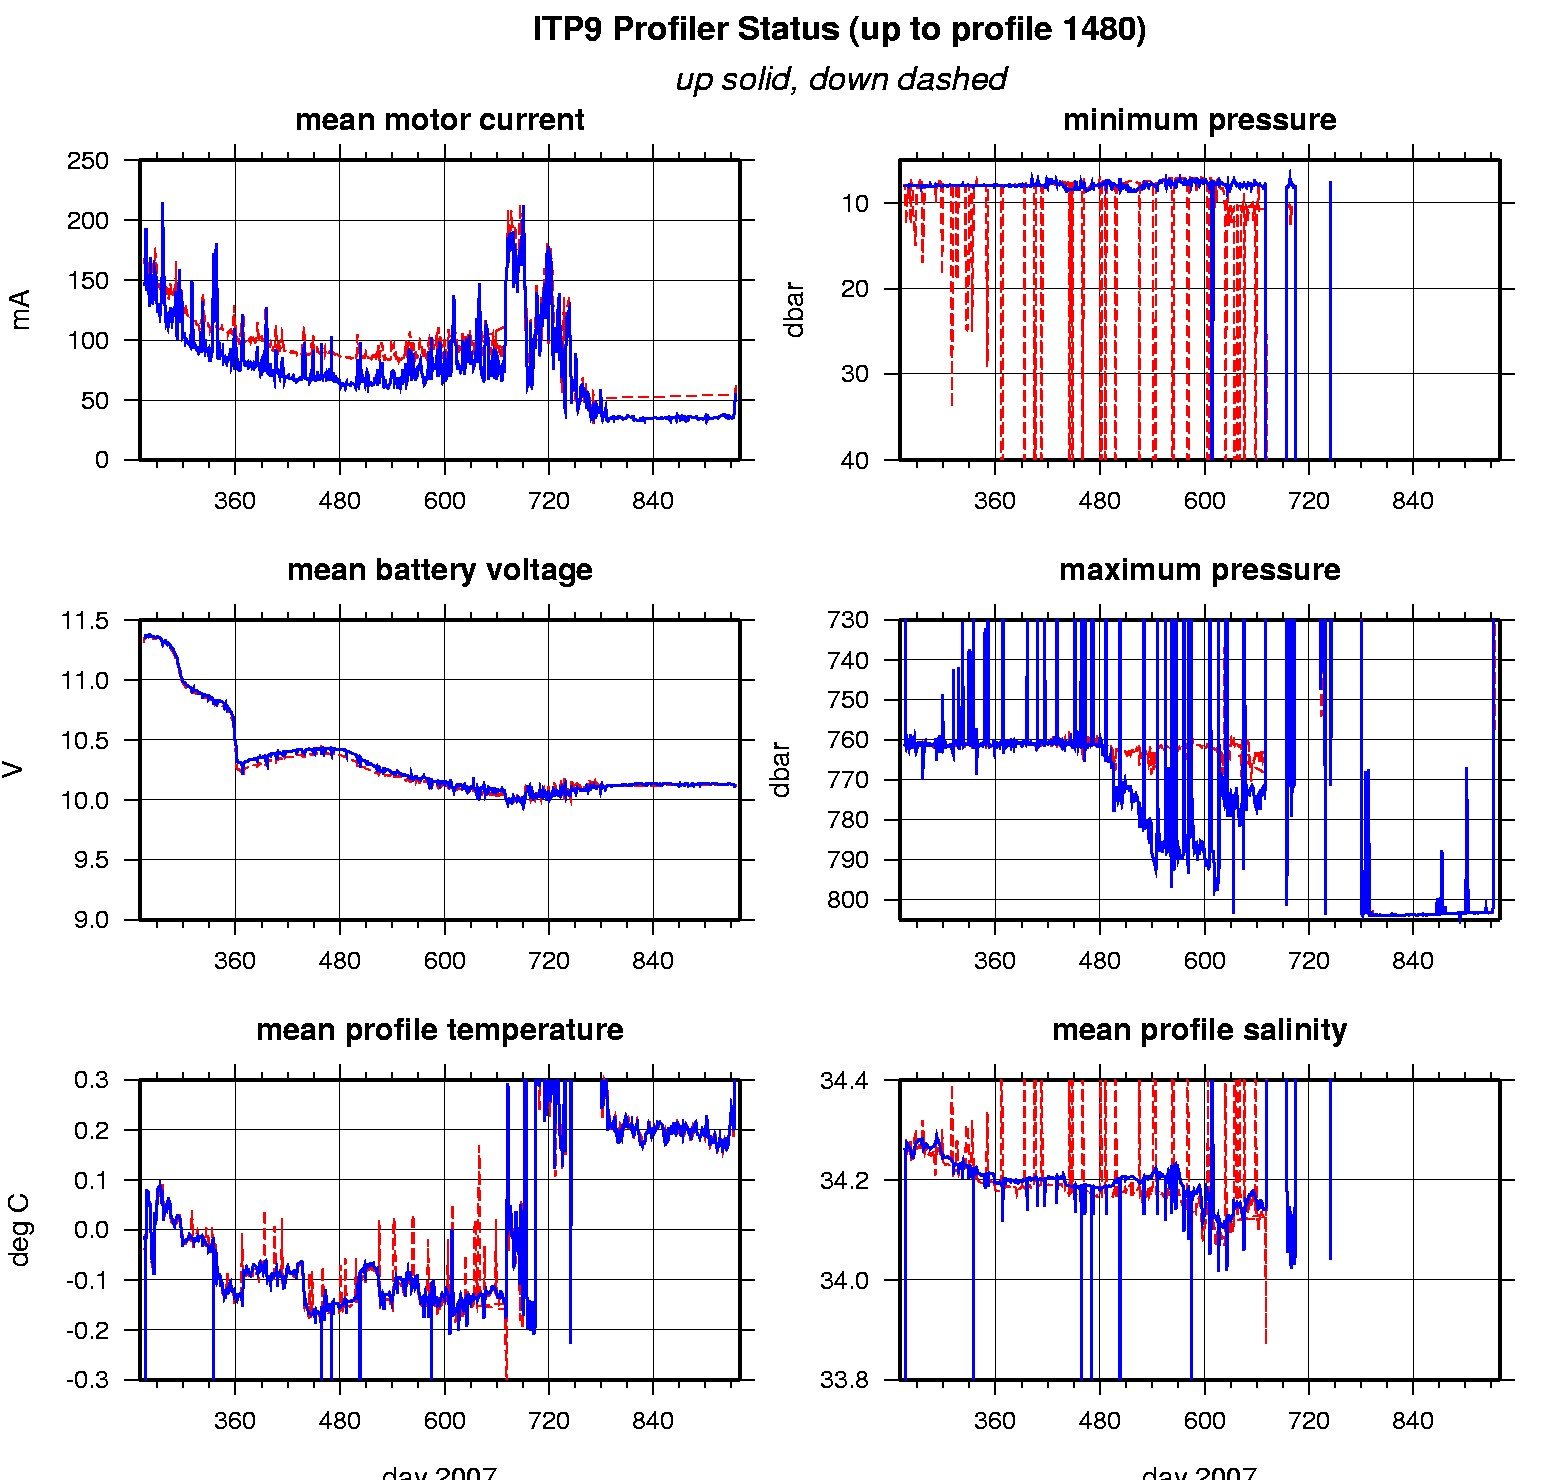
Drift speeds were such that the profiler did not seem to be hindered from completing full vertical profiles due to hydrodynamic drag, however, due to a software overflow bug, ITP 9 experienced 99 resets with complete loss of data for these profiles, and typically incomplete vertical coverage for the subsequent profiles. The mooring anchor (tether length = 790 m) was dragged over shallow topography and the profiler was unable to profile at all between profiles 935 to 982 (bathymetry ~600 m, instrument stopped ~250 m) and 1017 to 1086 (bathymetry ~680 m, instrument stopped ~600 m), although it was able to recover and obtain additional profiles between these intervals up until profile 1100 (bathymetry <500 m, instrument on bottom) when the profiler vertical movement became severely limited. After the bathymetry deepened again (around profile 1170), the profiler remained at the bottom of the mooring for the rest of the deployment.
This unit also experienced a unique apparent failure in the pressure sensor related to the state of the motor operations. Beginning around profile 400, and progressively worse after profiles 500 and 800, the data from the pressure sensor began shifting during the 30 seconds when the motor current ramps up, and exhibiting spikiness during the motor operation. A special routine removes and corrects for this noise in the final processing. Thermohaline staircases were found in some profiles enabling estimation of sensor lag corrections (which did not vary greatly).
See the Data Products tab to the left for descriptions of the three levels (I, II, III) of data processing and to access all data.
